5505 W Tulare Ave #113 · Visalia, CA
Flood risk 1/10 · Minimal
- FEMA flood zone
- X (shaded)
- Chance of flooding over 30 yrs
- 0.0%
- Est. flood insurance / yr
- $507 – $1,088
Fire risk 5/10 · Moderate
- Est. fire insurance / yr
- $659 – $1,223
Heat risk 8/10 · Major
- Hot days now (above 105°F)
- 7 days/yr
- Hot days in 30 yrs
- 17 days/yr
Wind risk 1/10 · Minimal
- Chance of severe wind over 30 yrs
- —
Air-quality risk 10/10 · Severe
- Unhealthy air days now
- 37 days/yr
- Unhealthy air days in 30 yrs
- 39 days/yr
Risk factors via First Street. Map © Google.
Why this score? — see what drove the D- grade
The composite is a weighted blend of 9 inputs, each scored 0–100. Each bar is that input's sub-score; the figure is the points it added to the 100-point composite (weight × sub-score).
- 1% rule +10.0/10.0
- Cash flow +7.9/30.0
- ARV discount +4.0/15.0
- Livability +3.6/5.0
- Rent growth +3.3/5.0
- Schools +3.0/10.0
- Condition / age +2.2/5.0
- DSCR +2.0/10.0
- Appreciation +0.0/10.0
$48,500
🖨 Deal sheet (PDF) 📄 Offer letter ✓ Due diligence
Listing remarks MLS
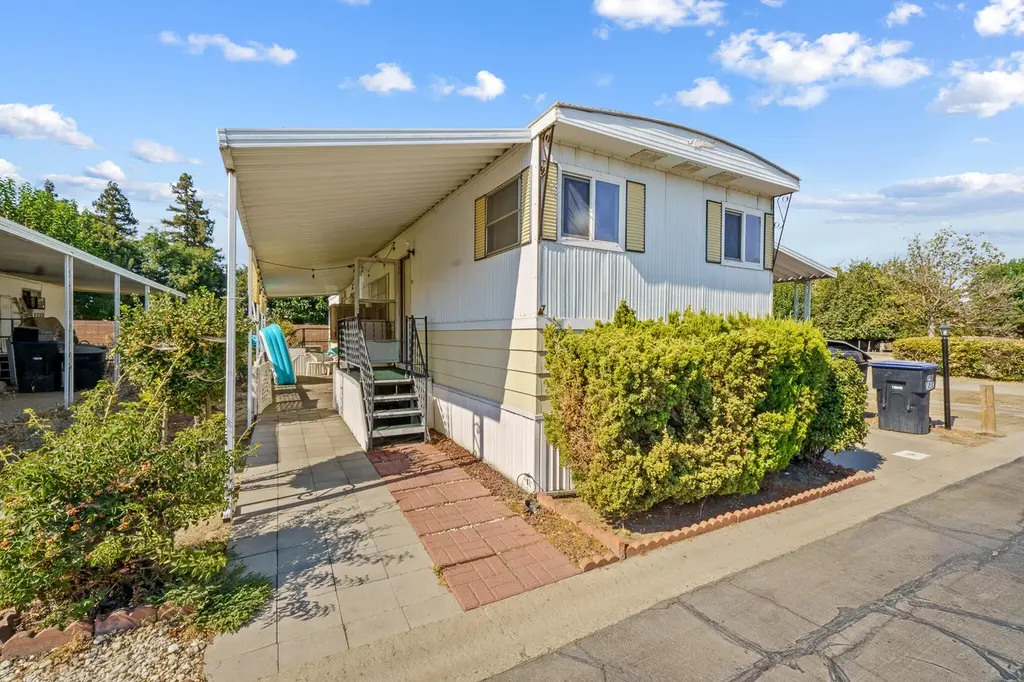
Located in Southwest Visalia, where new residential communities, expanded shopping, and improved roadways are adding even more convenience to the area, this 2 bedroom, 1 bath manufactured home blends comfort with accessibility. Inside, laminate flooring runs throughout, with ceiling fans in both bedrooms for year round comfort. The open kitchen overlooks the living room and offers abundant counter space, perfect for cooking or entertaining. The bathroom also serves as a laundry area for added functionality. Outside, enjoy a covered carport, covered porch, and a large storage shed. The well-maintained community features a pool, community center, and quick freeway access, putting you minutes from Visalia's growing mix of dining, retail, and recreation.
Key facts
- Covered porch
- Laminate flooring
- Covered carport
Tags
Neighborhood map
What this means for you Summary
Snapshot
- This is a 2-bed/1.0-bath manufactured listed at $48k. Condition is rated fair.
Deal economics
- At list price, monthly cash flow is $-52 ($-622/yr) — negative.
- To cash-flow at today's rent, offer at most $41k (15.5% below list).
- Meets the 1% rule at list price ($2k rent vs $48k).
- Recommended offer: $41k (15.5% below list) — sets the bar for cash-flow.
- Cap rate 5.0% vs local median 3.3% in Visalia — top-decile yield for the area; either an underpriced asset or a hidden risk that comps aren't pricing in. Stress-test before assuming the spread holds.
Location & tenants
- Location reads 72/100 on livability (#196 in CA) — a middle-class / working-renter tenant base. Strengths: commute A+, housing A+, employment B; Watch: amenities D, crime D-, cost of living F.
- Visalia Unified (urban): math 30% / reading 40% proficiency, ranked #273 of 517 in CA (top 53%) — families likely to look elsewhere, expect single-tenant / working-renter base with shorter leases.
- Zoned schools: Veva Blunt Elementary (math 24% / reading 75%, grade D+, #387 of 1,571 statewide, top 26%, 545 students, 80% FRL); La Joya Middle (math 24% / reading 54%, grade F, #155 of 498 statewide, top 31%, 758 students, 63% FRL); El Diamante High (1,987 students, 55% FRL).
- Market conditions: Rents rising (+3.3%/yr); 239 active listings in the ZIP; 22 comparable units currently listed for rent nearby; rentals lingering (median 46d on market — plan ~5-8 weeks vacancy on turnover, expect pricing pressure); 50% of comp listings sitting > 30 days — soft ceiling on asking rent; solid renter incomes; 1,447 units permitted in Tulare County in 2024 (307 in 5+ unit buildings).
Forward outlook
- Local home prices are declining (-3.0%/yr); year-one equity from $335 of loan paydown is wiped out by about $1k of value loss. Plan a longer hold.
- Tulare County population projected at +10% by 2050 — modest demand growth; plan on rents tracking national, not racing it.
Negotiation context
- It's been on market 313 days — a 12% lower offer ($43k) is reasonable based on typical stale-listing flexibility.
Risks & watch-outs
- Watch-outs: HOA is 61% of rent; built in 1900 — expect roof / HVAC / electrical / plumbing capex.
- Climate carrying-cost: moderate wildfire risk; extreme-heat days projected 7→17/yr by 2055 (HVAC capex compounding) — expect insurance premiums to compound above CPI over the hold.
Questions for the listing agent
- What do current leases actually rent for vs. the listed asking? Can we see a recent rent roll and the last 12 months of T-12 income?
- It's been on market 313 days. Have you received any prior offers? Is the seller open to a 15% concession, seller financing, or rate buy-down credit?
- Have any recent inspections been done? Can we get a copy of the seller's disclosures and any deferred-maintenance estimates?
- Built in 1900 — when were the roof, HVAC, electrical panel, plumbing, and water heater last replaced?
- What does the HOA fee cover, when was the last increase, and are there any pending special assessments or reserve-fund shortfalls?
- Why hasn't it sold? Are there any deal-killer items the seller is aware of (foundation, flood, title, zoning, code violations)?
- Is there a deadline driving the sale (1031 exchange, divorce, estate, relocation)? That informs how much negotiation room exists.
- Crime grade is D in this area — have there been break-ins, vandalism, or insurance claims at this property in the last 3 years? What carrier currently insures it and at what premium?
- The area grade is low — what's the realistic commute time and amenity access for the typical tenant pool here? Any planned neighborhood developments (good or bad) we should know about?
- What's the average days-on-market for RENTAL listings here right now (not sales)? A rising rental-DOM trend means longer vacancies and softer asking-rent achievability than the comps imply.
- What's the recent tenant-quality profile in this submarket — average credit score on applications, eviction rate, late-payment / NSF rate, and stable-employment percentage? A property-management company in the area should have these aggregated.
- How much new for-sale + rental construction is in the pipeline within 1–3 miles? Heavy new supply typically softens prices + rents 12–24 months out; constrained supply supports both.
Investment metrics
- 1% rule
- 3.18% ✓
- Cap rate
- 5.01%
- Cash-on-cash
- -4.58%
- DSCR
- 0.80
- GRM
- 2.6
CMA / ARV
- ARV (median comp)
- $45,000
- List price
- $48,500
- Delta
- 7.78%
- Verdict
- FAIR
- Comps
- 5 within 2.0 mi
Projected returns pro-forma
-3.0% appreciation · 3.32% rent growth · sell at horizon
- IRR
- -20.8%
- Equity multiple
- 0.26×
- Total profit
- $-10,067
- Equity at exit
- $7,232
- IRR
- -9.1%
- Equity multiple
- 0.37×
- Total profit
- $-8,538
- Equity at exit
- $4,193
Cash invested: $13,580 (down + closing). Projections, not guarantees.
Landlord ↔ Tenant lean methodology
- Overall (STATE)
- 18 Strongly Tenant-Friendly
- State California
- 18 Strongly Tenant-Friendly · D+13
- County
- — inherits STATE
- City
- — inherits STATE
ZIP-level market 93277
- Rents YoY
- 3.3%
- Active inventory
- 239
- Price-to-rent
- 2.6×
Monthly cashflow live
- Estimated rent
- $1,541 high interval (Pro) →
- Mortgage (P&I)
- −$254
- Tax est. 1.5%
- −$61 /mo · $728/yr
- Insurance
- −$20
- HOA
- −$934
- Vacancy / Maint / Mgmt
- −$324
- Net cashflow
- $-52
Break-even live
Sensitivity live
| Price | -10% $-18 | -5% $-35 | +0% $-52 | +5% $-69 | +10% $-85 |
|---|---|---|---|---|---|
| Rent | -10% $-174 | -5% $-113 | +0% $-52 | +5% $9 | +10% $70 |
| Rate | -1.0pp $-27 | -0.5pp $-40 | base $-52 | +0.5pp $-64 | +1.0pp $-77 |
UW: 25.0% down · 7.5% · 30yr · 1.5% tax · 5.0% vac · 8.0% maint · 8.0% mgmt
Financing live
Cash to close
- Down payment
- $12,125
- Closing costs
- $1,455
- Reserves months
- —
- Total cash needed
- —
Loan-product check · same deal, 3 products live
Conventional
25% down · 7.5% · 30yr
- Down + closing
- —
- Monthly P&I
- —
- Monthly cashflow
- —
- DSCR
- —
- Eligible?
- —
Personal DTI + credit; lowest rate.
DSCR
20% down · 8.5% · 30yr
- Down + closing
- —
- Monthly P&I
- —
- Monthly cashflow
- —
- DSCR
- —
- Eligible?
- —
No personal income docs; deal must DSCR.
Hard money
10% down · 12.0% · 12mo
- Down + closing
- —
- Monthly P&I
- —
- Monthly cashflow
- —
- DSCR
- —
- Eligible?
- —
Short-term bridge; refi at stabilization.
Rent comps 22 comps
| Address | Beds | Baths | Sqft | Rent | $/sqft | DOM | Units | Dist |
|---|---|---|---|---|---|---|---|---|
| 5505 W Tulare Ave #64 Visalia, CA | 2.0 | 1.5 | 800 | $1,495 | $1.87 | 23d | 1 | 0.08mi |
| 4928 Westgate Ct Visalia, CA | 2.0 | 1.0 | 1069 | $2,200 | $2.06 | 23d | 1 | 0.34mi |
| 5224 W Cambridge Ave Unit 5224 Visalia, CA | 2.0 | 1.0 | 818 | $1,450 | $1.77 | 45d | 1 | 0.41mi |
| 5136 W Cambridge Ave Visalia, CA | 2.0 | 1.0 | 818 | $1,400 | $1.71 | 15d | 1 | 0.44mi |
| 5130 W Cambridge Ave Unit 5136 Visalia, CA | 2.0 | 1.0 | 818 | $1,400 | $1.71 | 15d | 1 | 0.44mi |
| 4845 W Cypress Ave Visalia, CA | 2.0 | 2.0 | 1027 | $1,650 | $1.61 | 45d | 1 | 0.45mi |
| 1540 S Linwood St Unit 1540 Visalia, CA | 2.0 | 1.0 | 750 | $1,350 | $1.80 | 45d | 1 | 0.69mi |
| 700 S Linwood St Unit 720 Visalia, CA | 2.0 | 1.0 | 1054 | $1,650 | $1.57 | 45d | 1 | 0.71mi |
| 4052 W Meadow Ave Visalia, CA | 2.0 | 1.0 | 877 | $1,340 | $1.53 | 23d | 1 | 0.97mi |
| 3900-4054 W Meadow Ave Unit 4052 Visalia, CA | 2.0 | 1.0 | 877 | $1,340 | $1.53 | 23d | 1 | 0.99mi |
| 3900-4054 W Meadow Ave Unit 3936 Visalia, CA | 2.0 | 1.0 | 877 | $1,365 | $1.56 | 45d | 1 | 0.99mi |
| 3936 W Meadow Ave Visalia, CA | 2.0 | 1.0 | 877 | $1,365 | $1.56 | 45d | 1 | 0.99mi |
| 3733 W Myrtle Ct Visalia, CA | 2.0 | 1.0 | 850 | $1,350 | $1.59 | 45d | 1 | 1.03mi |
| 815 S Demaree St Apt 40 Visalia, CA | 2.0 | 1.5 | 890 | $1,300 | $1.46 | 45d | 1 | 1.12mi |
| 815 S Demaree St Unit 33 Visalia, CA | 2.0 | 1.5 | 890 | $1,300 | $1.46 | 23d | 1 | 1.12mi |
| 815 S Demaree St Unit 11 Visalia, CA | 3.0 | 1.5 | 924 | $1,400 | $1.52 | 45d | 1 | 1.12mi |
| 3535 W Campus Ave Unit 11 Visalia, CA | 2.0 | 1.0 | 850 | $1,445 | $1.70 | 15d | 1 | 1.23mi |
| 3535 W Campus Ave Unit 3535-8 Visalia, CA | 2.0 | 1.0 | 850 | $1,445 | $1.70 | 45d | 1 | 1.23mi |
| 3537 W Campus Ave Unit 11 Visalia, CA | 2.0 | 1.0 | 850 | $1,445 | $1.70 | 45d | 1 | 1.23mi |
| 3417 W Campus Ave Visalia, CA | 2.0 | 2.0 | 1050 | $1,450 | $1.38 | 15d | 1 | 1.36mi |
| 4700 W Caldwell Ave Visalia, CA | 1.0–3.0 | 1.0–2.0 | 889 | $2,100 | $2.36 | 15d | 5 | 1.41mi |
| 4401 W Goshen Ave Visalia, CA | 2.0 | 2.0 | 996 | $1,695 | $1.70 | 15d | 2 | 1.50mi |
HOA detail
- Monthly dues
- $934 · $11,208/yr
- Likely covers
- pool
Listing history 19 events
-
2026-06-21days on market $48,500 Active 313 DOM
-
2026-06-18days on market $48,500 Active 310 DOM
-
2026-06-17days on market $48,500 Active 309 DOM
-
2026-06-16days on market $48,500 Active 308 DOM
-
2026-06-15days on market $48,500 Active 307 DOM
-
2026-06-14days on market $48,500 Active 305 DOM
-
2026-06-13days on market $48,500 Active 304 DOM
-
2026-06-10days on market $48,500 Active 302 DOM
-
2026-06-09days on market $48,500 Active 301 DOM
-
2026-06-08days on market $48,500 Active 300 DOM
-
2026-06-07days on market $48,500 Active 299 DOM
-
2026-06-05days on market $48,500 Active 296 DOM
-
2026-06-03days on market $48,500 Active 295 DOM
-
2026-06-02days on market $48,500 Active 294 DOM
-
2026-06-01days on market $48,500 Active 293 DOM
-
2026-05-31days on market $48,500 Active 292 DOM
-
2026-05-30days on market $48,500 Active 291 DOM
-
2026-02-09price $48,500 760-char remark
Show marketing remark (760 chars)
Located in Southwest Visalia, where new residential communities, expanded shopping, and improved roadways are adding even more convenience to the area, this 2 bedroom, 1 bath manufactured home blends comfort with accessibility. Inside, laminate flooring runs throughout, with ceiling fans in both bedrooms for year round comfort. The open kitchen overlooks the living room and offers abundant counter space, perfect for cooking or entertaining. The bathroom also serves as a laundry area for added functionality. Outside, enjoy a covered carport, covered porch, and a large storage shed. The well-maintained community features a pool, community center, and quick freeway access, putting you minutes from Visalia's growing mix of dining, retail, and recreation.
-
2025-08-12$53,500 Active 760-char remark
Show marketing remark (760 chars)
Located in Southwest Visalia, where new residential communities, expanded shopping, and improved roadways are adding even more convenience to the area, this 2 bedroom, 1 bath manufactured home blends comfort with accessibility. Inside, laminate flooring runs throughout, with ceiling fans in both bedrooms for year round comfort. The open kitchen overlooks the living room and offers abundant counter space, perfect for cooking or entertaining. The bathroom also serves as a laundry area for added functionality. Outside, enjoy a covered carport, covered porch, and a large storage shed. The well-maintained community features a pool, community center, and quick freeway access, putting you minutes from Visalia's growing mix of dining, retail, and recreation.
ⓘ Source: listings_history table (triggers on properties + properties_extension) + one-shot
backfill from property_details.listing_events for pre-trigger history.
Climate risk First Street
- Flood 1/10 Low FEMA zone X (shaded) · 0% chance over 30 yrs
- Wildfire 5/10 Major
- Heat 8/10 Severe 7 d/yr ≥105°F today · 17 d/yr by 30 yrs out
- Wind 1/10 Low
- Air quality 10/10 Extreme 37 unhealthy d/yr today · 39 by 30 yrs out
Nearby sold comps map
Loading sold comps map…
Walkable amenities ~0.75 mi
Loading nearby amenities…
Taxation est. · year 1
- Rental income
- $18,491
- − Mortgage interest
- −$2,717
- − Property taxes
- −$728
- − Insurance
- −$242
- − Repairs & maintenance
- −$1,479
- − Management
- −$1,479
- − HOA
- −$11,208
- − Depreciation
- −$1,411
- Taxable loss
- −$773
- Est. tax savings @ 24.0%
- +$186
- After-tax cash flow
- $-437/yr
For passive investors: Depreciation is non-cash, so a rental often shows a tax loss while cash-flowing — sheltering income. Rental losses are passive: they offset passive income freely, and up to $25,000/yr can offset ordinary (W-2) income if you actively participate and your MAGI is under $100k (phasing out to $0 by $150k); unused losses carry forward. On sale, claimed depreciation is recaptured at up to 25%, and gains may owe capital-gains tax (a 1031 exchange can defer both). Figures are a year-1 estimate at your 24.0% rate — not tax advice; consult a CPA.
Condition & rehab AI · 13 photos
This manufactured home requires moderate renovations to update the kitchen and bathroom, and improve the overall appearance. The home is located in a convenient area with new amenities, but its dated interior and lack of curb appeal currently limit its value.
Repairs flagged
- Major kitchen cabinets — dated and in poor condition
- Major kitchen countertops — dated and in poor condition
- Major kitchen flooring — dated and in poor condition
- Major kitchen appliances — dated and in poor condition
- Major bathroom vanity — dated and in poor condition
Value-add opportunities
- Resale update kitchen cabinets, countertops, flooring, appliances — modernizing the kitchen would significantly increase its appeal
- Resale update bathroom vanity — modernizing the bathroom would improve its functionality and appeal
- Both landscape and improve curb appeal — improved landscaping would enhance both resale and rental value
Renovation cost estimate screening
| Repair item | Severity | Est. cost |
|---|---|---|
| kitchen cabinets · dated and in poor condition | Major | $15,000–50,000 |
| kitchen countertops · dated and in poor condition | Major | $15,000–50,000 |
| kitchen flooring · dated and in poor condition | Major | $15,000–50,000 |
| kitchen appliances · dated and in poor condition | Major | $15,000–50,000 |
| bathroom vanity · dated and in poor condition | Major | $15,000–50,000 |
| Total estimated repair cost · 5 items | $75,000–250,000 |
Value-add ROI direction
- Resale update kitchen cabinets, countertops, flooring, appliances — modernizing the kitchen would significantly increase its appeal ↑
- Resale update bathroom vanity — modernizing the bathroom would improve its functionality and appeal ↑
- Both landscape and improve curb appeal — improved landscaping would enhance both resale and rental value ↑
ⓘ Cost ranges are severity-bucket heuristics (US national rule-of-thumb). Get contractor quotes + a written scope before underwriting a rehab budget.
Schools (NCES district)
- District
- Visalia Unified
- NCES district ID
- 0641160
- Math proficiency
- 30% ▼ -3.00%
- Reading proficiency
- 40% ▼ -10.00%
- Median HH income
- $51,672
- Composite
- 30.47/100
- National rank
- #6223
- State rank
- #273 of 517 in CA
Livability — Visalia
- Score
- 72/100
- State rank
- #196
- US rank
- #6351
Category grades
Schools grade is shown separately in the Schools card above.
Census & demographics
- Census place
- Visalia, CA
- County
- Tulare County · 323,826 people
- City population
- 163,333
- Metro
- Visalia, CA
- Population (ZIP)
- 53,985
- Household income
- $80,548
- Rent vs Own
- Severe rent burden
- 1896.0
Population outlook (Tulare County) Hauer SSP2
- Today (2025)
- 484,681 people
- By 2030
- 496,241 · +2.4%
- By 2040
- 518,507 · +7.0%
- By 2050
- 534,920 · +10.4%
- By 2075
- 548,417 · +13.2%
- By 2100
- 513,085 · +5.9%
Race, ethnicity, and origin ACS 2023
- Neighborhood character
- Diverse neighborhood (Simpson 0.60)
- Race & ethnicity
- Hispanic / Latino 48% White 40% Two or more races 21% Asian 4% Black 2% Native American 2%
- Hispanic origin (detail)
- Mexican 44%
- Common ancestry
- Russian 3% Iranian 2% Italian 2%
- Foreign-born
- 12% · Canada, China
- Languages at home
- 73% English-only · Spanish 22% Chinese 2% Other Asian/Pacific 1%
Political lean MEDSL · Tulare
- 2024 margin
- Strong R (+20.7) · D 38.5% · R 59.2% · Other 2.3%
- 2008→2024 swing
- -5.4pp toward R · 2008: -15.3pp · 2024: -20.7pp
- All cycles
- 2024: R+20.7 2020: R+7.8 2016: R+12.1 2012: R+17.8 2008: R+15.3
Not yet ingested
- Civics
- —
Market trends
- HPI YoY
- ▼ -371.43%
- Current HPI
- 310.349
- Rent YoY
- ▲ 3.32%
- Metro
- Visalia, CA
- State GDP YoY
- ▲ 3.21%
- F500 in state
- 116
Industry mix (Fortune 500 HQ in CA)
| Industry | F500 HQs | Revenue |
|---|---|---|
| Technology | 27 | $1,492B |
|
||
| Financial Services | 3 | $174B |
|
||
| Retail | 3 | $44B |
|
||
| Insurance | 3 | $26B |
|
||
| Media / Entertainment | 2 | $115B |
|
||
| Pharmaceuticals / Biotech | 2 | $62B |
|
||
Price history
-9.3% since first listed2 events — show timeline
- 2026-02-09 Price Changed $48,500 TCMLS
- 2025-08-12 Listed $53,500 TCMLS
Cash-flow waterfall
monthlySold comps — $/sqft
last 12 mo · ≤1 miLoading sold comps…