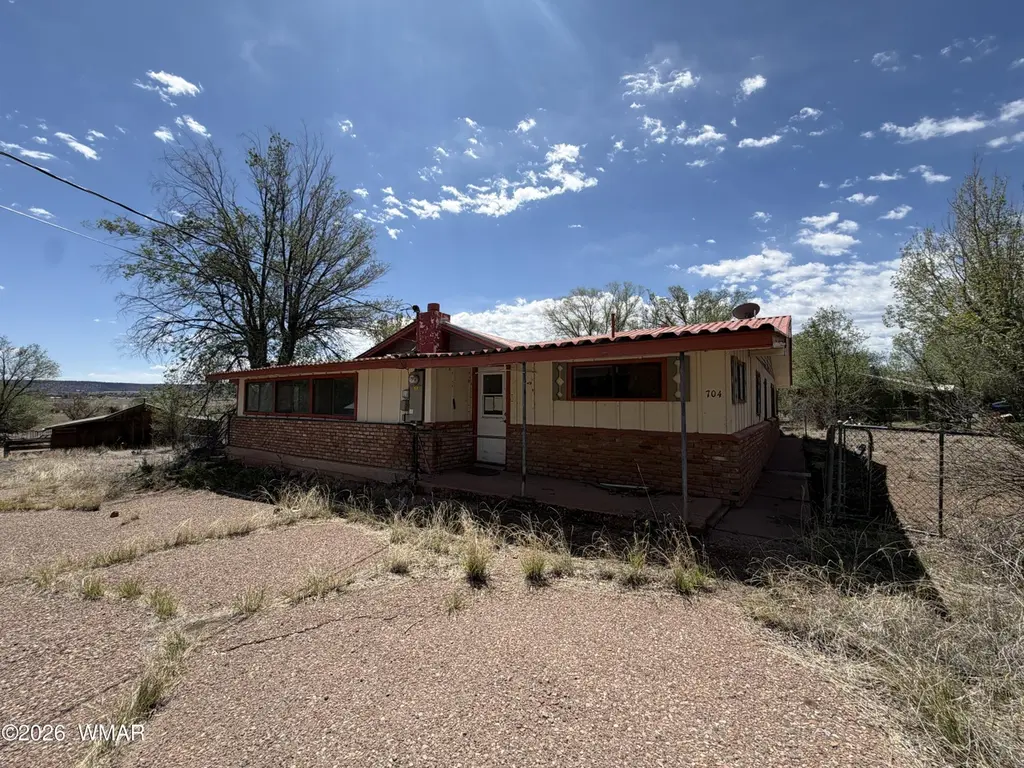
704 S Voigt St · Springerville, AZ
Flood risk 1/10 · Minimal
- FEMA flood zone
- D
- Chance of flooding over 30 yrs
- 0.0%
- Est. flood insurance / yr
- $544 – $1,084
Fire risk 6/10 · Moderate
- Est. fire insurance / yr
- $610 – $1,132
Heat risk 2/10 · Minimal
- Hot days now (above 86°F)
- 7 days/yr
- Hot days in 30 yrs
- 18 days/yr
Wind risk 1/10 · Minimal
- Chance of severe wind over 30 yrs
- —
Air-quality risk 6/10 · Moderate
- Unhealthy air days now
- 10 days/yr
- Unhealthy air days in 30 yrs
- 10 days/yr
Risk factors via First Street. Map © Google.
Why this score? — see what drove the C+ grade
The composite is a weighted blend of 9 inputs, each scored 0–100. Each bar is that input's sub-score; the figure is the points it added to the 100-point composite (weight × sub-score).
- Cash flow +25.2/30.0
- DSCR +8.3/10.0
- Appreciation +7.7/10.0
- ARV discount +7.5/15.0
- 1% rule +5.5/10.0
- Livability +3.1/5.0
- Schools +2.7/10.0
- Rent growth +2.5/5.0
- Condition / age +2.5/5.0
$125,000
🖨 Deal sheet (PDF) 📄 Offer letter ✓ Due diligence
Listing remarks MLS
This home is a great opportunity to own your own home for less than rent. This home is ready for you. Bring the toys and pets. Seller must comply with HUD guidelines 24 CFR 206.125
Key facts
- Barn
- Dead end road
- Mature trees
Tags
Property features AI
Finance
- Other: Approximately 0.97 acre lot; Not lease land; Subdivision: Springerville Townsite; Directions: Turn South on Pima, left on Maricopa, right on Voigt
- HOA & community: No HOA
Exterior
- Parking: Detached 2-car garage; Has garage
- Utilities: Septic tank; Water available; Power available; Individual-metered electric; Propane available; Bottled gas available; Navopache service
- Home design: Site-built home; One level
- Construction: Wood frame construction; Stemwall foundation; Metal pitched roof
- Exterior features: Barn/Stable; Panoramic views; Partly fenced; Mostly private property; City-maintained road access; Trees on the property
Interior
- Kitchen: Electric range; Refrigerator; Breakfast bar; Eat-in kitchen
- Flooring: Vinyl flooring; Wood flooring
- Bathrooms: Full bathroom with shower and tub/shower
- Heating & cooling: Electric heating; ETS; Bottled gas; Wood heating
- Interior features: Fireplace in the living room; Mud room
- Laundry & utility: Utility room
Neighborhood map
What this means for you Summary
Snapshot
- This is a 3-bed/2.0-bath single-family listed at $125k.
Deal economics
- At list price, monthly cash flow is $279 ($3k/yr) — positive.
- The deal already cash-flows at list — no discount required.
- Meets the 1% rule at list price ($1k rent vs $125k).
- Recommended offer: $123k (1.5% below list) — sets the bar for market timing.
Location & tenants
- Location reads 62/100 on livability (#143 in AZ) — a middle-class / working-renter tenant base. Strengths: cost of living A+, crime A-, housing B+; Watch: employment C-, schools F, amenities F.
- Round Valley Unified District (4155) (town): math 29% / reading 33% proficiency, ranked #105 of 249 in AZ (top 42%) — families likely to look elsewhere, expect single-tenant / working-renter base with shorter leases.
- Market conditions: 32 active listings in the ZIP; 99 units permitted in Apache County in 2024 (0 in 5+ unit buildings).
Forward outlook
- In year one you build about $8k of equity ($864 loan paydown + $7k appreciation (5.4% local appreciation)).
- Apache County population projected at -12% by 2050 — secular population decline; favor cash flow + early exit over multi-decade hold.
- At projected returns (5.4% appreciation + 3.0% rent growth), your $35k cash investment doubles in ~3 years — after that, you're playing with house money.
- By year 5, paydown + projected appreciation supports a ~$33k cash-out refi (75% LTV) — recoverable capital for the next deal without selling this one.
Negotiation context
- It's been on market 15 days — a 2% lower offer ($123k) is reasonable based on typical stale-listing flexibility.
- Current owner paid $80k; list at $125k implies a 57% gain — meaningful room to come down on a strong offer.
Risks & watch-outs
- Watch-outs: built in 1947 — expect roof / HVAC / electrical / plumbing capex.
- Climate carrying-cost: major wildfire risk — expect insurance premiums to compound above CPI over the hold.
Questions for the listing agent
- Built in 1947 — when were the roof, HVAC, electrical panel, plumbing, and water heater last replaced?
- Is there a deadline driving the sale (1031 exchange, divorce, estate, relocation)? That informs how much negotiation room exists.
- Schools are F-rated, which usually means shorter tenancies and higher turnover. Who's the typical renter profile here, and what's been the actual vacancy rate?
- What's the average days-on-market for RENTAL listings here right now (not sales)? A rising rental-DOM trend means longer vacancies and softer asking-rent achievability than the comps imply.
- What's the recent tenant-quality profile in this submarket — average credit score on applications, eviction rate, late-payment / NSF rate, and stable-employment percentage? A property-management company in the area should have these aggregated.
- How much new for-sale + rental construction is in the pipeline within 1–3 miles? Heavy new supply typically softens prices + rents 12–24 months out; constrained supply supports both.
Investment metrics
- 1% rule
- 1.05% ✓
- Cap rate
- 8.97%
- Cash-on-cash
- 9.56%
- DSCR
- 1.43
- GRM
- 7.9
CMA / ARV
- ARV (on-the-fly)
- $312,312
- Comps found
- 7
Show comp detail 7 sales within ~0.75 mi
| Address | Dist | Beds/Ba | Sqft | Sold | Price | $/sf | Match |
|---|---|---|---|---|---|---|---|
| 756 S Voigt St | 0.09mi | 3/2.0 | 1,653 (-4%) | 20mo | $170,000 | $103 | 72 |
| 734 E Mason Dr | 0.45mi | 3/2.0 | 1,620 (-6%) | 6mo | $199,999 | $123 | 64 |
| 341 Udall St | 0.53mi | 3/2.0 | 1,607 (-6%) | 15mo | $294,500 | $183 | 52 |
| 312 Udall St | 0.58mi | 3/2.5 | 1,800 (+5%) | 14mo | $349,000 | $194 | 51 |
| 235 E 5th Ave | 0.64mi | 3/2.0 | 1,516 (-12%) | 14mo | $375,000 | $247 | 39 |
| 367 N Garth Dr | 0.74mi | 4/2.0 (+1) | 1,886 (+10%) | 6mo | $342,500 | $182 | 38 |
| 312 N Renee St | 0.67mi | 4/2.0 (+1) | 1,843 (+7%) | 16mo | $315,000 | $171 | 38 |
Match score weights: distance 35% · size 25% · config 20% · recency 20%. Top-matched comps best support the ARV.
Projected returns pro-forma
5.38% appreciation · 3.0% rent growth · sell at horizon
- IRR
- 21.9%
- Equity multiple
- 2.41×
- Total profit
- $49,268
- Equity at exit
- $73,742
- IRR
- 21.2%
- Equity multiple
- 4.78×
- Total profit
- $132,298
- Equity at exit
- $129,740
Cash invested: $35,000 (down + closing). Projections, not guarantees.
Landlord ↔ Tenant lean methodology
- Overall (STATE)
- 87 Strongly Landlord-Friendly
- State Arizona
- 87 Strongly Landlord-Friendly · R+3
- County
- — inherits STATE
- City
- — inherits STATE
ZIP-level market 85938
- Home prices YoY
- 2.7%
- Active inventory
- 32
- Price-to-rent
- 7.9×
Monthly cashflow live
- Estimated rent
- $1,317 medium interval (Pro) →
- Mortgage (P&I)
- −$656
- Tax from tax record
- −$54 /mo · $649/yr
- Insurance
- −$52
- HOA
- −$0
- Vacancy / Maint / Mgmt
- −$277
- Net cashflow
- $279
Break-even live
Sensitivity live
| Price | -10% $350 | -5% $314 | +0% $279 | +5% $244 | +10% $208 |
|---|---|---|---|---|---|
| Rent | -10% $175 | -5% $227 | +0% $279 | +5% $331 | +10% $383 |
| Rate | -1.0pp $342 | -0.5pp $311 | base $279 | +0.5pp $247 | +1.0pp $214 |
UW: 25.0% down · 7.5% · 30yr · 1.5% tax · 5.0% vac · 8.0% maint · 8.0% mgmt
Financing live
Cash to close
- Down payment
- $31,250
- Closing costs
- $3,750
- Reserves months
- —
- Total cash needed
- —
Loan-product check · same deal, 3 products live
Conventional
25% down · 7.5% · 30yr
- Down + closing
- —
- Monthly P&I
- —
- Monthly cashflow
- —
- DSCR
- —
- Eligible?
- —
Personal DTI + credit; lowest rate.
DSCR
20% down · 8.5% · 30yr
- Down + closing
- —
- Monthly P&I
- —
- Monthly cashflow
- —
- DSCR
- —
- Eligible?
- —
No personal income docs; deal must DSCR.
Hard money
10% down · 12.0% · 12mo
- Down + closing
- —
- Monthly P&I
- —
- Monthly cashflow
- —
- DSCR
- —
- Eligible?
- —
Short-term bridge; refi at stabilization.
Listing history 12 events
-
2026-06-19days on market $125,000 Active 15 DOM
-
2026-06-18days on market $125,000 Active 14 DOM
-
2026-06-17days on market $125,000 Active 13 DOM
-
2026-06-16days on market $125,000 Active 12 DOM
-
2026-06-15days on market $125,000 Active 11 DOM
-
2026-06-14days on market $125,000 Active 9 DOM
-
2026-06-12days on market $125,000 Active 8 DOM
-
2026-06-09days on market $125,000 Active 5 DOM
-
2026-06-08days on market $125,000 Active 4 DOM
-
2026-06-07days on market $125,000 Active 3 DOM
-
2026-06-07remarks 189-char remark
-
2026-06-07$125,000 Active 2 DOM
ⓘ Source: listings_history table (triggers on properties + properties_extension) + one-shot
backfill from property_details.listing_events for pre-trigger history.
Tax reassessment forecast AZ · Resets to sale price
- Current annual tax
- $649 · $54/mo
- Projected year-2 tax
- $825 · $69/mo
- Expected delta
- +$176/yr (+$15/mo · 27.1%)
ⓘ Screening estimate from a state-policy table — verify with the county assessor before closing.
Climate risk First Street
- Flood 1/10 Low FEMA zone D · 0% chance over 30 yrs
- Wildfire 6/10 Major
- Heat 2/10 Low 7 d/yr ≥86°F today · 18 d/yr by 30 yrs out
- Wind 1/10 Low
- Air quality 6/10 Major 10 unhealthy d/yr today · 10 by 30 yrs out
Nearby sold comps map
Loading sold comps map…
Walkable amenities ~0.75 mi
Loading nearby amenities…
Taxation est. · year 1
- Rental income
- $15,808
- − Mortgage interest
- −$7,002
- − Property taxes
- −$649
- − Insurance
- −$625
- − Repairs & maintenance
- −$1,265
- − Management
- −$1,265
- − Depreciation
- −$3,636
- Taxable income
- $1,366
- Est. tax owed @ 24.0%
- −$328
- After-tax cash flow
- $3,020/yr
For passive investors: Depreciation is non-cash, so a rental often shows a tax loss while cash-flowing — sheltering income. Rental losses are passive: they offset passive income freely, and up to $25,000/yr can offset ordinary (W-2) income if you actively participate and your MAGI is under $100k (phasing out to $0 by $150k); unused losses carry forward. On sale, claimed depreciation is recaptured at up to 25%, and gains may owe capital-gains tax (a 1031 exchange can defer both). Figures are a year-1 estimate at your 24.0% rate — not tax advice; consult a CPA.
Schools (NCES district)
- District
- Round Valley Unified District (4155)
- NCES district ID
- 0407130
- Math proficiency
- 29% ▼ -13.00%
- Reading proficiency
- 33% ▼ -14.00%
- Median HH income
- $47,656
- Composite
- 26.8/100
- National rank
- #7117
- State rank
- #105 of 249 in AZ
Livability — Springerville
- Score
- 62/100
- State rank
- #143
- US rank
- #17057
Category grades
Schools grade is shown separately in the Schools card above.
Census & demographics
- Census place
- Springerville, AZ
- Population (ZIP)
- 2,079
Population outlook (Apache County) Hauer SSP2
- Today (2025)
- 70,338 people
- By 2030
- 69,279 · -1.5%
- By 2040
- 66,449 · -5.5%
- By 2050
- 61,904 · -12.0%
- By 2075
- 47,639 · -32.3%
- By 2100
- 30,279 · -57.0%
Race, ethnicity, and origin ACS 2023
- Neighborhood character
- Predominantly White (71%)
- Race & ethnicity
- White 71% Hispanic / Latino 25% Two or more races 14% Native American 3%
- Hispanic origin (detail)
- Mexican 16% Puerto Rican 2%
- Common ancestry
- Slovak 6% Lithuanian 5% Serbian 3%
- Foreign-born
- 2% · Canada
- Languages at home
- 86% English-only · Spanish 11% German/W. Germanic 3%
Political lean MEDSL · Apache
- 2024 margin
- D (+19.0) · D 58.9% · R 40.0% · Other 1.1%
- 2008→2024 swing
- -9.2pp toward R · 2008: 28.2pp · 2024: 19.0pp
- All cycles
- 2024: D+19.0 2020: D+33.7 2016: D+36.9 2012: D+33.9 2008: D+28.2
Not yet ingested
- Civics
- —
Market trends
- HPI YoY
- ▲ 5.38%
- Current HPI
- 201.7782
- Rent YoY
- —
- Metro
- —
- State GDP YoY
- ▲ 4.54%
- F500 in state
- 20
Industry mix (Fortune 500 HQ in AZ)
| Industry | F500 HQs | Revenue |
|---|---|---|
| Technology | 2 | $13B |
|
||
| Mining / Metals | 1 | $23B |
|
||
| Environmental Services | 1 | $16B |
|
||
| Metals / Steel | 1 | $14B |
|
||
| Technology Distribution | 1 | $9B |
|
||
| Homebuilding | 1 | $8B |
|
||
Price history
+56.6% since first listed2 events — show timeline
- 2026-06-04 Listed $125,000 WMMLS
- 2021-09-13 Sold (MLS) $79,800 WMMLS
Property tax history
+8.9%/yrLatest (2025): $649 · +6.4% YoY. Source: county tax records.
Cash-flow waterfall
monthlySold comps — $/sqft
last 12 mo · ≤1 miLoading sold comps…