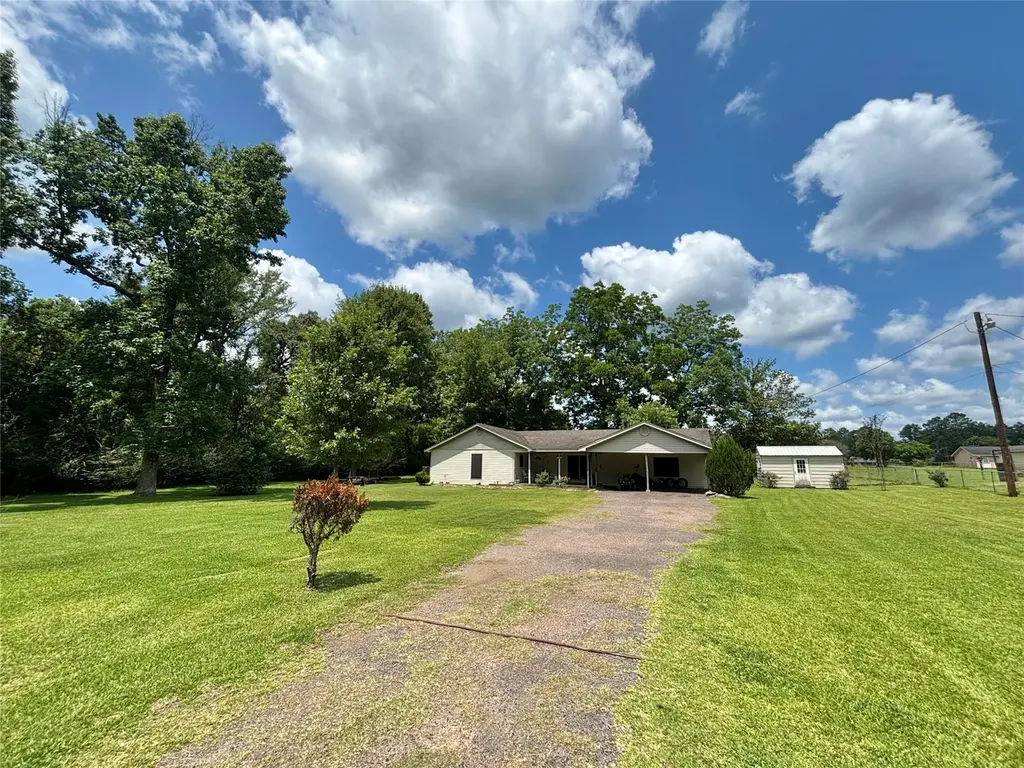
9434 Us Highway 69 S · Warren, TX
Flood risk 1/10 · Minimal
- FEMA flood zone
- X (unshaded)
- Chance of flooding over 30 yrs
- 0.0%
- Est. flood insurance / yr
- $507 – $1,088
Fire risk 4/10 · Minor
- Est. fire insurance / yr
- $1,222 – $2,270
Heat risk 9/10 · Severe
- Hot days now (above 112°F)
- 7 days/yr
- Hot days in 30 yrs
- 24 days/yr
Wind risk 8/10 · Major
- Chance of severe wind over 30 yrs
- 99.0%
Air-quality risk 1/10 · Minimal
- Unhealthy air days now
- 0 days/yr
- Unhealthy air days in 30 yrs
- 0 days/yr
Risk factors via First Street. Map © Google.
Why this score? — see what drove the D grade
The composite is a weighted blend of 9 inputs, each scored 0–100. Each bar is that input's sub-score; the figure is the points it added to the 100-point composite (weight × sub-score).
- Cash flow +8.6/30.0
- Appreciation +7.8/10.0
- ARV discount +7.5/15.0
- Schools +3.5/10.0
- Livability +3.0/5.0
- 1% rule +2.9/10.0
- Rent growth +2.5/5.0
- Condition / age +2.5/5.0
- DSCR +2.3/10.0
$159,000
🖨 Deal sheet 📄 Offer letter ✓ Due diligence
Listing remarks
Enjoy the perfect blend of convenience and country living on this 1.51 acre unrestricted property located outside the city limits. This spacious 1,928 sq. ft. home offers 3 bedrooms, 2 bathrooms and an open-concept living/kitchen/dining area designed for comfortable everyday living. A large utility room features abundant counter space and built-in shelving for exceptional storage and organization, while the oversized office/flex space provides endless possibilities for working from home, hobbies or a playroom. Relax on the covered front and back porches overlooking the beautiful property. Outside you'll find a 2-car attached carport, three outbuildings and a generously sized fenced backyard
Key facts
- Three outbuildings
- Fenced backyard
- Large utility room
Tags
Property features AI
Finance
- Other: Lease not considered
Exterior
- Parking: Attached carport; Covered carport with 2 spaces; Circular driveway
- Utilities: Public water; Septic sewer
- Home design: Residential property; Single-story (first level living)
- Construction: Vinyl siding; Composition roof; Slab foundation; Built in 1984
- Exterior features: Covered patio; Patio; Porch; Deck; Storage; Shed(s); Back yard fence; Cleared and wooded lot; Asphalt road access
Interior
- Kitchen: Kitchen (First level) — 14x8
- Bedrooms: Primary bedroom (First level) — 15x14; Bedroom (First level) — 12x12; Bedroom (First level) — 11x11
- Bathrooms: 2 full bathrooms; Primary bathroom (First level) — 7x6; Bathroom (First level) — 8x7
- Heating & cooling: Central heating (Electric); Central air conditioning (Electric)
- Interior features: 10 total rooms; Utility room; Office; Dining room; Living room
- Laundry & utility: Utility room (First level) — 19x10
Neighborhood map
What this means for you Summary
Snapshot
- This is a 3-bed/2.0-bath single-family listed at $159k.
Deal economics
- At list price, monthly cash flow is $-138 ($-2k/yr) — negative.
- To cash-flow at today's rent, offer at most $135k (15.3% below list).
- To meet the 1% rule (rent ≥ 1% of price), the offer needs to be $126k (20.5% below list).
- Recommended offer: $126k (20.5% below list) — sets the bar for 1% rule.
Location & tenants
- Location reads 59/100 on livability (#1,168 in TX) — a working-class tenant base; expect higher turnover. Strengths: cost of living A+, housing A+; Watch: employment C-, crime F, amenities F.
- Warren ISD (rural): math 37% / reading 45% proficiency, ranked #378 of 826 in TX (top 46%) — families likely to look elsewhere, expect single-tenant / working-renter base with shorter leases.
- Zoned schools: Warren H S (math 42% / reading 62%, grade D+, #447 of 1,632 statewide, top 29%, 373 students, 51% FRL) — zoned schools at 51% FRL track the district average.
- Market conditions: 61 active listings in the ZIP; 5 units permitted in Tyler County in 2024 (0 in 5+ unit buildings).
Forward outlook
- In year one you build about $10k of equity ($1k loan paydown + $9k appreciation (5.6% local appreciation)).
- Tyler County population projected at -12% by 2050 — secular population decline; favor cash flow + early exit over multi-decade hold.
- By year 4, paydown + projected appreciation supports a ~$34k cash-out refi (75% LTV) — recoverable capital for the next deal without selling this one.
Negotiation context
- It's been on market 20 days — a 2% lower offer ($157k) is reasonable based on typical stale-listing flexibility.
Risks & watch-outs
- Climate carrying-cost: severe wind risk, 99% chance of damaging wind over 30y; extreme-heat days projected 7→24/yr by 2055 (HVAC capex compounding) — expect insurance premiums to compound above CPI over the hold.
Questions for the listing agent
- What do current leases actually rent for vs. the listed asking? Can we see a recent rent roll and the last 12 months of T-12 income?
- Is there a deadline driving the sale (1031 exchange, divorce, estate, relocation)? That informs how much negotiation room exists.
- Crime grade is F in this area — have there been break-ins, vandalism, or insurance claims at this property in the last 3 years? What carrier currently insures it and at what premium?
- The area grade is low — what's the realistic commute time and amenity access for the typical tenant pool here? Any planned neighborhood developments (good or bad) we should know about?
- What's the average days-on-market for RENTAL listings here right now (not sales)? A rising rental-DOM trend means longer vacancies and softer asking-rent achievability than the comps imply.
- What's the recent tenant-quality profile in this submarket — average credit score on applications, eviction rate, late-payment / NSF rate, and stable-employment percentage? A property-management company in the area should have these aggregated.
- How much new for-sale + rental construction is in the pipeline within 1–3 miles? Heavy new supply typically softens prices + rents 12–24 months out; constrained supply supports both.
Investment metrics
- 1% rule
- 0.79% ✗
- Cap rate
- 5.25%
- Cash-on-cash
- -3.72%
- DSCR
- 0.83
- GRM
- 10.5
CMA / ARV
No comps found within radius.
Projected returns pro-forma
5.6% appreciation · 3.0% rent growth · sell at horizon
- IRR
- 11.3%
- Equity multiple
- 1.75×
- Total profit
- $33,430
- Equity at exit
- $95,977
- IRR
- 12.4%
- Equity multiple
- 3.39×
- Total profit
- $106,370
- Equity at exit
- $170,716
Cash invested: $44,520 (down + closing). Projections, not guarantees.
Landlord ↔ Tenant lean methodology
- Overall (STATE)
- 87 Strongly Landlord-Friendly
- State Texas
- 87 Strongly Landlord-Friendly · R+5
- County
- — inherits STATE
- City
- — inherits STATE
ZIP-level market 77664
- Home prices YoY
- 3.0%
- Active inventory
- 61
- Price-to-rent
- 10.5×
Monthly cashflow live
- Estimated rent
- $1,264 medium interval (Pro) →
- Mortgage (P&I)
- −$834
- Tax from tax record
- −$236 /mo · $2,832/yr
- Insurance
- −$66
- HOA
- −$0
- Vacancy / Maint / Mgmt
- −$265
- Net cashflow
- $-138
Break-even live
UW: 25.0% down · 7.5% · 30yr · 1.5% tax · 5.0% vac · 8.0% maint · 8.0% mgmt
Financing live
Cash to close
- Down payment
- $39,750
- Closing costs
- $4,770
- Reserves months
- —
- Total cash needed
- —
Loan-product check · same deal, 3 products live
Conventional
25% down · 7.5% · 30yr
- Down + closing
- —
- Monthly P&I
- —
- Monthly cashflow
- —
- DSCR
- —
- Eligible?
- —
Personal DTI + credit; lowest rate.
DSCR
20% down · 8.5% · 30yr
- Down + closing
- —
- Monthly P&I
- —
- Monthly cashflow
- —
- DSCR
- —
- Eligible?
- —
No personal income docs; deal must DSCR.
Hard money
10% down · 12.0% · 12mo
- Down + closing
- —
- Monthly P&I
- —
- Monthly cashflow
- —
- DSCR
- —
- Eligible?
- —
Short-term bridge; refi at stabilization.
Listing history 17 events
-
2026-06-18days on market $159,000 Active 20 DOM
-
2026-06-17days on market $159,000 Active 19 DOM
-
2026-06-16days on market $159,000 Active 18 DOM
-
2026-06-15days on market $159,000 Active 17 DOM
-
2026-06-14days on market $159,000 Active 15 DOM
-
2026-06-13days on market $159,000 Active 14 DOM
-
2026-06-10days on market $159,000 Active 12 DOM
-
2026-06-09days on market $159,000 Active 11 DOM
-
2026-06-08days on market $159,000 Active 10 DOM
-
2026-06-07days on market $159,000 Active 9 DOM
-
2026-06-05days on market $159,000 Active 6 DOM
-
2026-06-03days on market $159,000 Active 5 DOM
-
2026-06-02days on market $159,000 Active 4 DOM
-
2026-06-01days on market $159,000 Active 3 DOM
-
2026-05-31days on market $159,000 Active 2 DOM
-
2026-05-31remarks 699-char remark
-
2026-05-31$159,000 Active 1 DOM
ⓘ Source: listings_history table (triggers on properties + properties_extension) + one-shot
backfill from property_details.listing_events for pre-trigger history.
Tax reassessment forecast TX · Resets to sale price
- Current annual tax
- $2,832 · $236/mo
- Projected year-2 tax
- $2,910 · $242/mo
- Expected delta
- +$78/yr (+$6/mo · 2.7%)
ⓘ Screening estimate from a state-policy table — verify with the county assessor before closing.
Climate risk First Street
- Flood 1/10 Low FEMA zone X (unshaded) · 0% chance over 30 yrs
- Wildfire 4/10 Moderate
- Heat 9/10 Extreme 7 d/yr ≥112°F today · 24 d/yr by 30 yrs out
- Wind 8/10 Severe 99% chance of damaging wind over 30 yrs
- Air quality 1/10 Low 0 unhealthy d/yr today · 0 by 30 yrs out
Nearby sold comps map
Loading sold comps map…
Walkable amenities ~0.75 mi
Loading nearby amenities…
Taxation est. · year 1
- Rental income
- $15,162
- − Mortgage interest
- −$8,906
- − Property taxes
- −$2,832
- − Insurance
- −$795
- − Repairs & maintenance
- −$1,213
- − Management
- −$1,213
- − Depreciation
- −$4,625
- Taxable loss
- −$4,422
- Est. tax savings @ 24.0%
- +$1,061
- After-tax cash flow
- $-593/yr
For passive investors: Depreciation is non-cash, so a rental often shows a tax loss while cash-flowing — sheltering income. Rental losses are passive: they offset passive income freely, and up to $25,000/yr can offset ordinary (W-2) income if you actively participate and your MAGI is under $100k (phasing out to $0 by $150k); unused losses carry forward. On sale, claimed depreciation is recaptured at up to 25%, and gains may owe capital-gains tax (a 1031 exchange can defer both). Figures are a year-1 estimate at your 24.0% rate — not tax advice; consult a CPA.
Schools (NCES district)
- District
- Warren ISD
- NCES district ID
- 4844580
- Math proficiency
- 37% ▼ -7.00%
- Reading proficiency
- 45% ▲ 2.00%
- Median HH income
- $46,575
- Composite
- 34.97/100
- National rank
- #5059
- State rank
- #378 of 826 in TX
Livability — Warren
- Score
- 59/100
- State rank
- #1168
- US rank
- #20452
Category grades
Schools grade is shown separately in the Schools card above.
Census & demographics
- Population (ZIP)
- 2,590
Population outlook (Tyler County) Hauer SSP2
- Today (2025)
- 20,375 people
- By 2030
- 20,036 · -1.7%
- By 2040
- 19,150 · -6.0%
- By 2050
- 18,017 · -11.6%
- By 2075
- 15,300 · -24.9%
- By 2100
- 11,702 · -42.6%
Race, ethnicity, and origin ACS 2023
- Neighborhood character
- Predominantly White (81%)
- Race & ethnicity
- White 81% Two or more races 11% Black 5% Hispanic / Latino 4%
- Common ancestry
- Lithuanian 6% Italian 4% Serbian 1%
- Foreign-born
- 0% · Canada
- Languages at home
- 98% English-only · Spanish 2%
Political lean MEDSL · Tyler
- 2024 margin
- Solid R (+73.5) · D 13.0% · R 86.5%
- 2008→2024 swing
- -29.5pp toward R · 2008: -44.0pp · 2024: -73.5pp
- All cycles
- 2024: R+73.5 2020: R+70.3 2016: R+67.2 2012: R+55.5 2008: R+44.0
Not yet ingested
- Civics
- —
Market trends
- HPI YoY
- ▲ 5.60%
- Current HPI
- 194.6701
- Rent YoY
- —
- Metro
- —
- State GDP YoY
- ▲ 3.95%
- F500 in state
- 110
Industry mix (Fortune 500 HQ in TX)
| Industry | F500 HQs | Revenue |
|---|---|---|
| Energy | 16 | $1,198B |
|
||
| Technology | 5 | $198B |
|
||
| Engineering / Construction | 4 | $72B |
|
||
| Energy Services | 3 | $60B |
|
||
| Utilities | 3 | $41B |
|
||
| Healthcare | 2 | $330B |
|
||
Price history
3 events — show timeline
- 2026-05-29 Listed $159,000 HARMLS
- 2016-03-09 Sold (Public Records) — Public Records
- 2006-05-22 Sold (Public Records) — Public Records
Property tax history
+7.0%/yrLatest (2025): $2,832 · +8.8% YoY. Source: county tax records.
Cash-flow waterfall
monthlySold comps — $/sqft
last 12 mo · ≤1 miLoading sold comps…