2205 Paul Gaudet St · Paulina, LA
Flood risk 1/10 · Minimal
- FEMA flood zone
- X (shaded)
- Chance of flooding over 30 yrs
- 0.0%
- Est. flood insurance / yr
- $507 – $1,088
Fire risk 1/10 · Minimal
- Est. fire insurance / yr
- $1,269 – $2,357
Heat risk 8/10 · Major
- Hot days now (above 108°F)
- 7 days/yr
- Hot days in 30 yrs
- 21 days/yr
Wind risk 9/10 · Severe
- Chance of severe wind over 30 yrs
- 99.0%
Air-quality risk 2/10 · Minimal
- Unhealthy air days now
- 1 days/yr
- Unhealthy air days in 30 yrs
- 1 days/yr
Risk factors via First Street. Map © Google.
Why this score? — see what drove the B grade
The composite is a weighted blend of 9 inputs, each scored 0–100. Each bar is that input's sub-score; the figure is the points it added to the 100-point composite (weight × sub-score).
- Cash flow +27.4/30.0
- ARV discount +15.0/15.0
- DSCR +9.6/10.0
- 1% rule +7.4/10.0
- Livability +3.5/5.0
- Schools +3.1/10.0
- Rent growth +2.5/5.0
- Condition / age +2.2/5.0
- Appreciation +0.0/10.0
$85,000
🖨 Deal sheet 📄 Offer letter ✓ Due diligence
Listing remarks MLS
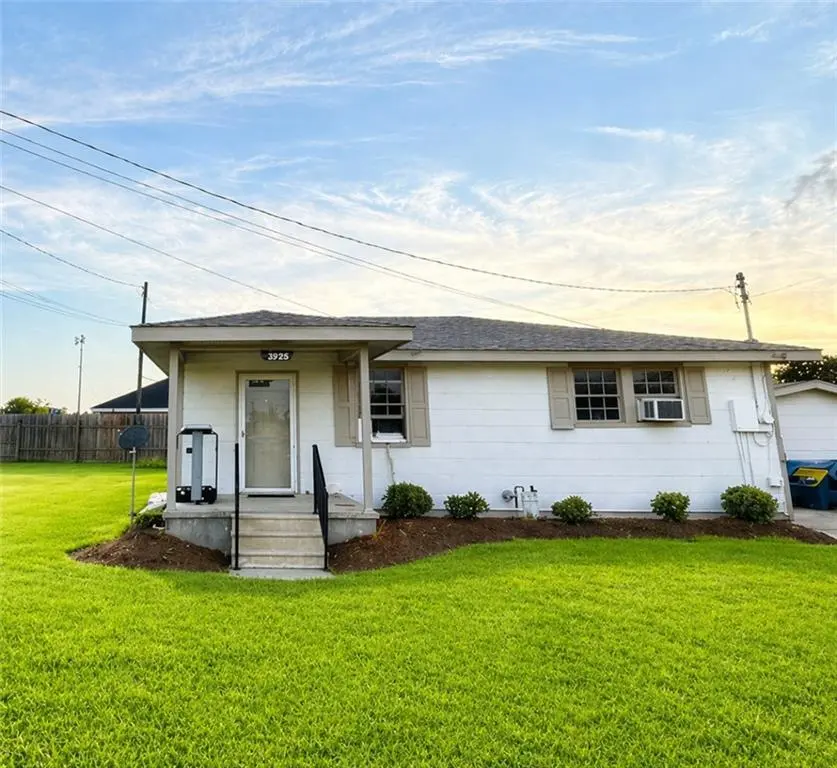
Cozy 2-bedroom, 1-bath home suited for investors seeking solid rental potential. Features a practical layout with a comfortable living area and a functional kitchen. Bedrooms offer useful space for tenants, and the single bath is straightforward and easy to maintain. Property sits on a manageable lot with room for minor updates to boost value. Reliable location for rental demand and a clean entry point for long-term hold or light renovation strategy. Living room is currently being used as a third bedroom. Sellers to make NO repairs. Property is currently being rented.
Key facts
- Parking
- Built 1987
- Listed 154 days
Neighborhood map
What this means for you Summary
Snapshot
- This is a 2-bed/1.0-bath single-family listed at $85k. Condition is rated fair.
Deal economics
- At list price, monthly cash flow is $248 ($3k/yr) — positive.
- The deal already cash-flows at list — no discount required.
- Meets the 1% rule at list price ($1k rent vs $85k).
- Recommended offer: $75k (12.0% below list) — sets the bar for market timing.
Location & tenants
- Location reads 69/100 on livability (#71 in LA) — a middle-class / working-renter tenant base. Strengths: crime A+, employment A+, housing A+; Watch: amenities F, commute F, cost of living D-.
- St. James Parish (town): math 31% / reading 41% proficiency, ranked #30 of 98 in LA (top 31%) — families likely to look elsewhere, expect single-tenant / working-renter base with shorter leases; 67% free/reduced lunch — lower-income household profile, screen leases tightly.
- Market conditions: 15 active listings in the ZIP; 64 units permitted in St. James Parish in 2024 (0 in 5+ unit buildings).
Forward outlook
- Local home prices are declining (-3.0%/yr); year-one equity from $588 of loan paydown is wiped out by about $3k of value loss. Plan a longer hold.
- St. James County population projected at -20% by 2050 — secular population decline; favor cash flow + early exit over multi-decade hold.
- At projected returns (-3.0% appreciation + 3.0% rent growth), your $24k cash investment doubles in ~10 years — after that, you're playing with house money.
Negotiation context
- It's been on market 155 days — a 12% lower offer ($75k) is reasonable based on typical stale-listing flexibility.
- 3 sale attempts with the ask held roughly flat each time — persistent listings suggest the price (not the market) is what's stuck; bring a comps-based counter.
Risks & watch-outs
- Climate carrying-cost: severe wind risk, 99% chance of damaging wind over 30y; extreme-heat days projected 7→21/yr by 2055 (HVAC capex compounding) — expect insurance premiums to compound above CPI over the hold.
Questions for the listing agent
- It's been on market 155 days. Have you received any prior offers? Is the seller open to a 12% concession, seller financing, or rate buy-down credit?
- Have any recent inspections been done? Can we get a copy of the seller's disclosures and any deferred-maintenance estimates?
- Why hasn't it sold? Are there any deal-killer items the seller is aware of (foundation, flood, title, zoning, code violations)?
- Is there a deadline driving the sale (1031 exchange, divorce, estate, relocation)? That informs how much negotiation room exists.
- Schools are B-rated — typically a magnet for longer-tenancy family renters. What's the average tenant stay here, and is there a school-zone premium baked into asking?
- What's the average days-on-market for RENTAL listings here right now (not sales)? A rising rental-DOM trend means longer vacancies and softer asking-rent achievability than the comps imply.
- What's the recent tenant-quality profile in this submarket — average credit score on applications, eviction rate, late-payment / NSF rate, and stable-employment percentage? A property-management company in the area should have these aggregated.
- How much new for-sale + rental construction is in the pipeline within 1–3 miles? Heavy new supply typically softens prices + rents 12–24 months out; constrained supply supports both.
Investment metrics
- 1% rule
- 1.24% ✓
- Cap rate
- 9.80%
- Cash-on-cash
- 12.51%
- DSCR
- 1.56
- GRM
- 6.7
CMA / ARV
- ARV (median comp)
- $149,036
- List price
- $85,000
- Delta
- -42.97%
- Verdict
- UNDERPRICED
- Comps
- 13 within 1.0 mi
Show comp detail 4 sales within ~0.75 mi
| Address | Dist | Beds/Ba | Sqft | Sold | Price | $/sf | Match |
|---|---|---|---|---|---|---|---|
| 2604 La Hwy 44 | 0.47mi | 3/2.0 (+1) | 1,457 (+3%) | 23mo | $210,000 | $144 | 44 |
| 2301 N King Ave | 0.67mi | 3/2.0 (+1) | 1,325 (-6%) | 8mo | $31,500 | $24 | 43 |
| 2169 S Albert St | 0.73mi | 3/1.0 (+1) | 1,435 (+2%) | 23mo | $145,000 | $101 | 39 |
| 2220 S Central Ave | 0.71mi | 3/2.0 (+1) | 1,600 (+13%) | 2mo | $198,000 | $124 | 35 |
Match score weights: distance 35% · size 25% · config 20% · recency 20%. Top-matched comps best support the ARV.
Projected returns pro-forma
-3.0% appreciation · 3.0% rent growth · sell at horizon
- IRR
- 2.2%
- Equity multiple
- 1.09×
- Total profit
- $2,047
- Equity at exit
- $12,674
- IRR
- 11.8%
- Equity multiple
- 1.93×
- Total profit
- $22,199
- Equity at exit
- $7,349
Cash invested: $23,800 (down + closing). Projections, not guarantees.
Landlord ↔ Tenant lean methodology
- Overall (STATE)
- 90 Strongly Landlord-Friendly
- State Louisiana
- 90 Strongly Landlord-Friendly · R+12
- County
- — inherits STATE
- City
- — inherits STATE
ZIP-level market 70763
- Active inventory
- 15
- Price-to-rent
- 6.7×
Monthly cashflow live
- Estimated rent
- $1,058 medium interval (Pro) →
- Mortgage (P&I)
- −$446
- Tax est. 1.5%
- −$106 /mo · $1,275/yr
- Insurance
- −$35
- HOA
- −$0
- Vacancy / Maint / Mgmt
- −$222
- Net cashflow
- $248
Break-even live
UW: 25.0% down · 7.5% · 30yr · 1.5% tax · 5.0% vac · 8.0% maint · 8.0% mgmt
Financing live
Cash to close
- Down payment
- $21,250
- Closing costs
- $2,550
- Reserves months
- —
- Total cash needed
- —
Loan-product check · same deal, 3 products live
Conventional
25% down · 7.5% · 30yr
- Down + closing
- —
- Monthly P&I
- —
- Monthly cashflow
- —
- DSCR
- —
- Eligible?
- —
Personal DTI + credit; lowest rate.
DSCR
20% down · 8.5% · 30yr
- Down + closing
- —
- Monthly P&I
- —
- Monthly cashflow
- —
- DSCR
- —
- Eligible?
- —
No personal income docs; deal must DSCR.
Hard money
10% down · 12.0% · 12mo
- Down + closing
- —
- Monthly P&I
- —
- Monthly cashflow
- —
- DSCR
- —
- Eligible?
- —
Short-term bridge; refi at stabilization.
Listing history 19 events
-
2026-06-19days on market $85,000 Active 155 DOM
-
2026-06-18days on market $85,000 Active 154 DOM
-
2026-06-17days on market $85,000 Active 153 DOM
-
2026-06-16days on market $85,000 Active 152 DOM
-
2026-06-15days on market $85,000 Active 151 DOM
-
2026-06-14days on market $85,000 Active 149 DOM
-
2026-06-13days on market $85,000 Active 148 DOM
-
2026-06-10days on market $85,000 Active 146 DOM
-
2026-06-09days on market $85,000 Active 145 DOM
-
2026-06-08days on market $85,000 Active 144 DOM
-
2026-06-07days on market $85,000 Active 143 DOM
-
2026-06-05days on market $85,000 Active 140 DOM
-
2026-06-02days on market $85,000 Active 138 DOM
-
2026-06-01days on market $85,000 Active 137 DOM
-
2026-05-31days on market $85,000 Active 136 DOM
-
2026-05-30days on market $85,000 Active 135 DOM
-
2026-01-14$85,000 Active 574-char remark
Show marketing remark (574 chars)
Cozy 2-bedroom, 1-bath home suited for investors seeking solid rental potential. Features a practical layout with a comfortable living area and a functional kitchen. Bedrooms offer useful space for tenants, and the single bath is straightforward and easy to maintain. Property sits on a manageable lot with room for minor updates to boost value. Reliable location for rental demand and a clean entry point for long-term hold or light renovation strategy. Living room is currently being used as a third bedroom. Sellers to make NO repairs. Property is currently being rented.
-
2025-12-22$70,000 Active
ⓘ Source: listings_history table (triggers on properties + properties_extension) + one-shot
backfill from property_details.listing_events for pre-trigger history.
Climate risk First Street
- Flood 1/10 Low FEMA zone X (shaded) · 0% chance over 30 yrs
- Wildfire 1/10 Low
- Heat 8/10 Severe 7 d/yr ≥108°F today · 21 d/yr by 30 yrs out
- Wind 9/10 Extreme 99% chance of damaging wind over 30 yrs
- Air quality 2/10 Low 1 unhealthy d/yr today · 1 by 30 yrs out
Nearby sold comps map
Loading sold comps map…
Walkable amenities ~0.75 mi
Loading nearby amenities…
Taxation est. · year 1
- Rental income
- $12,692
- − Mortgage interest
- −$4,761
- − Property taxes
- −$1,275
- − Insurance
- −$425
- − Repairs & maintenance
- −$1,015
- − Management
- −$1,015
- − Depreciation
- −$2,473
- Taxable income
- $1,727
- Est. tax owed @ 24.0%
- −$415
- After-tax cash flow
- $2,563/yr
For passive investors: Depreciation is non-cash, so a rental often shows a tax loss while cash-flowing — sheltering income. Rental losses are passive: they offset passive income freely, and up to $25,000/yr can offset ordinary (W-2) income if you actively participate and your MAGI is under $100k (phasing out to $0 by $150k); unused losses carry forward. On sale, claimed depreciation is recaptured at up to 25%, and gains may owe capital-gains tax (a 1031 exchange can defer both). Figures are a year-1 estimate at your 24.0% rate — not tax advice; consult a CPA.
Condition & rehab AI · 12 photos
The home requires moderate renovations to improve its condition and value. Key areas for improvement include the kitchen and bathrooms, which need new flooring and cleaning. Painting the interior walls and landscaping can also enhance the home's curb appeal.
Repairs flagged
- Major kitchen flooring — Worn and needs replacement
- Major bathroom flooring — Worn and needs replacement
- Moderate kitchen cabinets — Cluttered and need cleaning
- Moderate bathroom cabinets — Cluttered and need cleaning
Value-add opportunities
- Both Paint interior walls — Fresh paint can improve curb appeal and interior aesthetics
- Both Replace kitchen and bathroom flooring — New flooring will improve the home's appearance and functionality
- Both Deep clean and organize kitchen and bathrooms — A clean and organized space will attract more potential buyers/tenants
Renovation cost estimate screening
| Repair item | Severity | Est. cost |
|---|---|---|
| kitchen flooring · Worn and needs replacement | Major | $15,000–50,000 |
| bathroom flooring · Worn and needs replacement | Major | $15,000–50,000 |
| kitchen cabinets · Cluttered and need cleaning | Moderate | $3,000–15,000 |
| bathroom cabinets · Cluttered and need cleaning | Moderate | $3,000–15,000 |
| Total estimated repair cost · 4 items | $36,000–130,000 |
Value-add ROI direction
- Both Paint interior walls — Fresh paint can improve curb appeal and interior aesthetics ↑
- Both Replace kitchen and bathroom flooring — New flooring will improve the home's appearance and functionality ↑
- Both Deep clean and organize kitchen and bathrooms — A clean and organized space will attract more potential buyers/tenants ↑
ⓘ Cost ranges are severity-bucket heuristics (US national rule-of-thumb). Get contractor quotes + a written scope before underwriting a rehab budget.
Schools (NCES district)
- District
- St. James Parish
- NCES district ID
- 2201500
- Math proficiency
- 31% ▼ -44.00%
- Reading proficiency
- 41% ▼ -38.00%
- Median HH income
- $51,020
- Composite
- 31.24/100
- National rank
- #6031
- State rank
- #30 of 98 in LA
Livability — Paulina
- Score
- 69/100
- State rank
- #71
- US rank
- #8533
Category grades
Schools grade is shown separately in the Schools card above.
Census & demographics
- Census place
- Paulina, LA
- City population
- 4,539
- Population (ZIP)
- 4,539
Population outlook (St. James County) Hauer SSP2
- Today (2025)
- 20,741 people
- By 2030
- 20,140 · -2.9%
- By 2040
- 18,560 · -10.5%
- By 2050
- 16,673 · -19.6%
- By 2075
- 12,535 · -39.6%
- By 2100
- 8,610 · -58.5%
Race, ethnicity, and origin ACS 2023
- Neighborhood character
- Predominantly White (76%)
- Race & ethnicity
- White 76% Black 22% Hispanic / Latino 2% Two or more races 2%
- Common ancestry
- Lithuanian 20%
- Foreign-born
- 0%
Political lean MEDSL · St. James
- 2024 margin
- Toss-up / Even · D 49.1% · R 50.1%
- 2008→2024 swing
- -13.4pp toward R · 2008: 12.4pp · 2024: -0.9pp
- All cycles
- 2024: R+0.9 2020: D+4.4 2016: D+8.0 2012: D+14.9 2008: D+12.4
Not yet ingested
- Civics
- —
Market trends
- HPI YoY
- ▼ -124.38%
- Current HPI
- 120.1897
- Rent YoY
- —
- Metro
- —
- State GDP YoY
- ▲ 3.29%
- F500 in state
- 10
Industry mix (Fortune 500 HQ in LA)
| Industry | F500 HQs | Revenue |
|---|---|---|
| Telecommunications | 2 | $23B |
|
||
| Utilities | 1 | $12B |
|
||
| Wholesale / Distribution | 1 | $5B |
|
||
| Advertising | 1 | $2B |
|
||
Price history
+21.4% since first listed3 events — show timeline
- 2026-01-14 Listed $85,000 AcadianaMLS
- 2026-01-14 Listed $85,000 GSREIN
- 2025-12-22 Listed $70,000 Fizber.com
Cash-flow waterfall
monthlySold comps — $/sqft
last 12 mo · ≤1 miLoading sold comps…