318 Quail Ln · Penn Valley, CA
Flood risk 8/10 · Major
- FEMA flood zone
- X (unshaded)
- Chance of flooding over 30 yrs
- 0.99%
- Est. flood insurance / yr
- $507 – $1,088
Fire risk 10/10 · Severe
- Est. fire insurance / yr
- $659 – $1,223
Heat risk 6/10 · Moderate
- Hot days now (above 98°F)
- 7 days/yr
- Hot days in 30 yrs
- 16 days/yr
Wind risk 1/10 · Minimal
- Chance of severe wind over 30 yrs
- —
Air-quality risk 10/10 · Severe
- Unhealthy air days now
- 31 days/yr
- Unhealthy air days in 30 yrs
- 38 days/yr
Risk factors via First Street. Map © Google.
Why this score? — see what drove the B- grade
The composite is a weighted blend of 9 inputs, each scored 0–100. Each bar is that input's sub-score; the figure is the points it added to the 100-point composite (weight × sub-score).
- Cash flow +30.0/30.0
- 1% rule +10.0/10.0
- DSCR +10.0/10.0
- ARV discount +7.5/15.0
- Schools +3.2/10.0
- Rent growth +2.5/5.0
- Livability +2.5/5.0
- Condition / age +2.5/5.0
- Appreciation +0.0/10.0
$79,999
🖨 Deal sheet 📄 Offer letter ✓ Due diligence
Listing remarks
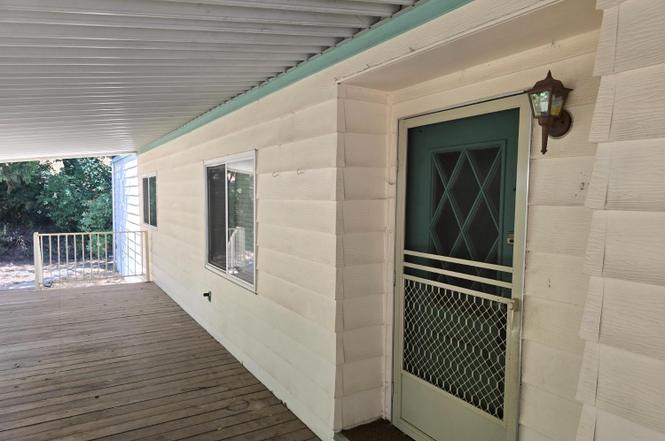
BRAND NEW COMP SHINGLE ROOF!!!!!! Move in ready home across the road from the creek. The large living room and formal dining make this a great home for entertaining. The large front porch is covered and ideal for sitting while enjoying the sounds of the near by creek on the quietest street in the park. There is also a laundry room with access to the covered parking area. 1500sq ft of living space for less than $90,000 is hard to come by! Must get park approval prior to the close of escrow.
Key facts
- Parking
- Built 1979
- Listed 106 days
Property features AI
Finance
- Financial info: Land lease: No (listed land lease amount present but property indicates no land lease)
- HOA & community: No association
Exterior
- Parking: Attached covered parking
- Utilities: Individual electric meter; Individual gas meter; 220V outlet in laundry; Private water; Septic system; Internet available
- Home design: Manufactured in-park double wide; Built in 1979
- Construction: Composition roof; Aluminum skirting; Skyline manufactured home
- Exterior features: Storage shed(s); Additional storage area
Interior
- Kitchen: Gas cook top; Range hood; Dishwasher
- Bedrooms: 2 bedrooms
- Flooring: Carpet; Laminate; Wood
- Bathrooms: 2 full bathrooms; Tub and separate shower stall(s)
- Heating & cooling: Central heating; Central air conditioning; Ceiling fans
- Interior features: Great room living area; Formal dining area; Breakfast area; Synthetic kitchen counters; Storage area (interior)
- Laundry & utility: Washer/dryer hookups inside
Neighborhood map
What this means for you Summary
Snapshot
- This is a 2-bed/2.0-bath manufactured listed at $80k.
Deal economics
- At list price, monthly cash flow is $1k ($15k/yr) — positive.
- The deal already cash-flows at list — no discount required.
- Meets the 1% rule at list price ($2k rent vs $80k).
- Recommended offer: $73k (9.0% below list) — sets the bar for market timing.
- Cap rate 25.8% vs local median 2.8% in Penn Valley — top-decile yield for the area; either an underpriced asset or a hidden risk that comps aren't pricing in. Stress-test before assuming the spread holds.
Location & tenants
- Location reads 50/100 on livability (#1,129 in CA) — a working-class tenant base; expect higher turnover. Strengths: crime A; Watch: employment C-, schools D+, amenities F.
- Penn Valley Union Elementary (town): math 31% / reading 42% proficiency, ranked #253 of 517 in CA (top 49%) — families likely to look elsewhere, expect single-tenant / working-renter base with shorter leases.
- Market conditions: 146 active listings in the ZIP; 215 units permitted in Nevada County in 2024 (0 in 5+ unit buildings).
Forward outlook
- Local home prices are declining (-3.0%/yr); year-one equity from $553 of loan paydown is wiped out by about $2k of value loss. Plan a longer hold.
- Nevada County population projected at -14% by 2050 — secular population decline; favor cash flow + early exit over multi-decade hold.
- At projected returns (-3.0% appreciation + 3.0% rent growth), your $22k cash investment doubles in ~2 years — after that, you're playing with house money.
Negotiation context
- It's been on market 107 days — a 9% lower offer ($73k) is reasonable based on typical stale-listing flexibility.
Risks & watch-outs
- Watch-outs: flood insurance adds $66/mo.
- Climate carrying-cost: severe flood risk; severe wildfire risk; extreme-heat days projected 7→16/yr by 2055 (HVAC capex compounding) — expect insurance premiums to compound above CPI over the hold.
Questions for the listing agent
- It's been on market 107 days. Have you received any prior offers? Is the seller open to a 9% concession, seller financing, or rate buy-down credit?
- Built in 1979 — when were the roof, HVAC, electrical panel, plumbing, and water heater last replaced?
- What's the actual annual flood-insurance premium (NFIP or private), and is the property in a SFHA with mandatory coverage?
- Why hasn't it sold? Are there any deal-killer items the seller is aware of (foundation, flood, title, zoning, code violations)?
- Is there a deadline driving the sale (1031 exchange, divorce, estate, relocation)? That informs how much negotiation room exists.
- Schools are D-rated, which usually means shorter tenancies and higher turnover. Who's the typical renter profile here, and what's been the actual vacancy rate?
- What's the average days-on-market for RENTAL listings here right now (not sales)? A rising rental-DOM trend means longer vacancies and softer asking-rent achievability than the comps imply.
- What's the recent tenant-quality profile in this submarket — average credit score on applications, eviction rate, late-payment / NSF rate, and stable-employment percentage? A property-management company in the area should have these aggregated.
- How much new for-sale + rental construction is in the pipeline within 1–3 miles? Heavy new supply typically softens prices + rents 12–24 months out; constrained supply supports both.
Investment metrics
- 1% rule
- 2.93% ✓
- Cap rate
- 25.78%
- Cash-on-cash
- 69.61%
- DSCR
- 4.10
- GRM
- 2.8
CMA / ARV
- ARV (on-the-fly)
- $459,862
- Comps found
- 2
Show comp detail 2 sales within ~0.75 mi
| Address | Dist | Beds/Ba | Sqft | Sold | Price | $/sf | Match |
|---|---|---|---|---|---|---|---|
| 314 Quail Ln | 0.02mi | 3/2.0 (+1) | 1,344 (-13%) | 3mo | $80,000 | $60 | 70 |
| 10372 Quincy Ln | 0.37mi | 2/2.0 | 1,456 (-5%) | 14mo | $435,000 | $299 | 62 |
Match score weights: distance 35% · size 25% · config 20% · recency 20%. Top-matched comps best support the ARV.
Projected returns pro-forma
-3.0% appreciation · 3.0% rent growth · sell at horizon
- IRR
- 65.3%
- Equity multiple
- 3.93×
- Total profit
- $65,641
- Equity at exit
- $11,928
- IRR
- 69.7%
- Equity multiple
- 8.08×
- Total profit
- $158,587
- Equity at exit
- $6,917
Cash invested: $22,400 (down + closing). Projections, not guarantees.
Landlord ↔ Tenant lean methodology
- Overall (STATE)
- 18 Strongly Tenant-Friendly
- State California
- 18 Strongly Tenant-Friendly · D+13
- County
- — inherits STATE
- City
- — inherits STATE
ZIP-level market 95946
- Home prices YoY
- -33.5%
- Active inventory
- 146
- Price-to-rent
- 2.8×
Monthly cashflow live
- Estimated rent
- $2,345 medium interval (Pro) →
- Mortgage (P&I)
- −$420
- Tax est. 1.5%
- −$100 /mo · $1,200/yr
- Insurance
- −$33
- Flood insurance flood zone
- −$66 /mo · $798/yr
- HOA
- −$0
- Vacancy / Maint / Mgmt
- −$492
- Net cashflow
- $1,233
Break-even live
UW: 25.0% down · 7.5% · 30yr · 1.5% tax · 5.0% vac · 8.0% maint · 8.0% mgmt
Financing live
Cash to close
- Down payment
- $20,000
- Closing costs
- $2,400
- Reserves months
- —
- Total cash needed
- —
Loan-product check · same deal, 3 products live
Conventional
25% down · 7.5% · 30yr
- Down + closing
- —
- Monthly P&I
- —
- Monthly cashflow
- —
- DSCR
- —
- Eligible?
- —
Personal DTI + credit; lowest rate.
DSCR
20% down · 8.5% · 30yr
- Down + closing
- —
- Monthly P&I
- —
- Monthly cashflow
- —
- DSCR
- —
- Eligible?
- —
No personal income docs; deal must DSCR.
Hard money
10% down · 12.0% · 12mo
- Down + closing
- —
- Monthly P&I
- —
- Monthly cashflow
- —
- DSCR
- —
- Eligible?
- —
Short-term bridge; refi at stabilization.
Listing history 17 events
-
2026-06-19days on market $79,999 Active 107 DOM
-
2026-06-18days on market $79,999 Active 106 DOM
-
2026-06-17days on market $79,999 Active 105 DOM
-
2026-06-16days on market $79,999 Active 104 DOM
-
2026-06-15days on market $79,999 Active 103 DOM
-
2026-06-14days on market $79,999 Active 101 DOM
-
2026-06-13pricedays on market $79,999 Active 100 DOM
-
2026-06-10days on market $85,000 Active 98 DOM
-
2026-06-09days on market $85,000 Active 97 DOM
-
2026-06-08days on market $85,000 Active 96 DOM
-
2026-06-07days on market $85,000 Active 95 DOM
-
2026-06-05days on market $85,000 Active 92 DOM
-
2026-06-03days on market $85,000 Active 91 DOM
-
2026-06-02days on market $85,000 Active 90 DOM
-
2026-06-01days on market $85,000 Active 89 DOM
-
2026-05-31days on market $85,000 Active 88 DOM
-
2026-05-30days on market $85,000 Active 87 DOM
ⓘ Source: listings_history table (triggers on properties + properties_extension) + one-shot
backfill from property_details.listing_events for pre-trigger history.
Climate risk First Street
- Flood 8/10 Severe FEMA zone X (unshaded) · 99% chance over 30 yrs
- Wildfire 10/10 Extreme
- Heat 6/10 Major 7 d/yr ≥98°F today · 16 d/yr by 30 yrs out
- Wind 1/10 Low
- Air quality 10/10 Extreme 31 unhealthy d/yr today · 38 by 30 yrs out
Nearby sold comps map
Loading sold comps map…
Walkable amenities ~0.75 mi
Loading nearby amenities…
Taxation est. · year 1
- Rental income
- $28,136
- − Mortgage interest
- −$4,481
- − Property taxes
- −$1,200
- − Insurance
- −$1,197
- − Repairs & maintenance
- −$2,251
- − Management
- −$2,251
- − Depreciation
- −$2,327
- Taxable income
- $14,428
- Est. tax owed @ 24.0%
- −$3,463
- After-tax cash flow
- $11,333/yr
For passive investors: Depreciation is non-cash, so a rental often shows a tax loss while cash-flowing — sheltering income. Rental losses are passive: they offset passive income freely, and up to $25,000/yr can offset ordinary (W-2) income if you actively participate and your MAGI is under $100k (phasing out to $0 by $150k); unused losses carry forward. On sale, claimed depreciation is recaptured at up to 25%, and gains may owe capital-gains tax (a 1031 exchange can defer both). Figures are a year-1 estimate at your 24.0% rate — not tax advice; consult a CPA.
Schools (NCES district)
- District
- Penn Valley Union Elementary
- NCES district ID
- 0601427
- Math proficiency
- 31% ▼ -9.00%
- Reading proficiency
- 42% ▼ -11.00%
- Median HH income
- $58,786
- Composite
- 32.4/100
- National rank
- #5728
- State rank
- #253 of 517 in CA
Livability — Penn Valley
- Score
- 50/100
- State rank
- #1129
- US rank
- #25672
Category grades
Schools grade is shown separately in the Schools card above.
Census & demographics
- Census place
- Penn Valley, CA
- Population (ZIP)
- 9,448
Population outlook (Nevada County) Hauer SSP2
- Today (2025)
- 98,490 people
- By 2030
- 97,295 · -1.2%
- By 2040
- 92,041 · -6.5%
- By 2050
- 85,164 · -13.5%
- By 2075
- 68,436 · -30.5%
- By 2100
- 49,536 · -49.7%
Race, ethnicity, and origin ACS 2023
- Neighborhood character
- Predominantly White (79%)
- Race & ethnicity
- White 79% Hispanic / Latino 14% Two or more races 13%
- Hispanic origin (detail)
- Mexican 7% Puerto Rican 4%
- Common ancestry
- Italian 5% Portuguese 3% Lithuanian 2%
- Foreign-born
- 2% · Canada, South Korea
- Languages at home
- 95% English-only · Spanish 4% French/Haitian/Cajun 1%
Political lean MEDSL · Nevada
- 2024 margin
- D (+12.2) · D 54.4% · R 42.1% · Other 3.5%
- 2008→2024 swing
- +6.9pp toward D · 2008: 5.3pp · 2024: 12.2pp
- All cycles
- 2024: D+12.2 2020: D+14.8 2016: D+4.5 2012: R+4.7 2008: D+5.3
Not yet ingested
- Civics
- —
Market trends
- HPI YoY
- ▼ -114.27%
- Current HPI
- 226.5683
- Rent YoY
- —
- Metro
- —
- State GDP YoY
- ▲ 3.21%
- F500 in state
- 116
Industry mix (Fortune 500 HQ in CA)
| Industry | F500 HQs | Revenue |
|---|---|---|
| Technology | 27 | $1,492B |
|
||
| Financial Services | 3 | $174B |
|
||
| Retail | 3 | $44B |
|
||
| Insurance | 3 | $26B |
|
||
| Media / Entertainment | 2 | $115B |
|
||
| Pharmaceuticals / Biotech | 2 | $62B |
|
||
Property tax history
+2.2%/yrLatest (2025): $66 · +3.8% YoY. Source: county tax records.
Cash-flow waterfall
monthlySold comps — $/sqft
last 12 mo · ≤1 miLoading sold comps…