815 Lake Bernie Rd · Cisco, TX
Flood risk No data
- FEMA flood zone
- —
- Chance of flooding over 30 yrs
- —
- Est. flood insurance / yr
- —
Fire risk No data
- Est. fire insurance / yr
- —
Heat risk No data
- Hot days now (above threshold)
- —
- Hot days in 30 yrs
- —
Wind risk No data
- Chance of severe wind over 30 yrs
- —
Air-quality risk No data
- Unhealthy air days now
- —
- Unhealthy air days in 30 yrs
- —
Risk factors via First Street. Map © Google.
Why this score? — see what drove the D- grade
The composite is a weighted blend of 9 inputs, each scored 0–100. Each bar is that input's sub-score; the figure is the points it added to the 100-point composite (weight × sub-score).
- Appreciation +9.4/10.0
- ARV discount +7.5/15.0
- Cash flow +6.9/30.0
- Schools +4.6/10.0
- Livability +3.8/5.0
- Rent growth +2.5/5.0
- Condition / age +2.5/5.0
- DSCR +1.2/10.0
- 1% rule +0.6/10.0
$135,000
🖨 Deal sheet (PDF) 📄 Offer letter ✓ Due diligence
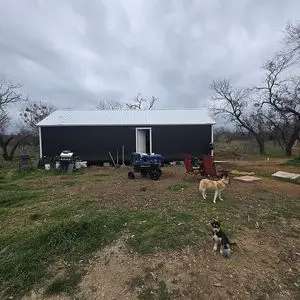
Listing remarks
Investors special or call it home. AS-IS land and home package. 1.48 acres total, with 1.10 acre fenced in. There are 2 separate utilities on site one of which is hooked into a 16& apos; x40& apos; cabin (electric, water, septic). Land cleared, gravel driveway, and a 20& apos; container. 18x40 Cabin that is about 90%-95% finished on the interior. All utilities are hooked into cabin. Investors - plenty of room to add multiple RV& apos; s or cabins for monthly rent! Reach out if you would like to take a look!!!
Key facts
- Separate utilities
- Fenced in
- Finished interior
Tags
Property features AI
Exterior
- Home design: Built in 2025; Single-story residence
- Construction: Living area about 720
- Exterior features: Lot approximately 1.48 acres
Neighborhood map
What this means for you Summary
Snapshot
- This is a 1-bed/1.0-bath single-family listed at $135k.
Deal economics
- At list price, monthly cash flow is $-202 ($-2k/yr) — negative.
- To cash-flow at today's rent, offer at most $99k (26.4% below list).
- To meet the 1% rule (rent ≥ 1% of price), the offer needs to be $75k (44.2% below list).
- Recommended offer: $75k (44.2% below list) — sets the bar for 1% rule.
- Cap rate 4.5% vs local median 3.5% in Cisco — meaningfully above typical; check what's discounted (condition, days-on-market, listing class) to confirm the premium yield is real.
Location & tenants
- Location reads 75/100 on livability (#121 in TX, #3,812 nationally) — a middle-class / working-renter tenant base. Strengths: crime A+, cost of living A+, housing A+; Watch: amenities F, commute F.
- Cisco ISD (town): math 53% / reading 58% proficiency, ranked #118 of 826 in TX (top 14%) — acceptable for families but not a draw, mixed tenant base, ~2y average lease.
- Zoned schools: Cisco El (math 47% / reading 57%, grade C-, #742 of 4,322 statewide, top 19%, 415 students, 60% FRL); Cisco J H (math 52% / reading 52%, grade C+, #301 of 1,662 statewide, top 19%, 161 students, 48% FRL); Cisco H S (math 72% / reading 77%, grade B+, #82 of 1,632 statewide, top 6%, 234 students, 47% FRL) — zoned schools at 52% FRL track the district average.
- Market conditions: 82 active listings in the ZIP; 10 units permitted in Eastland County in 2024 (0 in 5+ unit buildings).
Forward outlook
- In year one you build about $13k of equity ($933 loan paydown + $12k appreciation (8.8% local appreciation)).
- Eastland County population projected at -14% by 2050 — secular population decline; favor cash flow + early exit over multi-decade hold.
- By year 3, paydown + projected appreciation supports a ~$32k cash-out refi (75% LTV) — recoverable capital for the next deal without selling this one.
Negotiation context
- It's been on market 27 days — a 2% lower offer ($133k) is reasonable based on typical stale-listing flexibility.
Questions for the listing agent
- What do current leases actually rent for vs. the listed asking? Can we see a recent rent roll and the last 12 months of T-12 income?
- Is there a deadline driving the sale (1031 exchange, divorce, estate, relocation)? That informs how much negotiation room exists.
- The area grade is low — what's the realistic commute time and amenity access for the typical tenant pool here? Any planned neighborhood developments (good or bad) we should know about?
- What's the average days-on-market for RENTAL listings here right now (not sales)? A rising rental-DOM trend means longer vacancies and softer asking-rent achievability than the comps imply.
- What's the recent tenant-quality profile in this submarket — average credit score on applications, eviction rate, late-payment / NSF rate, and stable-employment percentage? A property-management company in the area should have these aggregated.
- How much new for-sale + rental construction is in the pipeline within 1–3 miles? Heavy new supply typically softens prices + rents 12–24 months out; constrained supply supports both.
Investment metrics
- 1% rule
- 0.56% ✗
- Cap rate
- 4.50%
- Cash-on-cash
- -6.40%
- DSCR
- 0.72
- GRM
- 14.9
CMA / ARV
No comps found within radius.
Projected returns pro-forma
8.82% appreciation · 3.0% rent growth · sell at horizon
- IRR
- 17.1%
- Equity multiple
- 2.32×
- Total profit
- $49,843
- Equity at exit
- $110,165
- IRR
- 16.2%
- Equity multiple
- 5.09×
- Total profit
- $154,676
- Equity at exit
- $226,354
Cash invested: $37,800 (down + closing). Projections, not guarantees.
Landlord ↔ Tenant lean methodology
- Overall (STATE)
- 87 Strongly Landlord-Friendly
- State Texas
- 87 Strongly Landlord-Friendly · R+5
- County
- — inherits STATE
- City
- — inherits STATE
ZIP-level market 76437
- Home prices YoY
- 5.6%
- Active inventory
- 82
- Price-to-rent
- 14.9×
Monthly cashflow live
- Estimated rent
- $754 medium interval (Pro) →
- Mortgage (P&I)
- −$708
- Tax from tax record
- −$33 /mo · $397/yr
- Insurance
- −$56
- HOA
- −$0
- Vacancy / Maint / Mgmt
- −$158
- Net cashflow
- $-202
Break-even live
Sensitivity live
| Price | -10% $-125 | -5% $-163 | +0% $-202 | +5% $-240 | +10% $-278 |
|---|---|---|---|---|---|
| Rent | -10% $-261 | -5% $-231 | +0% $-202 | +5% $-172 | +10% $-142 |
| Rate | -1.0pp $-134 | -0.5pp $-167 | base $-202 | +0.5pp $-237 | +1.0pp $-272 |
UW: 25.0% down · 7.5% · 30yr · 1.5% tax · 5.0% vac · 8.0% maint · 8.0% mgmt
Financing live
Cash to close
- Down payment
- $33,750
- Closing costs
- $4,050
- Reserves months
- —
- Total cash needed
- —
Loan-product check · same deal, 3 products live
Conventional
25% down · 7.5% · 30yr
- Down + closing
- —
- Monthly P&I
- —
- Monthly cashflow
- —
- DSCR
- —
- Eligible?
- —
Personal DTI + credit; lowest rate.
DSCR
20% down · 8.5% · 30yr
- Down + closing
- —
- Monthly P&I
- —
- Monthly cashflow
- —
- DSCR
- —
- Eligible?
- —
No personal income docs; deal must DSCR.
Hard money
10% down · 12.0% · 12mo
- Down + closing
- —
- Monthly P&I
- —
- Monthly cashflow
- —
- DSCR
- —
- Eligible?
- —
Short-term bridge; refi at stabilization.
Listing history 18 events
-
2026-06-22days on market $135,000 Active 27 DOM
-
2026-06-21days on market $135,000 Active 26 DOM
-
2026-06-21days on market $135,000 Active 25 DOM
-
2026-06-18days on market $135,000 Active 23 DOM
-
2026-06-17days on market $135,000 Active 22 DOM
-
2026-06-16days on market $135,000 Active 21 DOM
-
2026-06-15days on market $135,000 Active 20 DOM
-
2026-06-13days on market $135,000 Active 18 DOM
-
2026-06-12days on market $135,000 Active 17 DOM
-
2026-06-09days on market $135,000 Active 14 DOM
-
2026-06-08days on market $135,000 Active 13 DOM
-
2026-06-08days on market $135,000 Active 12 DOM
-
2026-06-07days on market $135,000 Active 11 DOM
-
2026-06-03days on market $135,000 Active 8 DOM
-
2026-06-02days on market $135,000 Active 7 DOM
-
2026-06-01days on market $135,000 Active 6 DOM
-
2026-05-31days on market $135,000 Active 5 DOM
-
2026-05-26$135,000 Active
ⓘ Source: listings_history table (triggers on properties + properties_extension) + one-shot
backfill from property_details.listing_events for pre-trigger history.
Tax reassessment forecast TX · Resets to sale price
- Current annual tax
- $397 · $33/mo
- Projected year-2 tax
- $2,470 · $206/mo
- Expected delta
- +$2,074/yr (+$173/mo · 522.7%)
ⓘ Screening estimate from a state-policy table — verify with the county assessor before closing.
Nearby sold comps map
Loading sold comps map…
Walkable amenities ~0.75 mi
Loading nearby amenities…
Taxation est. · year 1
- Rental income
- $9,047
- − Mortgage interest
- −$7,562
- − Property taxes
- −$397
- − Insurance
- −$675
- − Repairs & maintenance
- −$724
- − Management
- −$724
- − Depreciation
- −$3,927
- Taxable loss
- −$4,961
- Est. tax savings @ 24.0%
- +$1,191
- After-tax cash flow
- $-1,229/yr
For passive investors: Depreciation is non-cash, so a rental often shows a tax loss while cash-flowing — sheltering income. Rental losses are passive: they offset passive income freely, and up to $25,000/yr can offset ordinary (W-2) income if you actively participate and your MAGI is under $100k (phasing out to $0 by $150k); unused losses carry forward. On sale, claimed depreciation is recaptured at up to 25%, and gains may owe capital-gains tax (a 1031 exchange can defer both). Figures are a year-1 estimate at your 24.0% rate — not tax advice; consult a CPA.
Schools (NCES district)
- District
- Cisco ISD
- NCES district ID
- 4814070
- Math proficiency
- 53% ▼ -2.00%
- Reading proficiency
- 58% ▲ 6.00%
- Median HH income
- $39,085
- Composite
- 46.29/100
- National rank
- #2478
- State rank
- #118 of 826 in TX
Livability — Cisco
- Score
- 75/100
- State rank
- #121
- US rank
- #3812
Category grades
Schools grade is shown separately in the Schools card above.
Census & demographics
- Population (ZIP)
- 5,895
Population outlook (Eastland County) Hauer SSP2
- Today (2025)
- 17,433 people
- By 2030
- 16,908 · -3.0%
- By 2040
- 15,855 · -9.1%
- By 2050
- 14,906 · -14.5%
- By 2075
- 12,843 · -26.3%
- By 2100
- 10,344 · -40.7%
Race, ethnicity, and origin ACS 2023
- Neighborhood character
- Predominantly White (79%)
- Race & ethnicity
- White 79% Hispanic / Latino 18% Two or more races 10% Black 1%
- Hispanic origin (detail)
- Mexican 16%
- Common ancestry
- Italian 14% Serbian 3% Slovak 2%
- Foreign-born
- 3% · Canada
- Languages at home
- 86% English-only · Spanish 12% Vietnamese 1%
Political lean MEDSL · Eastland
- 2024 margin
- Solid R (+77.5) · D 11.0% · R 88.5%
- 2008→2024 swing
- -17.6pp toward R · 2008: -59.8pp · 2024: -77.5pp
- All cycles
- 2024: R+77.5 2020: R+75.4 2016: R+75.4 2012: R+68.9 2008: R+59.8
Not yet ingested
- Civics
- —
Market trends
- HPI YoY
- ▲ 8.82%
- Current HPI
- 167.4457
- Rent YoY
- —
- Metro
- —
- State GDP YoY
- ▲ 3.95%
- F500 in state
- 110
Industry mix (Fortune 500 HQ in TX)
| Industry | F500 HQs | Revenue |
|---|---|---|
| Energy | 16 | $1,198B |
|
||
| Technology | 5 | $198B |
|
||
| Engineering / Construction | 4 | $72B |
|
||
| Energy Services | 3 | $60B |
|
||
| Utilities | 3 | $41B |
|
||
| Healthcare | 2 | $330B |
|
||
Price history
1 event — show timeline
- 2026-05-26 Listed $135,000 FSBO.com
Property tax history
+15.0%/yrLatest (2025): $397 · +179.4% YoY. Source: county tax records.
Cash-flow waterfall
monthlySold comps — $/sqft
last 12 mo · ≤1 miLoading sold comps…