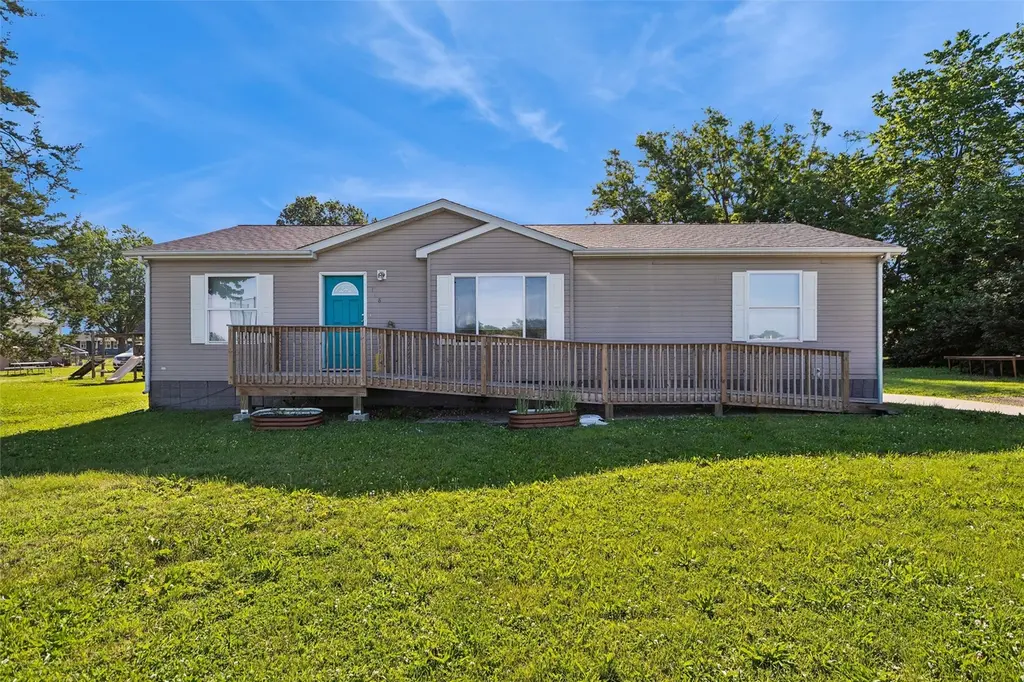
108 3rd St SE · Melcher-Dallas, IA
Flood risk 1/10 · Minimal
- FEMA flood zone
- X (unshaded)
- Chance of flooding over 30 yrs
- 0.0%
- Est. flood insurance / yr
- $507 – $1,088
Fire risk 4/10 · Minor
- Est. fire insurance / yr
- $902 – $1,676
Heat risk 3/10 · Minor
- Hot days now (above 104°F)
- 7 days/yr
- Hot days in 30 yrs
- 15 days/yr
Wind risk 2/10 · Minimal
- Chance of severe wind over 30 yrs
- —
Air-quality risk 2/10 · Minimal
- Unhealthy air days now
- 1 days/yr
- Unhealthy air days in 30 yrs
- 2 days/yr
Risk factors via First Street. Map © Google.
Why this score? — see what drove the D+ grade
The composite is a weighted blend of 9 inputs, each scored 0–100. Each bar is that input's sub-score; the figure is the points it added to the 100-point composite (weight × sub-score).
- ARV discount +14.1/15.0
- Cash flow +8.5/30.0
- Appreciation +8.5/10.0
- Schools +4.8/10.0
- 1% rule +2.6/10.0
- Rent growth +2.5/5.0
- Livability +2.5/5.0
- Condition / age +2.5/5.0
- DSCR +2.3/10.0
$145,000
🖨 Deal sheet (PDF) 📄 Offer letter ✓ Due diligence
Listing remarks MLS
Small town living at a great price! This 3BR manufactured home gives you a spacious floorplan with vaulted living spaces. Huge kitchen with pantry and breakfast bar. Living room is bright and cheery with picture window. Master suite has walk in closet and full bath with separate tub and shower. 2 additional bedrooms served by a full hall bath. Large, level yard with close access to baseball fields and walking distance to Melcher's quaint downtown. Low maintenance, move in ready condition!
Key facts
- Open floor plan
- Private bath
- Newer deck
Tags
Property features AI
Exterior
- Utilities: Public water; Public sewer
- Home design: Resale property; Zoned residential
- Construction: Vinyl siding; Asphalt shingle roof
- Exterior features: Smoke detectors
Interior
- Kitchen: Dishwasher; Microwave; Refrigerator; Stove
- Bedrooms: 3 main-level bedrooms
- Flooring: Carpet; Laminate
- Bathrooms: 2 full bathrooms
- Heating & cooling: Forced air heating (natural gas); Central air conditioning
- Interior features: Accessible approach with ramp; Dining area
- Laundry & utility: Main-level laundry; Washer; Dryer
Neighborhood map
What this means for you Summary
Snapshot
- This is a 3-bed/2.0-bath single-family listed at $145k.
Deal economics
- At list price, monthly cash flow is $-128 ($-2k/yr) — negative.
- To cash-flow at today's rent, offer at most $122k (15.6% below list).
- To meet the 1% rule (rent ≥ 1% of price), the offer needs to be $110k (24.2% below list).
- Recommended offer: $110k (24.2% below list) — sets the bar for 1% rule.
Location & tenants
- Location reads: area grade D — affects rentability + tenant quality, not the cash-flow math above.
- Melcher-Dallas Community School District (rural): math 51% / reading 63% proficiency, ranked #259 of 289 in IA (top 90%) — acceptable for families but not a draw, mixed tenant base, ~2y average lease.
- Zoned schools: Melcher-Dallas Elem (math 52% / reading 57%, grade C, #462 of 616 statewide, top 79%, 177 students, 31% FRL); Melcher-Dallas High School (math 52% / reading 67%, grade C+, #263 of 336 statewide, top 81%, 153 students, 34% FRL) — zoned schools at 33% FRL track the district average.
- Market conditions: 6 active listings in the ZIP; 122 units permitted in Marion County in 2024 (0 in 5+ unit buildings).
Forward outlook
- In year one you build about $11k of equity ($1k loan paydown + $10k appreciation (7.1% local appreciation)).
- Marion County population projected to shrink 7% by 2050 — rents likely to lag national; underwrite the cash flow, not the appreciation.
- By year 4, paydown + projected appreciation supports a ~$39k cash-out refi (75% LTV) — recoverable capital for the next deal without selling this one.
Negotiation context
- It's been on market 18 days — a 2% lower offer ($143k) is reasonable based on typical stale-listing flexibility.
- 8 sale attempts since 17y ago with the ask held roughly flat each time — persistent listings suggest the price (not the market) is what's stuck; bring a comps-based counter.
- Current owner paid $80k; list at $145k implies a 81% gain — meaningful room to come down on a strong offer.
Questions for the listing agent
- What do current leases actually rent for vs. the listed asking? Can we see a recent rent roll and the last 12 months of T-12 income?
- Is there a deadline driving the sale (1031 exchange, divorce, estate, relocation)? That informs how much negotiation room exists.
- The area grade is low — what's the realistic commute time and amenity access for the typical tenant pool here? Any planned neighborhood developments (good or bad) we should know about?
- What's the average days-on-market for RENTAL listings here right now (not sales)? A rising rental-DOM trend means longer vacancies and softer asking-rent achievability than the comps imply.
- What's the recent tenant-quality profile in this submarket — average credit score on applications, eviction rate, late-payment / NSF rate, and stable-employment percentage? A property-management company in the area should have these aggregated.
- How much new for-sale + rental construction is in the pipeline within 1–3 miles? Heavy new supply typically softens prices + rents 12–24 months out; constrained supply supports both.
Investment metrics
- 1% rule
- 0.76% ✗
- Cap rate
- 5.23%
- Cash-on-cash
- -3.78%
- DSCR
- 0.83
- GRM
- 11.0
CMA / ARV
- ARV (on-the-fly)
- $169,884
- Comps found
- 12
Show comp detail 12 sales within ~0.75 mi
| Address | Dist | Beds/Ba | Sqft | Sold | Price | $/sf | Match |
|---|---|---|---|---|---|---|---|
| 315 SW 1st St | 0.41mi | 3/1.5 | 1,374 (-2%) | 1mo | $161,000 | $117 | 74 |
| 712 Jackson St | 0.53mi | 3/2.0 | 1,296 (-8%) | 1mo | $86,900 | $67 | 61 |
| 111 1st St NW | 0.30mi | 4/2.0 (+1) | 1,494 (+6%) | 12mo | $225,000 | $151 | 61 |
| 516 SE 1st St | 0.46mi | 3/2.0 | 1,304 (-7%) | 12mo | $167,000 | $128 | 57 |
| 206 NE 2nd St | 0.37mi | 4/1.0 (+1) | 1,387 (-1%) | 19mo | $175,000 | $126 | 56 |
| 203 SE D St | 0.48mi | 3/2.0 | 1,504 (+7%) | 13mo | $150,000 | $100 | 55 |
| 104 W Spring Rd | 0.65mi | 4/1.0 (+1) | 1,457 (+4%) | 3mo | $177,000 | $121 | 51 |
| 102 Church St | 0.63mi | 3/1.0 | 1,377 (-2%) | 19mo | $55,000 | $40 | 48 |
| 801 Walnut St | 0.62mi | 3/1.0 | 1,264 (-10%) | 6mo | $164,900 | $130 | 46 |
| 604 Garfield St | 0.44mi | 4/2.0 (+1) | 1,272 (-9%) | 18mo | $210,000 | $165 | 44 |
| 301 Church St | 0.61mi | 2/1.0 (-1) | 1,379 (-2%) | 20mo | $162,000 | $117 | 43 |
| 107 SW 2nd St | 0.38mi | 4/1.0 (+1) | 1,600 (+14%) | 17mo | $75,000 | $47 | 36 |
Match score weights: distance 35% · size 25% · config 20% · recency 20%. Top-matched comps best support the ARV.
Projected returns pro-forma
7.07% appreciation · 3.0% rent growth · sell at horizon
- IRR
- 14.9%
- Equity multiple
- 2.06×
- Total profit
- $43,103
- Equity at exit
- $101,126
- IRR
- 14.9%
- Equity multiple
- 4.24×
- Total profit
- $131,350
- Equity at exit
- $192,681
Cash invested: $40,600 (down + closing). Projections, not guarantees.
Landlord ↔ Tenant lean methodology
- Overall (STATE)
- 83 Strongly Landlord-Friendly
- State Iowa
- 83 Strongly Landlord-Friendly · R+6
- County
- — inherits STATE
- City
- — inherits STATE
ZIP-level market 50163
- Home prices YoY
- 4.3%
- Active inventory
- 6
- Price-to-rent
- 11.0×
Monthly cashflow live
- Estimated rent
- $1,100 medium interval (Pro) →
- Mortgage (P&I)
- −$760
- Tax from tax record
- −$176 /mo · $2,112/yr
- Insurance
- −$60
- HOA
- −$0
- Vacancy / Maint / Mgmt
- −$231
- Net cashflow
- $-128
Break-even live
Sensitivity live
| Price | -10% $-46 | -5% $-87 | +0% $-128 | +5% $-169 | +10% $-210 |
|---|---|---|---|---|---|
| Rent | -10% $-215 | -5% $-171 | +0% $-128 | +5% $-85 | +10% $-41 |
| Rate | -1.0pp $-55 | -0.5pp $-91 | base $-128 | +0.5pp $-166 | +1.0pp $-204 |
UW: 25.0% down · 7.5% · 30yr · 1.5% tax · 5.0% vac · 8.0% maint · 8.0% mgmt
Financing live
Cash to close
- Down payment
- $36,250
- Closing costs
- $4,350
- Reserves months
- —
- Total cash needed
- —
Loan-product check · same deal, 3 products live
Conventional
25% down · 7.5% · 30yr
- Down + closing
- —
- Monthly P&I
- —
- Monthly cashflow
- —
- DSCR
- —
- Eligible?
- —
Personal DTI + credit; lowest rate.
DSCR
20% down · 8.5% · 30yr
- Down + closing
- —
- Monthly P&I
- —
- Monthly cashflow
- —
- DSCR
- —
- Eligible?
- —
No personal income docs; deal must DSCR.
Hard money
10% down · 12.0% · 12mo
- Down + closing
- —
- Monthly P&I
- —
- Monthly cashflow
- —
- DSCR
- —
- Eligible?
- —
Short-term bridge; refi at stabilization.
Listing history 14 events
-
2026-06-22days on market $145,000 Active 18 DOM
-
2026-06-21days on market $145,000 Active 17 DOM
-
2026-06-19days on market $145,000 Active 15 DOM
-
2026-06-18days on market $145,000 Active 14 DOM
-
2026-06-17days on market $145,000 Active 13 DOM
-
2026-06-16days on market $145,000 Active 12 DOM
-
2026-06-15days on market $145,000 Active 11 DOM
-
2026-06-14days on market $145,000 Active 9 DOM
-
2026-06-12days on market $145,000 Active 8 DOM
-
2026-06-09days on market $145,000 Active 5 DOM
-
2026-06-08days on market $145,000 Active 4 DOM
-
2026-06-07days on market $145,000 Active 3 DOM
-
2026-06-05remarks 364-char remark
-
2026-06-05$145,000 Active 1 DOM
ⓘ Source: listings_history table (triggers on properties + properties_extension) + one-shot
backfill from property_details.listing_events for pre-trigger history.
Tax reassessment forecast IA · Partial reset (capped growth)
- Current annual tax
- $2,112 · $176/mo
- Projected year-2 tax
- $2,194 · $183/mo
- Expected delta
- +$82/yr (+$7/mo · 3.9%)
ⓘ Screening estimate from a state-policy table — verify with the county assessor before closing.
Climate risk First Street
- Flood 1/10 Low FEMA zone X (unshaded) · 0% chance over 30 yrs
- Wildfire 4/10 Moderate
- Heat 3/10 Moderate 7 d/yr ≥104°F today · 15 d/yr by 30 yrs out
- Wind 2/10 Low
- Air quality 2/10 Low 1 unhealthy d/yr today · 2 by 30 yrs out
Nearby sold comps map
Loading sold comps map…
Walkable amenities ~0.75 mi
Loading nearby amenities…
Taxation est. · year 1
- Rental income
- $13,198
- − Mortgage interest
- −$8,122
- − Property taxes
- −$2,112
- − Insurance
- −$725
- − Repairs & maintenance
- −$1,056
- − Management
- −$1,056
- − Depreciation
- −$4,218
- Taxable loss
- −$4,091
- Est. tax savings @ 24.0%
- +$982
- After-tax cash flow
- $-554/yr
For passive investors: Depreciation is non-cash, so a rental often shows a tax loss while cash-flowing — sheltering income. Rental losses are passive: they offset passive income freely, and up to $25,000/yr can offset ordinary (W-2) income if you actively participate and your MAGI is under $100k (phasing out to $0 by $150k); unused losses carry forward. On sale, claimed depreciation is recaptured at up to 25%, and gains may owe capital-gains tax (a 1031 exchange can defer both). Figures are a year-1 estimate at your 24.0% rate — not tax advice; consult a CPA.
Schools (NCES district)
- District
- Melcher-Dallas Community School District
- NCES district ID
- 1918960
- Math proficiency
- 51% ▲ 6.00%
- Reading proficiency
- 63% ▲ 13.00%
- Median HH income
- $43,108
- Composite
- 47.88/100
- National rank
- #2215
- State rank
- #259 of 289 in IA
Livability — Melcher-Dallas
No livability data for this city. (Only ~50 U.S. cities are tracked.)
Census & demographics
- Census place
- Melcher-Dallas, IA
- City population
- 1,502
- Population (ZIP)
- 669
Population outlook (Marion County) Hauer SSP2
- Today (2025)
- 32,883 people
- By 2030
- 32,685 · -0.6%
- By 2040
- 31,892 · -3.0%
- By 2050
- 30,691 · -6.7%
- By 2075
- 27,610 · -16.0%
- By 2100
- 23,851 · -27.5%
Race, ethnicity, and origin ACS 2023
- Neighborhood character
- Predominantly White (99%)
- Race & ethnicity
- White 99%
- Common ancestry
- Lithuanian 6% Iranian 5% Slovak 3%
Political lean MEDSL · Marion
- 2024 margin
- Solid R (+37.8) · D 30.4% · R 68.2% · Other 1.4%
- 2008→2024 swing
- -27.0pp toward R · 2008: -10.8pp · 2024: -37.8pp
- All cycles
- 2024: R+37.8 2020: R+33.7 2016: R+31.2 2012: R+13.3 2008: R+10.8
Not yet ingested
- Civics
- —
Market trends
- HPI YoY
- ▲ 7.07%
- Current HPI
- 171.2671
- Rent YoY
- —
- Metro
- —
- State GDP YoY
- ▲ 2.48%
- F500 in state
- 4
Industry mix (Fortune 500 HQ in IA)
| Industry | F500 HQs | Revenue |
|---|---|---|
| Financial Services | 1 | $16B |
|
||
| Retail / Convenience | 1 | $15B |
|
||
Price history
+65.7% since first listed16 events — show timeline
- 2026-06-04 Listed $145,000 DMMLS
- 2017-10-23 Sold (Public Records) $80,000 Public Records
- 2014-11-25 Sold (MLS) $55,000 DMMLS
- 2014-05-23 Listed $55,000 DMMLS
- 2014-01-24 Listing Removed — NORTHSTARMLS as Distributed by MLS Grid
- 2013-07-24 Listed $78,500 NORTHSTARMLS as Distributed by MLS Grid
- 2013-04-20 Listing Removed — NORTHSTARMLS as Distributed by MLS Grid
- 2012-11-20 Listed $79,900 NORTHSTARMLS as Distributed by MLS Grid
- 2012-10-25 Listing Removed — NORTHSTARMLS as Distributed by MLS Grid
- 2012-04-25 Listed $82,500 NORTHSTARMLS as Distributed by MLS Grid
- 2010-12-10 Listing Removed — NORTHSTARMLS as Distributed by MLS Grid
- 2010-06-10 Listed $86,000 NORTHSTARMLS as Distributed by MLS Grid
- 2010-01-01 Listing Removed — NORTHSTARMLS as Distributed by MLS Grid
- 2009-09-18 Listed $87,500 NORTHSTARMLS as Distributed by MLS Grid
- 2009-09-15 Listing Removed — NORTHSTARMLS as Distributed by MLS Grid
- 2009-04-06 Listed $87,500 NORTHSTARMLS as Distributed by MLS Grid
Property tax history
+1.9%/yrLatest (2025): $2,112 · +3.6% YoY. Source: county tax records.
Cash-flow waterfall
monthlySold comps — $/sqft
last 12 mo · ≤1 miLoading sold comps…