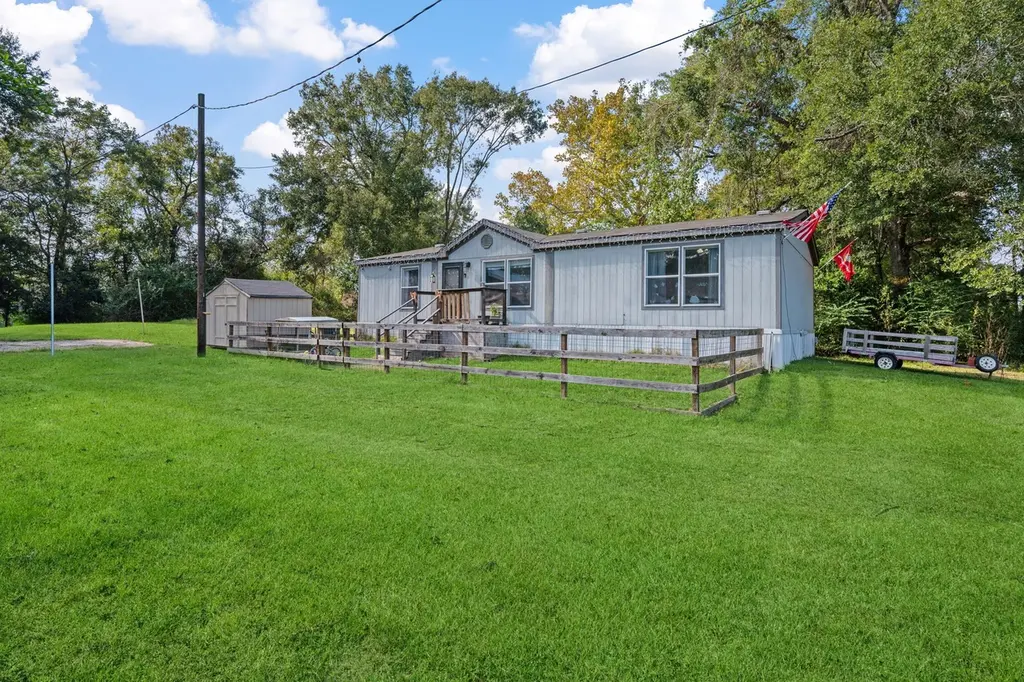
440 River Rd · Goodrich, TX
Flood risk No data
- FEMA flood zone
- —
- Chance of flooding over 30 yrs
- —
- Est. flood insurance / yr
- —
Fire risk No data
- Est. fire insurance / yr
- —
Heat risk No data
- Hot days now (above threshold)
- —
- Hot days in 30 yrs
- —
Wind risk No data
- Chance of severe wind over 30 yrs
- —
Air-quality risk No data
- Unhealthy air days now
- —
- Unhealthy air days in 30 yrs
- —
Risk factors via First Street. Map © Google.
Why this score? — see what drove the C+ grade
The composite is a weighted blend of 9 inputs, each scored 0–100. Each bar is that input's sub-score; the figure is the points it added to the 100-point composite (weight × sub-score).
- Cash flow +20.2/30.0
- ARV discount +15.0/15.0
- DSCR +6.4/10.0
- 1% rule +5.4/10.0
- Appreciation +5.0/10.0
- Schools +3.4/10.0
- Livability +3.0/5.0
- Condition / age +2.8/5.0
- Rent growth +2.5/5.0
$119,999
🖨 Deal sheet 📄 Offer letter ✓ Due diligence
Listing remarks MLS
JUST REDUCED!!! Escape to this delightful 3-bed, 2-bath home in a serene neighborhood. Updates throughout the interior and a spacious kitchen island create a warm ambiance. Relax by fishing in your backyard or nearby lakes. Community perks include a pool, center, and river access. Ideal for those craving a peaceful lifestyle with outdoor leisure options.
Key facts
- Community pool
- River access
- 0.24 acre lot
Tags
Neighborhood map
What this means for you Summary
Snapshot
- This is a 3-bed/2.0-bath single-family listed at $120k. Condition is rated average.
Deal economics
- At list price, monthly cash flow is $152 ($2k/yr) — positive.
- The deal already cash-flows at list — no discount required.
- Meets the 1% rule at list price ($1k rent vs $120k).
- Recommended offer: $106k (12.0% below list) — sets the bar for market timing.
- Cap rate 7.8% vs local median 3.8% in Goodrich — top-decile yield for the area; either an underpriced asset or a hidden risk that comps aren't pricing in. Stress-test before assuming the spread holds.
Location & tenants
- Location reads 60/100 on livability (#1,053 in TX) — a middle-class / working-renter tenant base. Strengths: cost of living A+, housing A+; Watch: employment C-, schools D+, crime F.
- Goodrich ISD (rural): math 45% / reading 30% proficiency, ranked #849 of 1,141 in TX (top 74%) — families likely to look elsewhere, expect single-tenant / working-renter base with shorter leases; 74% free/reduced lunch — lower-income household profile, screen leases tightly.
- Market conditions: 34 active listings in the ZIP; 769 units permitted in Polk County in 2024 (0 in 5+ unit buildings).
Forward outlook
- In year one you build about $4k of equity ($829 loan paydown + $4k appreciation (3.0% local appreciation)).
- Polk County population projected at +16% by 2050 — long-run rental-demand tailwind backs the buy-and-hold thesis.
- At projected returns (3.0% appreciation + 3.0% rent growth), your $34k cash investment doubles in ~5 years — after that, you're playing with house money.
- By year 8, paydown + projected appreciation supports a ~$33k cash-out refi (75% LTV) — recoverable capital for the next deal without selling this one.
Negotiation context
- It's been on market 217 days — a 12% lower offer ($106k) is reasonable based on typical stale-listing flexibility.
- 4 sale attempts since 2y ago; this cycle's ask has dropped $10k (8%) from the opening price — seller is motivated, your offer sets the floor, not the list.
Questions for the listing agent
- It's been on market 217 days. Have you received any prior offers? Is the seller open to a 12% concession, seller financing, or rate buy-down credit?
- What does the HOA fee cover, when was the last increase, and are there any pending special assessments or reserve-fund shortfalls?
- Why hasn't it sold? Are there any deal-killer items the seller is aware of (foundation, flood, title, zoning, code violations)?
- Is there a deadline driving the sale (1031 exchange, divorce, estate, relocation)? That informs how much negotiation room exists.
- Schools are D-rated, which usually means shorter tenancies and higher turnover. Who's the typical renter profile here, and what's been the actual vacancy rate?
- Crime grade is F in this area — have there been break-ins, vandalism, or insurance claims at this property in the last 3 years? What carrier currently insures it and at what premium?
- What's the average days-on-market for RENTAL listings here right now (not sales)? A rising rental-DOM trend means longer vacancies and softer asking-rent achievability than the comps imply.
- What's the recent tenant-quality profile in this submarket — average credit score on applications, eviction rate, late-payment / NSF rate, and stable-employment percentage? A property-management company in the area should have these aggregated.
- How much new for-sale + rental construction is in the pipeline within 1–3 miles? Heavy new supply typically softens prices + rents 12–24 months out; constrained supply supports both.
Investment metrics
- 1% rule
- 1.04% ✓
- Cap rate
- 7.81%
- Cash-on-cash
- 5.42%
- DSCR
- 1.24
- GRM
- 8.0
CMA / ARV
- ARV (median comp)
- $154,900
- List price
- $119,999
- Delta
- -22.53%
- Verdict
- UNDERPRICED
- Comps
- 1 within 2.0 mi
Show comp detail 5 sales within ~0.75 mi
| Address | Dist | Beds/Ba | Sqft | Sold | Price | $/sf | Match |
|---|---|---|---|---|---|---|---|
| 319 River Rd | 0.10mi | 2/2.0 (-1) | 1,509 (+8%) | 4mo | $149,000 | $99 | 74 |
| 270 John Ln Ln | 0.32mi | 3/2.0 | 1,456 (+4%) | 13mo | $175,000 | $120 | 68 |
| 238 Lakeside Ct | 0.21mi | 2/1.5 (-1) | 1,260 (-10%) | 17mo | $230,000 | $183 | 52 |
| 238 Ridgewood Rd | 0.67mi | 2/2.0 (-1) | 1,468 (+5%) | 12mo | $129,000 | $88 | 46 |
| 411 County Rd | 0.57mi | 2/2.0 (-1) | 1,204 (-14%) | 12mo | $260,000 | $216 | 35 |
Match score weights: distance 35% · size 25% · config 20% · recency 20%. Top-matched comps best support the ARV.
Projected returns pro-forma
3.0% appreciation · 3.0% rent growth · sell at horizon
- IRR
- 12.6%
- Equity multiple
- 1.72×
- Total profit
- $24,143
- Equity at exit
- $53,957
- IRR
- 14.6%
- Equity multiple
- 3.16×
- Total profit
- $72,444
- Equity at exit
- $83,154
Cash invested: $33,600 (down + closing). Projections, not guarantees.
Landlord ↔ Tenant lean methodology
- Overall (STATE)
- 87 Strongly Landlord-Friendly
- State Texas
- 87 Strongly Landlord-Friendly · R+5
- County
- — inherits STATE
- City
- — inherits STATE
ZIP-level market 77335
- Active inventory
- 34
- Price-to-rent
- 8.0×
Monthly cashflow live
- Estimated rent
- $1,243 medium interval (Pro) →
- Mortgage (P&I)
- −$629
- Tax est. 1.5%
- −$150 /mo · $1,800/yr
- Insurance
- −$50
- HOA
- −$1
- Vacancy / Maint / Mgmt
- −$261
- Net cashflow
- $152
Break-even live
UW: 25.0% down · 7.5% · 30yr · 1.5% tax · 5.0% vac · 8.0% maint · 8.0% mgmt
Financing live
Cash to close
- Down payment
- $30,000
- Closing costs
- $3,600
- Reserves months
- —
- Total cash needed
- —
Loan-product check · same deal, 3 products live
Conventional
25% down · 7.5% · 30yr
- Down + closing
- —
- Monthly P&I
- —
- Monthly cashflow
- —
- DSCR
- —
- Eligible?
- —
Personal DTI + credit; lowest rate.
DSCR
20% down · 8.5% · 30yr
- Down + closing
- —
- Monthly P&I
- —
- Monthly cashflow
- —
- DSCR
- —
- Eligible?
- —
No personal income docs; deal must DSCR.
Hard money
10% down · 12.0% · 12mo
- Down + closing
- —
- Monthly P&I
- —
- Monthly cashflow
- —
- DSCR
- —
- Eligible?
- —
Short-term bridge; refi at stabilization.
HOA detail
- Monthly dues
- $1 · $12/yr
- Likely covers
- pool
Listing history 26 events
-
2026-06-18days on market $119,999 Active 217 DOM
-
2026-06-17days on market $119,999 Active 216 DOM
-
2026-06-16days on market $119,999 Active 215 DOM
-
2026-06-15days on market $119,999 Active 214 DOM
-
2026-06-14days on market $119,999 Active 212 DOM
-
2026-06-13days on market $119,999 Active 211 DOM
-
2026-06-10days on market $119,999 Active 209 DOM
-
2026-06-09days on market $119,999 Active 208 DOM
-
2026-06-08days on market $119,999 Active 207 DOM
-
2026-06-07days on market $119,999 Active 206 DOM
-
2026-06-03days on market $119,999 Active 202 DOM
-
2026-06-02days on market $119,999 Active 201 DOM
-
2026-06-01days on market $119,999 Active 200 DOM
-
2026-05-31days on market $119,999 Active 199 DOM
-
2026-05-31days on market $119,999 Active 198 DOM
-
2026-05-12price $119,999 356-char remark
Show marketing remark (356 chars)
JUST REDUCED!!! Escape to this delightful 3-bed, 2-bath home in a serene neighborhood. Updates throughout the interior and a spacious kitchen island create a warm ambiance. Relax by fishing in your backyard or nearby lakes. Community perks include a pool, center, and river access. Ideal for those craving a peaceful lifestyle with outdoor leisure options.
-
2026-04-09price $124,999 356-char remark
Show marketing remark (356 chars)
JUST REDUCED!!! Escape to this delightful 3-bed, 2-bath home in a serene neighborhood. Updates throughout the interior and a spacious kitchen island create a warm ambiance. Relax by fishing in your backyard or nearby lakes. Community perks include a pool, center, and river access. Ideal for those craving a peaceful lifestyle with outdoor leisure options.
-
2025-11-13$129,999 Active 356-char remark
Show marketing remark (356 chars)
JUST REDUCED!!! Escape to this delightful 3-bed, 2-bath home in a serene neighborhood. Updates throughout the interior and a spacious kitchen island create a warm ambiance. Relax by fishing in your backyard or nearby lakes. Community perks include a pool, center, and river access. Ideal for those craving a peaceful lifestyle with outdoor leisure options.
-
2025-07-05historical
-
2025-06-23$130,000 Active
-
2025-06-19historical
-
2025-04-10price $145,000
-
2025-02-02price $150,000
-
2025-01-21$159,900 Active
-
2024-11-10historical
-
2024-06-11$159,900 Active
ⓘ Source: listings_history table (triggers on properties + properties_extension) + one-shot
backfill from property_details.listing_events for pre-trigger history.
Nearby sold comps map
Loading sold comps map…
Walkable amenities ~0.75 mi
Loading nearby amenities…
Taxation est. · year 1
- Rental income
- $14,918
- − Mortgage interest
- −$6,722
- − Property taxes
- −$1,800
- − Insurance
- −$600
- − Repairs & maintenance
- −$1,193
- − Management
- −$1,193
- − HOA
- −$12
- − Depreciation
- −$3,491
- Taxable loss
- −$94
- Est. tax savings @ 24.0%
- +$22
- After-tax cash flow
- $1,844/yr
For passive investors: Depreciation is non-cash, so a rental often shows a tax loss while cash-flowing — sheltering income. Rental losses are passive: they offset passive income freely, and up to $25,000/yr can offset ordinary (W-2) income if you actively participate and your MAGI is under $100k (phasing out to $0 by $150k); unused losses carry forward. On sale, claimed depreciation is recaptured at up to 25%, and gains may owe capital-gains tax (a 1031 exchange can defer both). Figures are a year-1 estimate at your 24.0% rate — not tax advice; consult a CPA.
Condition & rehab AI · 12 photos
This home is in average condition with cosmetic repairs needed. It offers a good starting point for an investor looking to make updates for a better return.
Repairs flagged
- Minor Kitchen cabinets — Worn appearance
- Minor Bathroom fixtures — Signs of wear
- Minor Carpeted floors — Worn appearance
- Minor Wallpaper — Signs of wear
Value-add opportunities
- Both Paint interior walls — Fresh paint enhances curb appeal and interior aesthetics
- Both Replace worn carpet — New carpet improves comfort and appearance
- Both Replace worn kitchen cabinets — New cabinets improve functionality and aesthetics
- Both Replace worn bathroom fixtures — New fixtures improve functionality and aesthetics
Renovation cost estimate screening
| Repair item | Severity | Est. cost |
|---|---|---|
| Kitchen cabinets · Worn appearance | Minor | $500–3,000 |
| Bathroom fixtures · Signs of wear | Minor | $500–3,000 |
| Carpeted floors · Worn appearance | Minor | $500–3,000 |
| Wallpaper · Signs of wear | Minor | $500–3,000 |
| Total estimated repair cost · 4 items | $2,000–12,000 |
Value-add ROI direction
- Both Paint interior walls — Fresh paint enhances curb appeal and interior aesthetics ↑
- Both Replace worn carpet — New carpet improves comfort and appearance ↑
- Both Replace worn kitchen cabinets — New cabinets improve functionality and aesthetics ↑
- Both Replace worn bathroom fixtures — New fixtures improve functionality and aesthetics ↑
ⓘ Cost ranges are severity-bucket heuristics (US national rule-of-thumb). Get contractor quotes + a written scope before underwriting a rehab budget.
Schools (NCES district)
- District
- Goodrich ISD
- NCES district ID
- 4821090
- Math proficiency
- 45% ▲ 15.00%
- Reading proficiency
- 30% ▲ 5.00%
- Median HH income
- $35,220
- Composite
- 33.57/100
- National rank
- #10494
- State rank
- #849 of 1141 in TX
Livability — Goodrich
- Score
- 60/100
- State rank
- #1053
- US rank
- #18692
Category grades
Schools grade is shown separately in the Schools card above.
Census & demographics
- Population (ZIP)
- 2,945
Population outlook (Polk County) Hauer SSP2
- Today (2025)
- 51,049 people
- By 2030
- 53,243 · +4.3%
- By 2040
- 56,528 · +10.7%
- By 2050
- 59,243 · +16.1%
- By 2075
- 63,528 · +24.4%
- By 2100
- 60,376 · +18.3%
Race, ethnicity, and origin ACS 2023
- Neighborhood character
- Predominantly White (71%)
- Race & ethnicity
- White 71% Hispanic / Latino 23% Two or more races 16% Black 5%
- Hispanic origin (detail)
- Mexican 21%
- Common ancestry
- Lithuanian 3% Slovak 2% Iranian 2%
- Foreign-born
- 2% · Canada
- Languages at home
- 85% English-only · Spanish 15%
Political lean MEDSL · Polk
- 2024 margin
- Solid R (+58.9) · D 20.2% · R 79.1%
- 2008→2024 swing
- -21.7pp toward R · 2008: -37.2pp · 2024: -58.9pp
- All cycles
- 2024: R+58.9 2020: R+54.5 2016: R+56.5 2012: R+48.2 2008: R+37.2
Not yet ingested
- Civics
- —
Market trends
- HPI YoY
- —
- Current HPI
- —
- Rent YoY
- —
- Metro
- —
- State GDP YoY
- ▲ 3.95%
- F500 in state
- 110
Industry mix (Fortune 500 HQ in TX)
| Industry | F500 HQs | Revenue |
|---|---|---|
| Energy | 16 | $1,198B |
|
||
| Technology | 5 | $198B |
|
||
| Engineering / Construction | 4 | $72B |
|
||
| Energy Services | 3 | $60B |
|
||
| Utilities | 3 | $41B |
|
||
| Healthcare | 2 | $330B |
|
||
Price history
-25.0% since first listed11 events — show timeline
- 2026-05-12 Price Changed $119,999 HARMLS
- 2026-04-09 Price Changed $124,999 HARMLS
- 2025-11-13 Listed $129,999 HARMLS
- 2025-07-05 Listing Removed — HARMLS
- 2025-06-23 Listed $130,000 HARMLS
- 2025-06-19 Listing Removed — HARMLS
- 2025-04-10 Price Changed $145,000 HARMLS
- 2025-02-02 Price Changed $150,000 HARMLS
- 2025-01-21 Listed $159,900 HARMLS
- 2024-11-10 Listing Removed — HARMLS
- 2024-06-11 Listed $159,900 HARMLS
Cash-flow waterfall
monthlySold comps — $/sqft
last 12 mo · ≤1 miLoading sold comps…