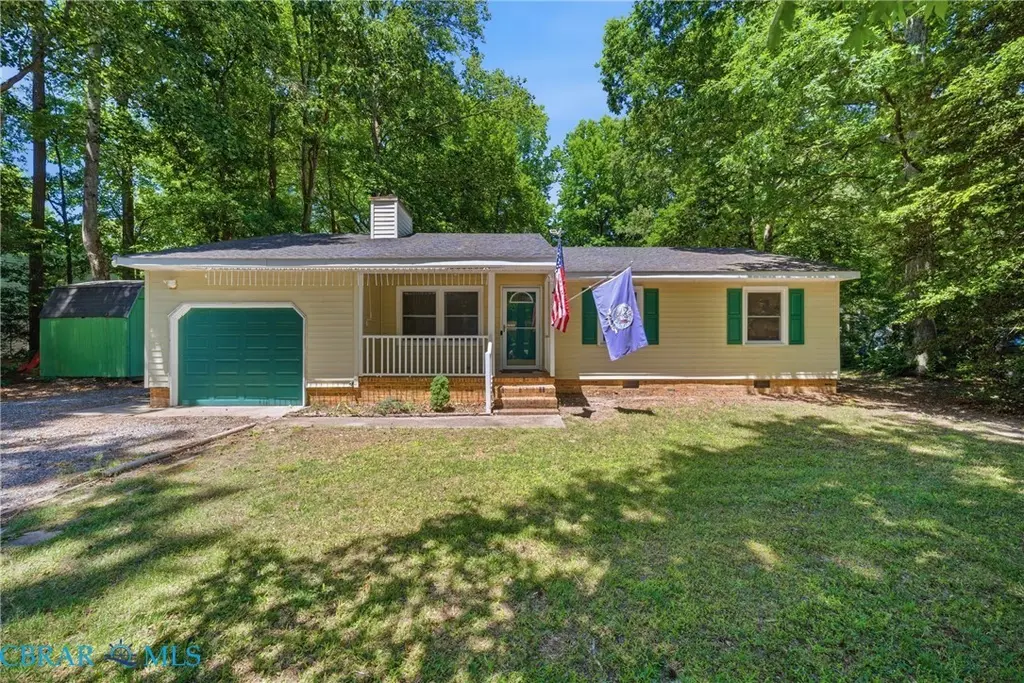
7133 Lord Carrington Dr · Gloucester Courthouse, VA
Flood risk 1/10 · Minimal
- FEMA flood zone
- X (unshaded)
- Chance of flooding over 30 yrs
- 0.0%
- Est. flood insurance / yr
- $507 – $1,088
Fire risk 4/10 · Minor
- Est. fire insurance / yr
- $666 – $1,236
Heat risk 9/10 · Severe
- Hot days now (above 105°F)
- 7 days/yr
- Hot days in 30 yrs
- 17 days/yr
Wind risk 8/10 · Major
- Chance of severe wind over 30 yrs
- 80.0%
Air-quality risk 2/10 · Minimal
- Unhealthy air days now
- 1 days/yr
- Unhealthy air days in 30 yrs
- 1 days/yr
Risk factors via First Street. Map © Google.
Why this score? — see what drove the D- grade
The composite is a weighted blend of 9 inputs, each scored 0–100. Each bar is that input's sub-score; the figure is the points it added to the 100-point composite (weight × sub-score).
- Cash flow +12.9/30.0
- ARV discount +5.9/15.0
- Schools +5.6/10.0
- DSCR +3.8/10.0
- Livability +3.7/5.0
- 1% rule +2.5/10.0
- Rent growth +2.5/5.0
- Condition / age +2.5/5.0
- Appreciation +0.0/10.0
$305,000
🖨 Deal sheet (PDF) 📄 Offer letter ✓ Due diligence
Listing remarks MLS
Welcome to this cute rancher located in the desirable Founders Mill subdivision! This charming home offers 3 bedrooms, 2 full baths, and 1,218 square feet of comfortable living space. Enjoy relaxing on the inviting front porch or entertaining on the back deck. Inside, you'll love the warm character of the beamed ceilings and the beautifully updated kitchen. This home offers a great layout, cozy charm, and a convenient location close to town, shopping, dining, and local amenities. A wonderful opportunity for anyone looking for comfort, style, and convenience all in one!
Key facts
- Beamed ceilings
- Front porch
- Back deck
Tags
Property features AI
Finance
- HOA & community: No HOA
Exterior
- Parking: Attached 1-car garage
- Utilities: Septic sewer; Well water; Electric water heater; Electric power
- Home design: Detached ranch; One story; Crawl foundation
- Construction: Vinyl siding; Composite roof
- Exterior features: Cul-de-sac lot; Deck; Well
Interior
- Kitchen: Dishwasher; Microwave; Electric range; Refrigerator; Pantry
- Bedrooms: Master bedroom with bath; Bedroom and full bathroom on 1st floor
- Flooring: Laminate; Vinyl
- Bathrooms: 2 full bathrooms
- Heating & cooling: Heat pump; Electric heating; Central air
- Interior features: Cathedral ceiling; Fireplace (wood); Cable hookup; Ceiling fan
- Laundry & utility: Washer; Dryer; Washer hookup; Dryer hookup; Utility closet
Neighborhood map
What this means for you Summary
Snapshot
- This is a 3-bed/2.0-bath single-family listed at $305k.
Deal economics
- At list price, monthly cash flow is $-25 ($-295/yr) — negative.
- To cash-flow at today's rent, offer at most $301k (1.4% below list).
- To meet the 1% rule (rent ≥ 1% of price), the offer needs to be $230k (24.7% below list).
- Recommended offer: $230k (24.7% below list) — sets the bar for 1% rule.
- Cap rate 6.2% vs local median 3.4% in Gloucester Courthouse — top-decile yield for the area; either an underpriced asset or a hidden risk that comps aren't pricing in. Stress-test before assuming the spread holds.
Location & tenants
- Location reads 74/100 on livability (#150 in VA, #4,823 nationally) — a middle-class / working-renter tenant base. Strengths: crime A+, health & safety A+, housing A-; Watch: amenities F, commute F.
- Gloucester County Public School District (rural): math 57% / reading 73% proficiency, ranked #37 of 131 in VA (top 28%) — acceptable for families but not a draw, mixed tenant base, ~2y average lease.
- Zoned schools: Botetourt Elementary (math 66% / reading 73%, grade A-, #313 of 1,108 statewide, top 32%, 546 students, 47% FRL); Gloucester High (math 58% / reading 86%, grade B+, #134 of 319 statewide, top 45%, 1,531 students, 39% FRL).
- Market conditions: 228 active listings in the ZIP; 85 units permitted in Gloucester County in 2024 (0 in 5+ unit buildings).
Forward outlook
- Local home prices are declining (-3.0%/yr); year-one equity from $2k of loan paydown is wiped out by about $9k of value loss. Plan a longer hold.
- Gloucester County population projected to shrink 9% by 2050 — rents likely to lag national; underwrite the cash flow, not the appreciation.
Negotiation context
- Only 4 days on market — expect competitive offers; lowballing is unlikely to land.
- 2 sale attempts with the ask held roughly flat each time — persistent listings suggest the price (not the market) is what's stuck; bring a comps-based counter.
- Current owner paid $75k; list at $305k implies a 307% gain — meaningful room to come down on a strong offer.
Risks & watch-outs
- Climate carrying-cost: severe wind risk, 80% chance of damaging wind over 30y; extreme-heat days projected 7→17/yr by 2055 (HVAC capex compounding) — expect insurance premiums to compound above CPI over the hold.
Questions for the listing agent
- What do current leases actually rent for vs. the listed asking? Can we see a recent rent roll and the last 12 months of T-12 income?
- Is there a deadline driving the sale (1031 exchange, divorce, estate, relocation)? That informs how much negotiation room exists.
- Schools are A-rated — typically a magnet for longer-tenancy family renters. What's the average tenant stay here, and is there a school-zone premium baked into asking?
- The area grade is low — what's the realistic commute time and amenity access for the typical tenant pool here? Any planned neighborhood developments (good or bad) we should know about?
- What's the average days-on-market for RENTAL listings here right now (not sales)? A rising rental-DOM trend means longer vacancies and softer asking-rent achievability than the comps imply.
- What's the recent tenant-quality profile in this submarket — average credit score on applications, eviction rate, late-payment / NSF rate, and stable-employment percentage? A property-management company in the area should have these aggregated.
- How much new for-sale + rental construction is in the pipeline within 1–3 miles? Heavy new supply typically softens prices + rents 12–24 months out; constrained supply supports both.
Investment metrics
- 1% rule
- 0.75% ✗
- Cap rate
- 6.20%
- Cash-on-cash
- -0.35%
- DSCR
- 0.98
- GRM
- 11.1
CMA / ARV
- ARV (on-the-fly)
- $294,756
- Comps found
- 4
Show comp detail 4 sales within ~0.75 mi
| Address | Dist | Beds/Ba | Sqft | Sold | Price | $/sf | Match |
|---|---|---|---|---|---|---|---|
| 8205 Sheffield Dr | 0.29mi | 3/2.0 | 1,300 (+7%) | 3mo | $315,000 | $242 | 73 |
| 7177 Amherst Ln | 0.19mi | 3/2.0 | 1,302 (+7%) | 18mo | $278,900 | $214 | 65 |
| 8246 Sheffield Dr | 0.30mi | 3/2.0 | 1,304 (+7%) | 23mo | $310,000 | $238 | 55 |
| 7368 Founders Mill Way Unit E | 0.46mi | 3/2.0 | 1,344 (+10%) | 14mo | $353,500 | $263 | 50 |
Match score weights: distance 35% · size 25% · config 20% · recency 20%. Top-matched comps best support the ARV.
Projected returns pro-forma
-3.0% appreciation · 3.0% rent growth · sell at horizon
- IRR
- -16.9%
- Equity multiple
- 0.40×
- Total profit
- $-51,117
- Equity at exit
- $45,476
- IRR
- -8.9%
- Equity multiple
- 0.45×
- Total profit
- $-47,054
- Equity at exit
- $26,371
Cash invested: $85,400 (down + closing). Projections, not guarantees.
Landlord ↔ Tenant lean methodology
- Overall (STATE)
- 55 Moderately Landlord-Leaning
- State Virginia
- 55 Moderately Landlord-Leaning · D+2
- County
- — inherits STATE
- City
- — inherits STATE
ZIP-level market 23061
- Home prices YoY
- -32.4%
- Active inventory
- 228
- Price-to-rent
- 11.1×
Monthly cashflow live
- Estimated rent
- $2,297 medium interval (Pro) →
- Mortgage (P&I)
- −$1,599
- Tax from tax record
- −$113 /mo · $1,356/yr
- Insurance
- −$127
- HOA
- −$0
- Vacancy / Maint / Mgmt
- −$482
- Net cashflow
- $-25
Break-even live
Sensitivity live
| Price | -10% $148 | -5% $62 | +0% $-25 | +5% $-111 | +10% $-197 |
|---|---|---|---|---|---|
| Rent | -10% $-206 | -5% $-115 | +0% $-25 | +5% $66 | +10% $157 |
| Rate | -1.0pp $129 | -0.5pp $53 | base $-25 | +0.5pp $-104 | +1.0pp $-184 |
UW: 25.0% down · 7.5% · 30yr · 1.5% tax · 5.0% vac · 8.0% maint · 8.0% mgmt
Financing live
Cash to close
- Down payment
- $76,250
- Closing costs
- $9,150
- Reserves months
- —
- Total cash needed
- —
Loan-product check · same deal, 3 products live
Conventional
25% down · 7.5% · 30yr
- Down + closing
- —
- Monthly P&I
- —
- Monthly cashflow
- —
- DSCR
- —
- Eligible?
- —
Personal DTI + credit; lowest rate.
DSCR
20% down · 8.5% · 30yr
- Down + closing
- —
- Monthly P&I
- —
- Monthly cashflow
- —
- DSCR
- —
- Eligible?
- —
No personal income docs; deal must DSCR.
Hard money
10% down · 12.0% · 12mo
- Down + closing
- —
- Monthly P&I
- —
- Monthly cashflow
- —
- DSCR
- —
- Eligible?
- —
Short-term bridge; refi at stabilization.
Listing history 6 events
-
2026-06-12status $305,000 Under Contract 4 DOM
-
2026-06-09days on market $305,000 Active 4 DOM
-
2026-06-08days on market $305,000 Active 3 DOM
-
2026-06-08days on market $305,000 Active 2 DOM
-
2026-06-07remarks 575-char remark
-
2026-06-07$305,000 Active 1 DOM
ⓘ Source: listings_history table (triggers on properties + properties_extension) + one-shot
backfill from property_details.listing_events for pre-trigger history.
Tax reassessment forecast VA · Resets to sale price
- Current annual tax
- $1,356 · $113/mo
- Projected year-2 tax
- $2,501 · $208/mo
- Expected delta
- +$1,145/yr (+$95/mo · 84.4%)
ⓘ Screening estimate from a state-policy table — verify with the county assessor before closing.
Climate risk First Street
- Flood 1/10 Low FEMA zone X (unshaded) · 0% chance over 30 yrs
- Wildfire 4/10 Moderate
- Heat 9/10 Extreme 7 d/yr ≥105°F today · 17 d/yr by 30 yrs out
- Wind 8/10 Severe 80% chance of damaging wind over 30 yrs
- Air quality 2/10 Low 1 unhealthy d/yr today · 1 by 30 yrs out
Nearby sold comps map
Loading sold comps map…
Walkable amenities ~0.75 mi
Loading nearby amenities…
Taxation est. · year 1
- Rental income
- $27,569
- − Mortgage interest
- −$17,085
- − Property taxes
- −$1,356
- − Insurance
- −$1,525
- − Repairs & maintenance
- −$2,206
- − Management
- −$2,206
- − Depreciation
- −$8,873
- Taxable loss
- −$5,680
- Est. tax savings @ 24.0%
- +$1,363
- After-tax cash flow
- $1,069/yr
For passive investors: Depreciation is non-cash, so a rental often shows a tax loss while cash-flowing — sheltering income. Rental losses are passive: they offset passive income freely, and up to $25,000/yr can offset ordinary (W-2) income if you actively participate and your MAGI is under $100k (phasing out to $0 by $150k); unused losses carry forward. On sale, claimed depreciation is recaptured at up to 25%, and gains may owe capital-gains tax (a 1031 exchange can defer both). Figures are a year-1 estimate at your 24.0% rate — not tax advice; consult a CPA.
Schools (NCES district)
- District
- Gloucester County Public School District
- NCES district ID
- 5101620
- Math proficiency
- 57% ▼ -30.00%
- Reading proficiency
- 73% ▼ -8.00%
- Median HH income
- $60,815
- Composite
- 56.19/100
- National rank
- #1177
- State rank
- #37 of 131 in VA
Livability — Gloucester Courthouse
- Score
- 74/100
- State rank
- #150
- US rank
- #4823
Category grades
Schools grade is shown separately in the Schools card above.
Census & demographics
- City population
- 23,219
- Population (ZIP)
- 23,219
Population outlook (Gloucester County) Hauer SSP2
- Today (2025)
- 37,437 people
- By 2030
- 37,286 · -0.4%
- By 2040
- 36,224 · -3.2%
- By 2050
- 34,171 · -8.7%
- By 2075
- 30,472 · -18.6%
- By 2100
- 25,832 · -31.0%
Race, ethnicity, and origin ACS 2023
- Neighborhood character
- Predominantly White (85%)
- Race & ethnicity
- White 85% Black 7% Two or more races 5% Hispanic / Latino 4%
- Common ancestry
- Serbian 3% Lithuanian 2% Slovak 2%
- Foreign-born
- 1%
- Languages at home
- 98% English-only · Spanish 1%
Political lean MEDSL · Gloucester
- 2024 margin
- Solid R (+38.4) · D 30.4% · R 68.8%
- 2008→2024 swing
- -11.5pp toward R · 2008: -26.9pp · 2024: -38.4pp
- All cycles
- 2024: R+38.4 2020: R+35.5 2016: R+39.4 2012: R+27.9 2008: R+26.9
Not yet ingested
- Civics
- —
Market trends
- HPI YoY
- ▼ -83.96%
- Current HPI
- 175.0236
- Rent YoY
- —
- Metro
- —
- State GDP YoY
- ▲ 2.40%
- F500 in state
- 50
Industry mix (Fortune 500 HQ in VA)
| Industry | F500 HQs | Revenue |
|---|---|---|
| Aerospace / Defense | 4 | $236B |
|
||
| Technology / Defense | 3 | $32B |
|
||
| Financial Services | 2 | $176B |
|
||
| Utilities | 2 | $27B |
|
||
| Insurance | 2 | $25B |
|
||
| Technology | 2 | $15B |
|
||
Price history
+306.7% since first listed3 events — show timeline
- 2026-06-05 Listed $305,000 CBRAR
- 2026-06-05 Listed $305,000 REINMLS
- 1987-10-02 Sold (Public Records) $75,000 Public Records
Property tax history
+1.1%/yrLatest (2025): $1,356 · +5.3% YoY. Source: county tax records.
Cash-flow waterfall
monthlySold comps — $/sqft
last 12 mo · ≤1 miLoading sold comps…