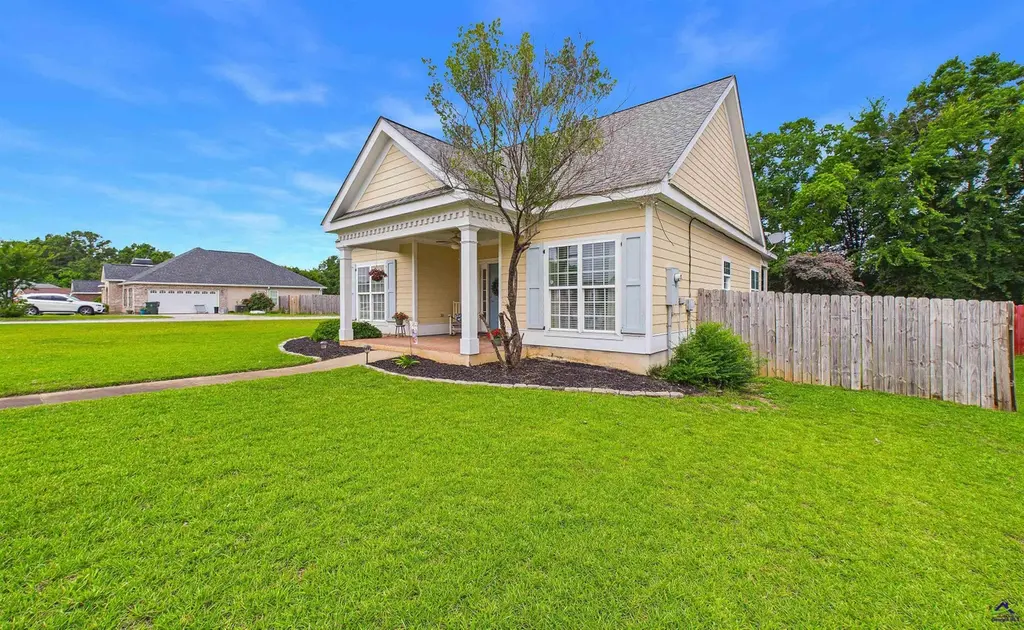
222 Gray Fox Crossing Xing · Warner Robins, GA
Flood risk 1/10 · Minimal
- FEMA flood zone
- X (unshaded)
- Chance of flooding over 30 yrs
- 0.0%
- Est. flood insurance / yr
- $507 – $1,088
Fire risk 4/10 · Minor
- Est. fire insurance / yr
- $963 – $1,789
Heat risk 7/10 · Major
- Hot days now (above 108°F)
- 7 days/yr
- Hot days in 30 yrs
- 18 days/yr
Wind risk 8/10 · Major
- Chance of severe wind over 30 yrs
- 80.0%
Air-quality risk 3/10 · Minor
- Unhealthy air days now
- 2 days/yr
- Unhealthy air days in 30 yrs
- 4 days/yr
Risk factors via First Street. Map © Google.
Why this score? — see what drove the D grade
The composite is a weighted blend of 9 inputs, each scored 0–100. Each bar is that input's sub-score; the figure is the points it added to the 100-point composite (weight × sub-score).
- Cash flow +13.3/30.0
- ARV discount +8.1/15.0
- DSCR +4.0/10.0
- Schools +3.9/10.0
- Rent growth +3.6/5.0
- Livability +3.2/5.0
- 1% rule +3.0/10.0
- Condition / age +2.5/5.0
- Appreciation +0.0/10.0
$238,900
🖨 Deal sheet (PDF) 📄 Offer letter ✓ Due diligence
Listing remarks MLS
NO CARPET....Great house on a corner lot. Per seller New Roof in 2020! Full yard sprinkler, side entry garage, stainless appliances, wood laminate flooring, tile flooring in wet areas, granite counters in kitchen/tile backsplash, separate laundry room.
Key facts
- Corner-lot property
- Cement fiber siding
- Granite countertops
Tags
Property features AI
Finance
- Other: Located in the Bridlewood subdivision
Exterior
- Parking: Attached garage (1 covered parking space, 1 total garage space)
- Utilities: Public water; Public sewer; Cable connected; Underground utilities
- Home design: Single-family residence; One level
- Construction: Fiber cement exterior; Slab foundation; Built with above-grade finished living area
- Exterior features: Covered porch; Fenced yard
Interior
- Kitchen: Electric range; Dishwasher; Disposal; Microwave
- Flooring: Tile; Hardwood
- Bathrooms: 2 full bathrooms
- Heating & cooling: Central heating; Heat pump; Central air conditioning
- Interior features: Ceiling fans; Storage; Blinds
Neighborhood map
What this means for you Summary
Snapshot
- This is a 3-bed/2.0-bath single-family listed at $239k.
Deal economics
- At list price, monthly cash flow is $0 ($-1/yr) — negative.
- To cash-flow at today's rent, offer at most $239k (0.0% below list).
- To meet the 1% rule (rent ≥ 1% of price), the offer needs to be $191k (19.9% below list).
- Recommended offer: $191k (19.9% below list) — sets the bar for 1% rule.
- Cap rate 6.3% vs local median 4.9% in Warner Robins — meaningfully above typical; check what's discounted (condition, days-on-market, listing class) to confirm the premium yield is real.
Location & tenants
- Location reads 65/100 on livability (#227 in GA) — a middle-class / working-renter tenant base. Strengths: cost of living A+, housing A+, health & safety A+; Watch: employment D+, crime F, amenities F.
- Houston County (urban): math 43% / reading 46% proficiency, ranked #23 of 174 in GA (top 13%) — families likely to look elsewhere, expect single-tenant / working-renter base with shorter leases.
- Zoned schools: Hilltop Elementary School (math 55% / reading 59%, grade C+, #151 of 1,228 statewide, top 13%, 600 students, 48% FRL); Huntington Middle School (math 23% / reading 32%, grade F, #268 of 470 statewide, top 57%, 827 students, 84% FRL); Veterans High School (math 33% / reading 32%, grade F, #104 of 424 statewide, top 25%, 1,914 students, 30% FRL).
- Market conditions: Rents rising fast (+4.5%/yr); 240 active listings in the ZIP; 21 comparable units currently listed for rent nearby; rentals at typical pace (median 23d on market — plan ~3-4 weeks tenant-placement turnaround); 48% of comp listings sitting > 30 days — soft ceiling on asking rent; high-income renter base; 1,545 units permitted in Houston County in 2024 (336 in 5+ unit buildings).
Forward outlook
- Local home prices are declining (-3.0%/yr); year-one equity from $2k of loan paydown is wiped out by about $7k of value loss. Plan a longer hold.
- Houston County population projected at +22% by 2050 — long-run rental-demand tailwind backs the buy-and-hold thesis.
Negotiation context
- Only 9 days on market — expect competitive offers; lowballing is unlikely to land.
- 5 sale attempts since 8y ago with the ask held roughly flat each time — persistent listings suggest the price (not the market) is what's stuck; bring a comps-based counter.
- Current owner paid $206k; 16% above their basis — modest negotiation headroom, anchor on the comps not their cost.
Risks & watch-outs
- Climate carrying-cost: severe wind risk, 80% chance of damaging wind over 30y; extreme-heat days projected 7→18/yr by 2055 (HVAC capex compounding) — expect insurance premiums to compound above CPI over the hold.
Questions for the listing agent
- What do current leases actually rent for vs. the listed asking? Can we see a recent rent roll and the last 12 months of T-12 income?
- Is there a deadline driving the sale (1031 exchange, divorce, estate, relocation)? That informs how much negotiation room exists.
- Schools are D-rated, which usually means shorter tenancies and higher turnover. Who's the typical renter profile here, and what's been the actual vacancy rate?
- Crime grade is F in this area — have there been break-ins, vandalism, or insurance claims at this property in the last 3 years? What carrier currently insures it and at what premium?
- The area grade is low — what's the realistic commute time and amenity access for the typical tenant pool here? Any planned neighborhood developments (good or bad) we should know about?
- What's the average days-on-market for RENTAL listings here right now (not sales)? A rising rental-DOM trend means longer vacancies and softer asking-rent achievability than the comps imply.
- What's the recent tenant-quality profile in this submarket — average credit score on applications, eviction rate, late-payment / NSF rate, and stable-employment percentage? A property-management company in the area should have these aggregated.
- How much new for-sale + rental construction is in the pipeline within 1–3 miles? Heavy new supply typically softens prices + rents 12–24 months out; constrained supply supports both.
Investment metrics
- 1% rule
- 0.80% ✗
- Cap rate
- 6.29%
- Cash-on-cash
- -0.00%
- DSCR
- 1.00
- GRM
- 10.4
CMA / ARV
- ARV (on-the-fly)
- $242,088
- Comps found
- 12
Show comp detail 12 sales within ~0.75 mi
| Address | Dist | Beds/Ba | Sqft | Sold | Price | $/sf | Match |
|---|---|---|---|---|---|---|---|
| 220 Gray Fox Xing | 0.01mi | 3/2.0 | 1,548 (-2%) | 0mo | $239,900 | $155 | 96 |
| 407 Gray Fox Xing | 0.17mi | 3/2.0 | 1,571 (-0%) | 2mo | $237,500 | $151 | 90 |
| 117 Fieldwalk Chase | 0.35mi | 3/2.0 | 1,560 (-1%) | 3mo | $170,000 | $109 | 80 |
| 102 Brookhaven Dr | 0.35mi | 3/2.0 | 1,590 (+1%) | 5mo | $215,000 | $135 | 77 |
| 303 Gray Fox Xing | 0.06mi | 3/2.0 | 1,415 (-10%) | 6mo | $219,500 | $155 | 76 |
| 113 Gray Fox Xing | 0.13mi | 4/2.0 (+1) | 1,717 (+9%) | 2mo | $270,000 | $157 | 72 |
| 111 Turtle Creek Dr | 0.70mi | 3/2.0 | 1,542 (-2%) | 2mo | $230,000 | $149 | 62 |
| 212 Wynfield Ln | 0.41mi | 3/2.0 | 1,396 (-11%) | 2mo | $215,000 | $154 | 61 |
| 101 Buckskin Dr | 0.66mi | 3/2.0 | 1,476 (-6%) | 1mo | $155,000 | $105 | 58 |
| 306 Thornwood Dr | 0.44mi | 4/2.5 (+1) | 1,775 (+13%) | 5mo | $255,000 | $144 | 47 |
| 308 Peach Blossom Rd | 0.68mi | 3/2.0 | 1,388 (-12%) | 4mo | $237,000 | $171 | 45 |
| 107 Billington Ct | 0.73mi | 3/2.0 | 1,377 (-12%) | 0mo | $245,000 | $178 | 45 |
Match score weights: distance 35% · size 25% · config 20% · recency 20%. Top-matched comps best support the ARV.
Projected returns pro-forma
-3.0% appreciation · 4.53% rent growth · sell at horizon
- IRR
- -14.8%
- Equity multiple
- 0.47×
- Total profit
- $-35,781
- Equity at exit
- $35,621
- IRR
- -4.0%
- Equity multiple
- 0.72×
- Total profit
- $-18,729
- Equity at exit
- $20,656
Cash invested: $66,892 (down + closing). Projections, not guarantees.
Landlord ↔ Tenant lean methodology
- Overall (STATE)
- 90 Strongly Landlord-Friendly
- State Georgia
- 90 Strongly Landlord-Friendly · R+3
- County
- — inherits STATE
- City
- — inherits STATE
ZIP-level market 31005
- Home prices YoY
- -17.1%
- Rents YoY
- 4.5%
- Active inventory
- 240
- Price-to-rent
- 10.4×
Monthly cashflow live
- Estimated rent
- $1,914 high interval (Pro) →
- Mortgage (P&I)
- −$1,253
- Tax from tax record
- −$160 /mo · $1,915/yr
- Insurance
- −$100
- HOA
- −$0
- Vacancy / Maint / Mgmt
- −$402
- Net cashflow
- $-0
Break-even live
Sensitivity live
| Price | -10% $135 | -5% $68 | +0% $0 | +5% $-68 | +10% $-135 |
|---|---|---|---|---|---|
| Rent | -10% $-151 | -5% $-76 | +0% $0 | +5% $76 | +10% $151 |
| Rate | -1.0pp $120 | -0.5pp $61 | base $0 | +0.5pp $-62 | +1.0pp $-125 |
UW: 25.0% down · 7.5% · 30yr · 1.5% tax · 5.0% vac · 8.0% maint · 8.0% mgmt
Financing live
Cash to close
- Down payment
- $59,725
- Closing costs
- $7,167
- Reserves months
- —
- Total cash needed
- —
Loan-product check · same deal, 3 products live
Conventional
25% down · 7.5% · 30yr
- Down + closing
- —
- Monthly P&I
- —
- Monthly cashflow
- —
- DSCR
- —
- Eligible?
- —
Personal DTI + credit; lowest rate.
DSCR
20% down · 8.5% · 30yr
- Down + closing
- —
- Monthly P&I
- —
- Monthly cashflow
- —
- DSCR
- —
- Eligible?
- —
No personal income docs; deal must DSCR.
Hard money
10% down · 12.0% · 12mo
- Down + closing
- —
- Monthly P&I
- —
- Monthly cashflow
- —
- DSCR
- —
- Eligible?
- —
Short-term bridge; refi at stabilization.
Rent comps 21 comps
| Address | Beds | Baths | Sqft | Rent | $/sqft | DOM | Units | Dist |
|---|---|---|---|---|---|---|---|---|
| 210 Strawbridge Ln Bonaire, GA | 3.0 | 2.0 | 1214 | $1,600 | $1.32 | 23d | 1 | 0.14mi |
| 113 Gray Fox Xing Bonaire, GA | 4.0 | 2.0 | 1717 | $2,200 | $1.28 | 23d | 1 | 0.16mi |
| 100 Strawbridge Ln Bonaire, GA | 3.0 | 2.0 | 1248 | $1,600 | $1.28 | 23d | 1 | 0.24mi |
| 100 Strawbridge Ln Bonaire, GA | 3.0 | 2.0 | 1248 | $1,600 | $1.28 | 45d | 1 | 0.24mi |
| 120 Chadwyck Cir Bonaire, GA | 3.0 | 2.0 | 1266 | $1,650 | $1.30 | 23d | 1 | 0.38mi |
| 627 Maplewood Dr Bonaire, GA | 3.0 | 2.0 | 1080 | $975 | $0.90 | 23d | 1 | 0.44mi |
| 642 Maplewood Dr Bonaire, GA | 3.0 | 2.0 | 1100 | $1,400 | $1.27 | 45d | 1 | 0.50mi |
| 102 Duxbury Ct Bonaire, GA | 3.0 | 2.0 | 1725 | $1,975 | $1.14 | 23d | 1 | 0.96mi |
| 106 Leisure Pointe Cv Warner Robins, GA | 4.0 | 2.5 | 1682 | $1,950 | $1.16 | 15d | 1 | 1.07mi |
| 106 Leisure Pointe Cv Warner Robins, GA | 4.0 | 2.5 | 1682 | $2,000 | $1.19 | 45d | 1 | 1.07mi |
| 109 Leisure Pointe Cv Warner Robins, GA | 4.0 | 2.5 | 1682 | $1,925 | $1.14 | 45d | 1 | 1.08mi |
| 800 Leisure Lake Dr Warner Robins, GA | 1.0–2.0 | 1.0–2.0 | 950 | $1,365 | $1.44 | 15d | 34 | 1.19mi |
| 101 Webster Way Warner Robins, GA | 3.0 | 2.0 | 1320 | $1,650 | $1.25 | 45d | 1 | 1.22mi |
| 116 Webster Way Warner Robins, GA | 2.0 | 2.0 | 1320 | $1,650 | $1.25 | 45d | 1 | 1.23mi |
| 108 Crossfield Dr Warner Robins, GA | 3.0 | 2.0 | 1548 | $1,795 | $1.16 | 23d | 1 | 1.30mi |
| 203 Bryson Way Warner Robins, GA | 3.0 | 2.0 | 1858 | $1,850 | $1.00 | 45d | 1 | 1.35mi |
| 106 Lions Gate Bonaire, GA | 3.0 | 2.0 | 1159 | $1,600 | $1.38 | 45d | 1 | 1.44mi |
| 40 Cohen Walker Dr Bonaire, GA | 1.0–2.0 | 1.0–2.0 | 905 | $1,900 | $2.10 | 15d | 1 | 1.45mi |
| 309 Raleigh Dr Warner Robins, GA | 4.0 | 2.5 | 1984 | $4,995 | $2.52 | 45d | 1 | 1.45mi |
| 309 Raleigh Dr Warner Robins, GA | 4.0 | 3.0 | 1984 | $4,995 | $2.52 | 23d | 1 | 1.45mi |
| 104 Melissa Ln Warner Robins, GA | 3.0 | 2.0 | 1372 | $1,675 | $1.22 | 46d | 1 | 1.49mi |
Listing history 8 events
-
2026-06-07statusdays on market $238,900 Pending 9 DOM
-
2026-06-05days on market $238,900 Active 6 DOM
-
2026-06-03days on market $238,900 Active 5 DOM
-
2026-06-02days on market $238,900 Active 4 DOM
-
2026-06-01days on market $238,900 Active 3 DOM
-
2026-05-31days on market $238,900 Active 2 DOM
-
2026-05-30remarks 687-char remark
-
2026-05-30$238,900 Active 1 DOM
ⓘ Source: listings_history table (triggers on properties + properties_extension) + one-shot
backfill from property_details.listing_events for pre-trigger history.
Tax reassessment forecast GA · Resets to sale price
- Current annual tax
- $1,915 · $160/mo
- Projected year-2 tax
- $2,198 · $183/mo
- Expected delta
- +$283/yr (+$24/mo · 14.8%)
ⓘ Screening estimate from a state-policy table — verify with the county assessor before closing.
Climate risk First Street
- Flood 1/10 Low FEMA zone X (unshaded) · 0% chance over 30 yrs
- Wildfire 4/10 Moderate
- Heat 7/10 Severe 7 d/yr ≥108°F today · 18 d/yr by 30 yrs out
- Wind 8/10 Severe 80% chance of damaging wind over 30 yrs
- Air quality 3/10 Moderate 2 unhealthy d/yr today · 4 by 30 yrs out
Nearby sold comps map
Loading sold comps map…
Walkable amenities ~0.75 mi
Loading nearby amenities…
Taxation est. · year 1
- Rental income
- $22,966
- − Mortgage interest
- −$13,382
- − Property taxes
- −$1,915
- − Insurance
- −$1,194
- − Repairs & maintenance
- −$1,837
- − Management
- −$1,837
- − Depreciation
- −$6,950
- Taxable loss
- −$4,150
- Est. tax savings @ 24.0%
- +$996
- After-tax cash flow
- $995/yr
For passive investors: Depreciation is non-cash, so a rental often shows a tax loss while cash-flowing — sheltering income. Rental losses are passive: they offset passive income freely, and up to $25,000/yr can offset ordinary (W-2) income if you actively participate and your MAGI is under $100k (phasing out to $0 by $150k); unused losses carry forward. On sale, claimed depreciation is recaptured at up to 25%, and gains may owe capital-gains tax (a 1031 exchange can defer both). Figures are a year-1 estimate at your 24.0% rate — not tax advice; consult a CPA.
Schools (NCES district)
- District
- Houston County
- NCES district ID
- 1302880
- Math proficiency
- 43% ▼ -7.00%
- Reading proficiency
- 46% ▼ -2.00%
- Median HH income
- $54,823
- Composite
- 38.68/100
- National rank
- #4144
- State rank
- #23 of 174 in GA
Livability — Warner Robins
- Score
- 65/100
- State rank
- #227
- US rank
- #13290
Category grades
Schools grade is shown separately in the Schools card above.
Census & demographics
- Census place
- Warner Robins, GA
- County
- Houston County · 157,321 people
- City population
- 92,102
- Metro
- Warner Robins, GA
- Population (ZIP)
- 22,063
- Household income
- $110,461
- Rent vs Own
- Severe rent burden
- 212.0
Population outlook (Houston County) Hauer SSP2
- Today (2025)
- 169,502 people
- By 2030
- 178,486 · +5.3%
- By 2040
- 194,642 · +14.8%
- By 2050
- 207,119 · +22.2%
- By 2075
- 231,480 · +36.6%
- By 2100
- 235,034 · +38.7%
Race, ethnicity, and origin ACS 2023
- Neighborhood character
- Diverse neighborhood (Simpson 0.57)
- Race & ethnicity
- White 61% Black 23% Two or more races 11% Hispanic / Latino 8% Asian 1%
- Hispanic origin (detail)
- Mexican 3% Puerto Rican 1% Salvadoran 1%
- Common ancestry
- Italian 3% Lithuanian 2% Serbian 1%
- Foreign-born
- 5% · Canada
- Languages at home
- 96% English-only · Spanish 2% French/Haitian/Cajun 1% German/W. Germanic 1%
Political lean MEDSL · Houston
- 2024 margin
- R (+11.3) · D 44.0% · R 55.3%
- 2008→2024 swing
- +8.9pp toward D · 2008: -20.2pp · 2024: -11.3pp
- All cycles
- 2024: R+11.3 2020: R+12.4 2016: R+21.6 2012: R+20.7 2008: R+20.2
Not yet ingested
- Civics
- —
Market trends
- HPI YoY
- ▼ -43.85%
- Current HPI
- 213.0605
- Rent YoY
- ▲ 4.53%
- Metro
- Warner Robins, GA
- State GDP YoY
- ▲ 2.66%
- F500 in state
- 28
Industry mix (Fortune 500 HQ in GA)
| Industry | F500 HQs | Revenue |
|---|---|---|
| Paper / Packaging | 2 | $29B |
|
||
| Retail | 1 | $160B |
|
||
| Transportation / Logistics | 1 | $91B |
|
||
| Airlines | 1 | $62B |
|
||
| Consumer Goods | 1 | $47B |
|
||
| Utilities | 1 | $25B |
|
||
Price history
+1416.8% since first listed15 events — show timeline
- 2026-05-29 Listed $238,900 CGMLS
- 2022-05-06 Sold (Public Records) $206,000 Public Records
- 2022-04-19 Sold (MLS) $206,000 CGMLS
- 2022-04-19 Sold (MLS) $206,000 GAMLS
- 2022-03-21 Pending — GAMLS
- 2022-03-20 Pending — GAMLS
- 2022-03-18 Listed $195,000 CGMLS
- 2022-03-16 Listed $195,000 GAMLS
- 2018-05-22 Sold (Public Records) $138,000 Public Records
- 2018-05-17 Sold (MLS) $138,000 CGMLS
- 2018-05-17 Sold (MLS) $138,000 GAMLS
- 2018-03-05 Listed $141,500 CGMLS
- 2018-03-05 Listed $141,500 GAMLS
- 2006-04-28 Sold (Public Records) $124,900 Public Records
- 2003-12-16 Sold (Public Records) $15,750 Public Records
Property tax history
+4.8%/yrLatest (2025): $1,915 · +4.8% YoY. Source: county tax records.
Cash-flow waterfall
monthlySold comps — $/sqft
last 12 mo · ≤1 miLoading sold comps…