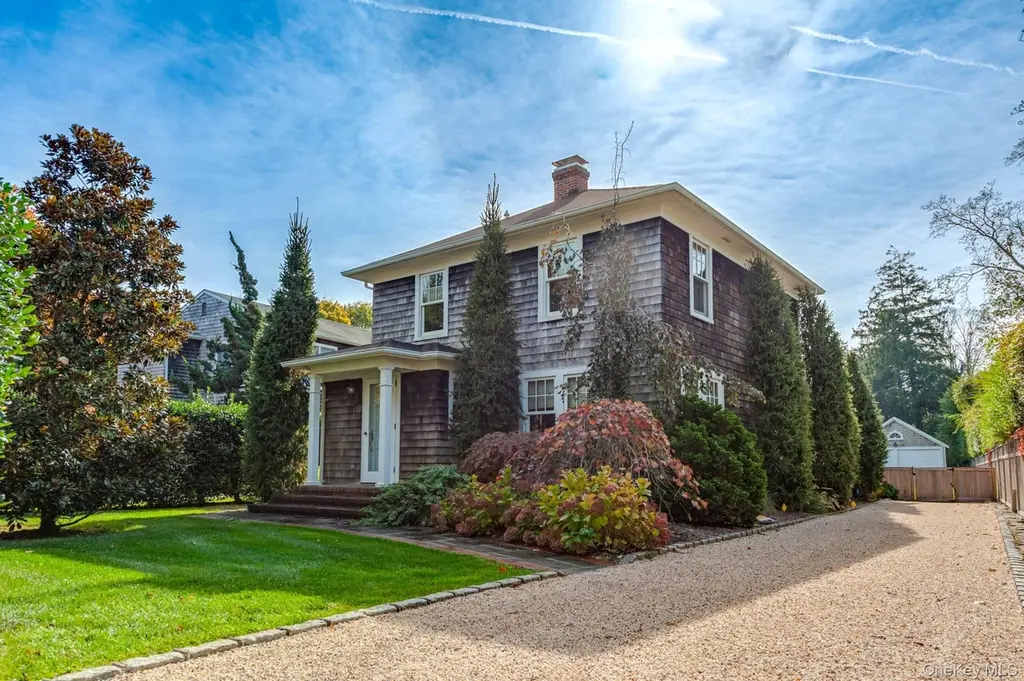
32 Cooper St · Southampton, NY
Flood risk 1/10 · Minimal
- FEMA flood zone
- X (unshaded)
- Chance of flooding over 30 yrs
- 0.0%
- Est. flood insurance / yr
- $473 – $860
Fire risk 1/10 · Minimal
- Est. fire insurance / yr
- $691 – $1,283
Heat risk 4/10 · Minor
- Hot days now (above 90°F)
- 7 days/yr
- Hot days in 30 yrs
- 20 days/yr
Wind risk 8/10 · Major
- Chance of severe wind over 30 yrs
- 80.0%
Air-quality risk 3/10 · Minor
- Unhealthy air days now
- 3 days/yr
- Unhealthy air days in 30 yrs
- 4 days/yr
Risk factors via First Street. Map © Google.
Why this score? — see what drove the F grade
The composite is a weighted blend of 9 inputs, each scored 0–100. Each bar is that input's sub-score; the figure is the points it added to the 100-point composite (weight × sub-score).
- ARV discount +7.5/15.0
- Rent growth +5.0/5.0
- Cash flow +4.9/30.0
- Schools +4.8/10.0
- Livability +3.5/5.0
- Condition / age +2.5/5.0
- 1% rule +0.7/10.0
- DSCR +0.0/10.0
- Appreciation +0.0/10.0
$3,250,000
🖨 Deal sheet 📄 Offer letter ✓ Due diligence
Listing remarks MLS
Southampton Village Classic with Legal Guest House An exceptional opportunity to own a classic and stylish Southampton Village residence with rare expansion potential. This beautifully maintained four-bedroom main house is complemented by a legal one-bedroom guest house, a detached 2.5-car garage currently configured as a recreation room, and a brand-new heated in-ground pool. The home is wonderful as it stands, yet offers tremendous upside. The property will be sold with architectural plans designed to enhance the layout and optimize the bedroom and bathroom count—creating an ideal floor plan for modern living. Opportunities like this, combining immediate enjoyment with future potential, are increasingly rare in today’s market. Ideally located on a sought-after Village street, just moments from Southampton Village shops, restaurants, and world-class ocean beaches.
Key facts
- Architectural plans
- Legal guest house
- Detached garage
Tags
Neighborhood map
What this means for you Summary
Snapshot
- This is a 3-bed/2.0-bath other listed at $3.25M.
Deal economics
- At list price, monthly cash flow is $-8k ($-93k/yr) — negative.
- To cash-flow at today's rent, offer at most $2.12M (34.7% below list).
- To meet the 1% rule (rent ≥ 1% of price), the offer needs to be $1.86M (42.8% below list).
- Recommended offer: $1.86M (42.8% below list) — sets the bar for 1% rule.
- Cap rate 3.4% vs local median 2.8% in Southampton — meaningfully above typical; check what's discounted (condition, days-on-market, listing class) to confirm the premium yield is real.
Location & tenants
- Location reads 69/100 on livability (#472 in NY) — a middle-class / working-renter tenant base. Strengths: crime A+, employment A+; Watch: commute D+, amenities F, cost of living F.
- Southampton Union Free School District (suburban): math 53% / reading 51% proficiency, ranked #293 of 590 in NY (top 50%) — acceptable for families but not a draw, mixed tenant base, ~2y average lease.
- Market conditions: Rents rising fast (+14.6%/yr); 95 active listings in the ZIP; 14 comparable units currently listed for rent nearby; rentals lingering (median 44d on market — plan ~5-8 weeks vacancy on turnover, expect pricing pressure); 64% of comp listings sitting > 30 days — soft ceiling on asking rent; high-income renter base; 1,366 units permitted in Suffolk County in 2024 (216 in 5+ unit buildings).
- At $18,574/mo this rent would consume 143% of the median local household income ($156k/yr) (locally 274% of renters already pay >50% of income on rent) — very limited rent-growth headroom before tenants either downsize or default.
Forward outlook
- Local home prices are declining (-3.0%/yr); year-one equity from $22k of loan paydown is wiped out by about $98k of value loss. Plan a longer hold.
- Suffolk County population projected to shrink 5% by 2050 — rents likely to lag national; underwrite the cash flow, not the appreciation.
Negotiation context
- It's been on market 113 days — a 9% lower offer ($2.96M) is reasonable based on typical stale-listing flexibility.
- 2 sale attempts since 2y ago with the ask held roughly flat each time — persistent listings suggest the price (not the market) is what's stuck; bring a comps-based counter.
- Current owner paid $1.80M; list at $3.25M implies a 81% gain — meaningful room to come down on a strong offer.
Risks & watch-outs
- Watch-outs: built in 1920 — expect roof / HVAC / electrical / plumbing capex.
- Climate carrying-cost: severe wind risk, 80% chance of damaging wind over 30y — expect insurance premiums to compound above CPI over the hold.
Questions for the listing agent
- What do current leases actually rent for vs. the listed asking? Can we see a recent rent roll and the last 12 months of T-12 income?
- It's been on market 113 days. Have you received any prior offers? Is the seller open to a 43% concession, seller financing, or rate buy-down credit?
- Built in 1920 — when were the roof, HVAC, electrical panel, plumbing, and water heater last replaced?
- Why hasn't it sold? Are there any deal-killer items the seller is aware of (foundation, flood, title, zoning, code violations)?
- Is there a deadline driving the sale (1031 exchange, divorce, estate, relocation)? That informs how much negotiation room exists.
- The area grade is low — what's the realistic commute time and amenity access for the typical tenant pool here? Any planned neighborhood developments (good or bad) we should know about?
- What's the average days-on-market for RENTAL listings here right now (not sales)? A rising rental-DOM trend means longer vacancies and softer asking-rent achievability than the comps imply.
- What's the recent tenant-quality profile in this submarket — average credit score on applications, eviction rate, late-payment / NSF rate, and stable-employment percentage? A property-management company in the area should have these aggregated.
- How much new for-sale + rental construction is in the pipeline within 1–3 miles? Heavy new supply typically softens prices + rents 12–24 months out; constrained supply supports both.
Investment metrics
- 1% rule
- 0.57% ✗
- Cap rate
- 3.42%
- Cash-on-cash
- -10.27%
- DSCR
- 0.54
- GRM
- 14.6
CMA / ARV
No comps found within radius.
Projected returns pro-forma
-3.0% appreciation · 8.0% rent growth · sell at horizon
- IRR
- -29.5%
- Equity multiple
- -0.02×
- Total profit
- $-924,131
- Equity at exit
- $484,586
- IRR
- -16.4%
- Equity multiple
- -0.09×
- Total profit
- $-995,406
- Equity at exit
- $281,001
Cash invested: $910,000 (down + closing). Projections, not guarantees.
Landlord ↔ Tenant lean methodology
- Overall (STATE)
- 15 Strongly Tenant-Friendly
- State New York
- 15 Strongly Tenant-Friendly · D+10
- County
- — inherits STATE
- City
- — inherits STATE
ZIP-level market 11968
- Home prices YoY
- -28.6%
- Rents YoY
- 14.6%
- Active inventory
- 95
- Price-to-rent
- 14.6×
Monthly cashflow live
- Estimated rent
- $18,574 medium interval (Pro) →
- Mortgage (P&I)
- −$17,043
- Tax est. 1.5%
- −$4,062 /mo · $48,750/yr
- Insurance
- −$1,354
- HOA
- −$0
- Vacancy / Maint / Mgmt
- −$3,901
- Net cashflow
- $-7,787
Break-even live
UW: 25.0% down · 7.5% · 30yr · 1.5% tax · 5.0% vac · 8.0% maint · 8.0% mgmt
Financing live
Cash to close
- Down payment
- $812,500
- Closing costs
- $97,500
- Reserves months
- —
- Total cash needed
- —
Loan-product check · same deal, 3 products live
Conventional
25% down · 7.5% · 30yr
- Down + closing
- —
- Monthly P&I
- —
- Monthly cashflow
- —
- DSCR
- —
- Eligible?
- —
Personal DTI + credit; lowest rate.
DSCR
20% down · 8.5% · 30yr
- Down + closing
- —
- Monthly P&I
- —
- Monthly cashflow
- —
- DSCR
- —
- Eligible?
- —
No personal income docs; deal must DSCR.
Hard money
10% down · 12.0% · 12mo
- Down + closing
- —
- Monthly P&I
- —
- Monthly cashflow
- —
- DSCR
- —
- Eligible?
- —
Short-term bridge; refi at stabilization.
Rent comps 14 comps
| Address | Beds | Baths | Sqft | Rent | $/sqft | DOM | Units | Dist |
|---|---|---|---|---|---|---|---|---|
| 138 Coopers Farm Rd Southampton, NY | 4.0 | 5.5 | 2893 | $50,000 | $17.28 | 43d | 1 | 0.14mi |
| 36 Corrigan St Southampton, NY | 3.0 | 3.5 | 2089 | $20,000 | $9.57 | 12d | 1 | 0.54mi |
| 36 Wiltshire St Southampton, NY | 4.0 | 3.5 | 3000 | $92,000 | $30.67 | 24d | 1 | 0.64mi |
| 62 Jennings Ave Southampton, NY | 3.0 | 3.0 | 2800 | $30,000 | $10.71 | 19d | 1 | 0.68mi |
| 669 Hill St Southampton, NY | 3.0 | 2.0 | 2000 | $75,000 | $37.50 | 43d | 1 | 0.86mi |
| 686 Hill St Southampton, NY | 4.0 | 3.5 | 2280 | $65,000 | $28.51 | 43d | 1 | 0.90mi |
| 40 Roman Rd Southampton, NY | 3.0 | 3.0 | 1912 | $6,500 | $3.40 | 43d | 1 | 0.97mi |
| 82 Powell Ave Southampton, NY | 4.0 | 4.0 | 2414 | $70,000 | $29.00 | 24d | 1 | 0.97mi |
| 16 Tuckahoe Ln Southampton, NY | 3.0 | 3.5 | 2900 | $25,000 | $8.62 | 19d | 1 | 1.13mi |
| 39 Huntting St Southampton, NY | 4.0 | 2.5 | 2441 | $30,000 | $12.29 | 43d | 1 | 1.27mi |
| 10 Leland Ln #19 Southampton, NY | 3.0 | 3.0 | 1400 | $30,000 | $21.43 | 43d | 1 | 1.28mi |
| 4 Carriage Ln Southampton, NY | 4.0 | 4.0 | 3000 | $72,000 | $24.00 | 43d | 1 | 1.34mi |
| 3 Meadowgrass Ln Southampton, NY | 3.0 | 2.0 | 1434 | $84,000 | $58.58 | 43d | 1 | 1.46mi |
| 520 Hampton Rd #18 Southampton, NY | 3.0 | 3.5 | 2250 | $99,000 | $44.00 | 43d | 1 | 1.46mi |
Listing history 5 events
-
2026-05-06status Pending 889-char remark
Show marketing remark (889 chars)
Southampton Village Classic with Legal Guest House An exceptional opportunity to own a classic and stylish Southampton Village residence with rare expansion potential. This beautifully maintained four-bedroom main house is complemented by a legal one-bedroom guest house, a detached 2.5-car garage currently configured as a recreation room, and a brand-new heated in-ground pool. The home is wonderful as it stands, yet offers tremendous upside. The property will be sold with architectural plans designed to enhance the layout and optimize the bedroom and bathroom count—creating an ideal floor plan for modern living. Opportunities like this, combining immediate enjoyment with future potential, are increasingly rare in today’s market. Ideally located on a sought-after Village street, just moments from Southampton Village shops, restaurants, and world-class ocean beaches.
-
2026-01-13$3,250,000 Active 889-char remark
Show marketing remark (889 chars)
Southampton Village Classic with Legal Guest House An exceptional opportunity to own a classic and stylish Southampton Village residence with rare expansion potential. This beautifully maintained four-bedroom main house is complemented by a legal one-bedroom guest house, a detached 2.5-car garage currently configured as a recreation room, and a brand-new heated in-ground pool. The home is wonderful as it stands, yet offers tremendous upside. The property will be sold with architectural plans designed to enhance the layout and optimize the bedroom and bathroom count—creating an ideal floor plan for modern living. Opportunities like this, combining immediate enjoyment with future potential, are increasingly rare in today’s market. Ideally located on a sought-after Village street, just moments from Southampton Village shops, restaurants, and world-class ocean beaches.
-
2025-05-01historical
-
2024-10-31$3,250,000 Active
-
2021-05-26soldstatus $1,800,000
ⓘ Source: listings_history table (triggers on properties + properties_extension) + one-shot
backfill from property_details.listing_events for pre-trigger history.
Climate risk First Street
- Flood 1/10 Low FEMA zone X (unshaded) · 0% chance over 30 yrs
- Wildfire 1/10 Low
- Heat 4/10 Moderate 7 d/yr ≥90°F today · 20 d/yr by 30 yrs out
- Wind 8/10 Severe 80% chance of damaging wind over 30 yrs
- Air quality 3/10 Moderate 3 unhealthy d/yr today · 4 by 30 yrs out
Nearby sold comps map
Loading sold comps map…
Walkable amenities ~0.75 mi
Loading nearby amenities…
Taxation est. · year 1
- Rental income
- $222,888
- − Mortgage interest
- −$182,051
- − Property taxes
- −$48,750
- − Insurance
- −$16,250
- − Repairs & maintenance
- −$17,831
- − Management
- −$17,831
- − Depreciation
- −$94,545
- Taxable loss
- −$154,370
- Est. tax savings @ 24.0%
- +$37,049
- After-tax cash flow
- $-56,390/yr
For passive investors: Depreciation is non-cash, so a rental often shows a tax loss while cash-flowing — sheltering income. Rental losses are passive: they offset passive income freely, and up to $25,000/yr can offset ordinary (W-2) income if you actively participate and your MAGI is under $100k (phasing out to $0 by $150k); unused losses carry forward. On sale, claimed depreciation is recaptured at up to 25%, and gains may owe capital-gains tax (a 1031 exchange can defer both). Figures are a year-1 estimate at your 24.0% rate — not tax advice; consult a CPA.
Schools (NCES district)
- District
- Southampton Union Free School District
- NCES district ID
- 3627540
- Math proficiency
- 53% ▬ 0.00%
- Reading proficiency
- 51% ▲ 4.00%
- Median HH income
- $85,977
- Composite
- 47.9/100
- National rank
- #2213
- State rank
- #293 of 590 in NY
Livability — Southampton
- Score
- 69/100
- State rank
- #472
- US rank
- #8333
Category grades
Schools grade is shown separately in the Schools card above.
Census & demographics
- Census place
- Southampton, NY
- County
- Suffolk County · 679,920 people
- City population
- 15,312
- Metro
- New York-Newark-Jersey City, NY-NJ-PA
- Population (ZIP)
- 15,312
- Household income
- $156,219
- Rent vs Own
- Severe rent burden
- 274.0
Population outlook (Suffolk County) Hauer SSP2
- Today (2025)
- 1,505,262 people
- By 2030
- 1,498,318 · -0.5%
- By 2040
- 1,471,101 · -2.3%
- By 2050
- 1,424,848 · -5.3%
- By 2075
- 1,337,157 · -11.2%
- By 2100
- 1,217,720 · -19.1%
Race, ethnicity, and origin ACS 2023
- Neighborhood character
- Predominantly White (71%)
- Race & ethnicity
- White 71% Hispanic / Latino 13% Two or more races 10% Black 9% Asian 3% Native American 2%
- Hispanic origin (detail)
- Mexican 3% Puerto Rican 2%
- Common ancestry
- Romanian 5% Scotch-Irish 2% Danish 2%
- Foreign-born
- 15% · Canada, Jamaica, Vietnam
- Languages at home
- 81% English-only · Spanish 11% Other Indo-European 3% German/W. Germanic 2%
Political lean MEDSL · Suffolk
- 2024 margin
- Lean R (+10.0) · D 45.0% · R 55.0%
- 2008→2024 swing
- -16.0pp toward R · 2008: 6.0pp · 2024: -10.0pp
- All cycles
- 2024: R+10.0 2020: R+0.0 2016: R+8.2 2012: D+2.9 2008: D+6.0
Not yet ingested
- Civics
- —
Market trends
- HPI YoY
- ▼ -184.86%
- Current HPI
- 461.1144
- Rent YoY
- ▲ 14.62%
- Metro
- New York-Newark-Jersey City, NY-NJ-PA
- State GDP YoY
- ▲ 2.60%
- F500 in state
- 92
Industry mix (Fortune 500 HQ in NY)
| Industry | F500 HQs | Revenue |
|---|---|---|
| Financial Services | 10 | $950B |
|
||
| Consumer Goods | 9 | $162B |
|
||
| Insurance | 4 | $225B |
|
||
| Telecommunications | 2 | $144B |
|
||
| Pharmaceuticals | 2 | $112B |
|
||
| Media / Entertainment | 2 | $69B |
|
||
Price history
+80.6% since first listed5 events — show timeline
- 2026-05-06 Pending — OneKey® MLS as Distributed by MLS Grid
- 2026-01-13 Listed $3,250,000 OneKey® MLS as Distributed by MLS Grid
- 2025-05-01 Listing Removed — OneKey® MLS as Distributed by MLS Grid
- 2024-10-31 Listed $3,250,000 OneKey® MLS as Distributed by MLS Grid
- 2021-05-26 Sold (Public Records) $1,800,000 Public Records
Property tax history
+3.0%/yrLatest (2024): $4,639 · -31.7% YoY. Source: county tax records.
Cash-flow waterfall
monthlySold comps — $/sqft
last 12 mo · ≤1 miLoading sold comps…