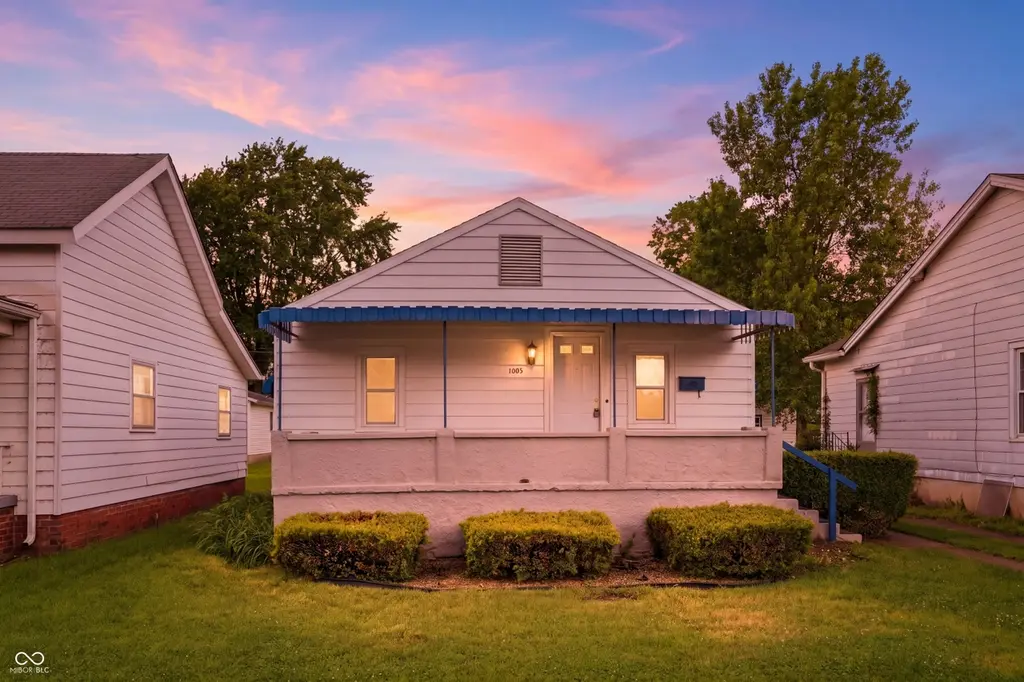
1003 S Shelby St · Shelbyville, IN
Flood risk 3/10 · Minor
- FEMA flood zone
- X (unshaded)
- Chance of flooding over 30 yrs
- 0.13%
- Est. flood insurance / yr
- $473 – $860
Fire risk 1/10 · Minimal
- Est. fire insurance / yr
- $717 – $1,331
Heat risk 4/10 · Minor
- Hot days now (above 102°F)
- 7 days/yr
- Hot days in 30 yrs
- 20 days/yr
Wind risk 2/10 · Minimal
- Chance of severe wind over 30 yrs
- 1.0%
Air-quality risk 2/10 · Minimal
- Unhealthy air days now
- 1 days/yr
- Unhealthy air days in 30 yrs
- 2 days/yr
Risk factors via First Street. Map © Google.
Why this score? — see what drove the D- grade
The composite is a weighted blend of 9 inputs, each scored 0–100. Each bar is that input's sub-score; the figure is the points it added to the 100-point composite (weight × sub-score).
- ARV discount +13.7/15.0
- Cash flow +7.3/30.0
- Schools +3.4/10.0
- Livability +3.2/5.0
- Rent growth +2.5/5.0
- Condition / age +2.5/5.0
- 1% rule +1.7/10.0
- DSCR +1.4/10.0
- Appreciation +0.0/10.0
$145,900
🖨 Deal sheet 📄 Offer letter ✓ Due diligence
Key facts
- 5,600 sq ft lot
- 2 garage spots
- Built 1925
Property features AI
Exterior
- Parking: Detached 2-car garage (576 sq ft)
- Utilities: Public water; Municipal sewer connected; No solid waste service listed
- Home design: Single-family residence; One level
- Construction: Vinyl siding; Concrete perimeter foundation
- Exterior features: Fenced yard
Interior
- Kitchen: Gas oven; Refrigerator
- Bedrooms: 2 bedrooms on the main level
- Bathrooms: 1 full bathroom on the main level
- Heating & cooling: Forced air heating (natural gas); Central air conditioning
- Interior features: Covered patio/porch; Basement present
- Laundry & utility: Washer and dryer; Gas water heater
Neighborhood map
What this means for you Summary
Snapshot
- This is a 2-bed/1.0-bath single-family listed at $146k.
Deal economics
- At list price, monthly cash flow is $-197 ($-2k/yr) — negative.
- To cash-flow at today's rent, offer at most $111k (23.9% below list).
- To meet the 1% rule (rent ≥ 1% of price), the offer needs to be $97k (33.4% below list).
- Recommended offer: $97k (33.4% below list) — sets the bar for 1% rule.
Location & tenants
- Location reads 63/100 on livability (#450 in IN) — a middle-class / working-renter tenant base. Strengths: cost of living A+, housing A+, crime B; Watch: employment C-, schools D+, amenities F.
- Shelbyville Central Schools (town): math 40% / reading 39% proficiency, ranked #148 of 301 in IN (top 49%) — families likely to look elsewhere, expect single-tenant / working-renter base with shorter leases.
- Market conditions: 229 active listings in the ZIP; 14 comparable units currently listed for rent nearby; rentals at typical pace (median 22d on market — plan ~3-4 weeks tenant-placement turnaround); 285 units permitted in Shelby County in 2024 (147 in 5+ unit buildings).
- This rent is only 18% of the median local income ($65k/yr) — well below the 30% rent-burden line; pricing power to push rent on renewal without tenant pushback.
Forward outlook
- Local home prices are declining (-3.0%/yr); year-one equity from $1k of loan paydown is wiped out by about $4k of value loss. Plan a longer hold.
- Shelby County population projected to shrink 6% by 2050 — rents likely to lag national; underwrite the cash flow, not the appreciation.
Negotiation context
- Only 4 days on market — expect competitive offers; lowballing is unlikely to land.
Risks & watch-outs
- Watch-outs: built in 1925 — expect roof / HVAC / electrical / plumbing capex.
Questions for the listing agent
- What do current leases actually rent for vs. the listed asking? Can we see a recent rent roll and the last 12 months of T-12 income?
- Built in 1925 — when were the roof, HVAC, electrical panel, plumbing, and water heater last replaced?
- Is there a deadline driving the sale (1031 exchange, divorce, estate, relocation)? That informs how much negotiation room exists.
- Schools are D-rated, which usually means shorter tenancies and higher turnover. Who's the typical renter profile here, and what's been the actual vacancy rate?
- The area grade is low — what's the realistic commute time and amenity access for the typical tenant pool here? Any planned neighborhood developments (good or bad) we should know about?
- What's the average days-on-market for RENTAL listings here right now (not sales)? A rising rental-DOM trend means longer vacancies and softer asking-rent achievability than the comps imply.
- What's the recent tenant-quality profile in this submarket — average credit score on applications, eviction rate, late-payment / NSF rate, and stable-employment percentage? A property-management company in the area should have these aggregated.
- How much new for-sale + rental construction is in the pipeline within 1–3 miles? Heavy new supply typically softens prices + rents 12–24 months out; constrained supply supports both.
Investment metrics
- 1% rule
- 0.67% ✗
- Cap rate
- 4.67%
- Cash-on-cash
- -5.79%
- DSCR
- 0.74
- GRM
- 12.5
CMA / ARV
- ARV (median comp)
- $169,272
- List price
- $145,900
- Delta
- -13.81%
- Verdict
- UNDERPRICED
- Comps
- 20 within 1.0 mi
Show comp detail 8 sales within ~0.75 mi
| Address | Dist | Beds/Ba | Sqft | Sold | Price | $/sf | Match |
|---|---|---|---|---|---|---|---|
| 825 Moriseni St | 0.28mi | 2/1.0 | 768 (0%) | 1mo | $50,000 | $65 | 86 |
| 1222 Lincoln St | 0.29mi | 2/1.0 | 750 (-2%) | 1mo | $154,900 | $207 | 81 |
| 625 9th St | 0.49mi | 2/1.0 | 768 (0%) | 20mo | $159,900 | $208 | 61 |
| 315 W South St | 0.40mi | 2/1.0 | 856 (+12%) | 4mo | $163,000 | $190 | 58 |
| 110 Goodrich Ave | 0.63mi | 2/1.0 | 700 (-9%) | 1mo | $137,000 | $196 | 55 |
| 709 Center St | 0.60mi | 2/1.0 | 799 (+4%) | 14mo | $159,900 | $200 | 53 |
| 219 E Taylor St | 0.68mi | 2/1.0 | 728 (-5%) | 21mo | $151,500 | $208 | 42 |
| 611 Center St | 0.65mi | 2/1.0 | 692 (-10%) | 16mo | $107,000 | $155 | 40 |
Match score weights: distance 35% · size 25% · config 20% · recency 20%. Top-matched comps best support the ARV.
Projected returns pro-forma
-3.0% appreciation · 3.0% rent growth · sell at horizon
- IRR
- -26.2%
- Equity multiple
- 0.11×
- Total profit
- $-36,204
- Equity at exit
- $21,754
- IRR
- -23.3%
- Equity multiple
- -0.17×
- Total profit
- $-47,734
- Equity at exit
- $12,615
Cash invested: $40,852 (down + closing). Projections, not guarantees.
Landlord ↔ Tenant lean methodology
- Overall (STATE)
- 90 Strongly Landlord-Friendly
- State Indiana
- 90 Strongly Landlord-Friendly · R+11
- County
- — inherits STATE
- City
- — inherits STATE
ZIP-level market 46176
- Home prices YoY
- -33.9%
- Active inventory
- 229
- Price-to-rent
- 12.5×
Monthly cashflow live
- Estimated rent
- $972 high interval (Pro) →
- Mortgage (P&I)
- −$765
- Tax from tax record
- −$139 /mo · $1,668/yr
- Insurance
- −$61
- HOA
- −$0
- Vacancy / Maint / Mgmt
- −$204
- Net cashflow
- $-197
Break-even live
UW: 25.0% down · 7.5% · 30yr · 1.5% tax · 5.0% vac · 8.0% maint · 8.0% mgmt
Financing live
Cash to close
- Down payment
- $36,475
- Closing costs
- $4,377
- Reserves months
- —
- Total cash needed
- —
Loan-product check · same deal, 3 products live
Conventional
25% down · 7.5% · 30yr
- Down + closing
- —
- Monthly P&I
- —
- Monthly cashflow
- —
- DSCR
- —
- Eligible?
- —
Personal DTI + credit; lowest rate.
DSCR
20% down · 8.5% · 30yr
- Down + closing
- —
- Monthly P&I
- —
- Monthly cashflow
- —
- DSCR
- —
- Eligible?
- —
No personal income docs; deal must DSCR.
Hard money
10% down · 12.0% · 12mo
- Down + closing
- —
- Monthly P&I
- —
- Monthly cashflow
- —
- DSCR
- —
- Eligible?
- —
Short-term bridge; refi at stabilization.
Rent comps 14 comps
| Address | Beds | Baths | Sqft | Rent | $/sqft | DOM | Units | Dist |
|---|---|---|---|---|---|---|---|---|
| 135 W Hendricks St Shelbyville, IN | 1.0 | 1.0 | 544 | $695 | $1.28 | 23d | 1 | 0.54mi |
| 135 W Hendricks St Unit 2 Shelbyville, IN | 1.0 | 1.0 | 544 | $750 | $1.38 | 10d | 1 | 0.54mi |
| 135 W Hendricks St #4 Shelbyville, IN | 1.0 | 1.0 | 544 | $725 | $1.33 | 19d | 1 | 0.54mi |
| 529 W Washington St Shelbyville, IN | 1.0 | 1.0 | 878 | $695 | $0.79 | 1d | 1 | 0.66mi |
| 316 W Franklin St Shelbyville, IN | 1.0 | 1.0 | 700 | $695 | $0.99 | 1d | 1 | 0.79mi |
| 316 W Franklin St Shelbyville, IN | 1.0 | 1.0 | 750 | $645 | $0.86 | 43d | 1 | 0.79mi |
| 106 E Pennsylvania St Shelbyville, IN | 1.0 | 1.0 | 563 | $545 | $0.97 | 16d | 1 | 0.94mi |
| 425 N Harrison St Shelbyville, IN | 3.0 | 1.0–2.0 | 909 | $1,614 | $1.78 | 1d | 7 | 1.02mi |
| 348 E Franklin St Shelbyville, IN | 2.0 | 1.0 | 934 | $1,295 | $1.39 | 21d | 1 | 1.13mi |
| 713 Indiana Ave Shelbyville, IN | 2.0 | 1.0 | 1077 | $1,100 | $1.02 | 43d | 1 | 1.27mi |
| 645 Main St Unit 3 Shelbyville, IN | 1.0 | 1.0 | 600 | $750 | $1.25 | 43d | 1 | 1.42mi |
| 1825 Wichman Ln Shelbyville, IN | 1.0 | 1.0 | 684 | $990 | $1.45 | 43d | 1 | 1.49mi |
| 1825 Wichman Ln Shelbyville, IN | 2.0 | 2.0 | 938 | $1,190 | $1.27 | 1d | 1 | 1.49mi |
| 1825 Wichman Ln Shelbyville, IN | 2.0 | 2.0 | 938 | $1,190 | $1.27 | 44d | 1 | 1.49mi |
Listing history 2 events
-
2026-05-11status Pending 676-char remark
-
2026-05-05$145,900 Active 676-char remark
ⓘ Source: listings_history table (triggers on properties + properties_extension) + one-shot
backfill from property_details.listing_events for pre-trigger history.
Tax reassessment forecast IN · Partial reset (capped growth)
- Current annual tax
- $1,668 · $139/mo
- Projected year-2 tax
- $1,668 · $139/mo
- Expected delta
- $0/yr ($0/mo · 0.0%)
ⓘ Screening estimate from a state-policy table — verify with the county assessor before closing.
Climate risk First Street
- Flood 3/10 Moderate FEMA zone X (unshaded) · 13% chance over 30 yrs
- Wildfire 1/10 Low
- Heat 4/10 Moderate 7 d/yr ≥102°F today · 20 d/yr by 30 yrs out
- Wind 2/10 Low 100% chance of damaging wind over 30 yrs
- Air quality 2/10 Low 1 unhealthy d/yr today · 2 by 30 yrs out
Nearby sold comps map
Loading sold comps map…
Walkable amenities ~0.75 mi
Loading nearby amenities…
Taxation est. · year 1
- Rental income
- $11,664
- − Mortgage interest
- −$8,173
- − Property taxes
- −$1,668
- − Insurance
- −$730
- − Repairs & maintenance
- −$933
- − Management
- −$933
- − Depreciation
- −$4,244
- Taxable loss
- −$5,017
- Est. tax savings @ 24.0%
- +$1,204
- After-tax cash flow
- $-1,160/yr
For passive investors: Depreciation is non-cash, so a rental often shows a tax loss while cash-flowing — sheltering income. Rental losses are passive: they offset passive income freely, and up to $25,000/yr can offset ordinary (W-2) income if you actively participate and your MAGI is under $100k (phasing out to $0 by $150k); unused losses carry forward. On sale, claimed depreciation is recaptured at up to 25%, and gains may owe capital-gains tax (a 1031 exchange can defer both). Figures are a year-1 estimate at your 24.0% rate — not tax advice; consult a CPA.
Schools (NCES district)
- District
- Shelbyville Central Schools
- NCES district ID
- 1810140
- Math proficiency
- 40% ▼ -10.00%
- Reading proficiency
- 39% ▼ -9.00%
- Median HH income
- $45,199
- Composite
- 33.63/100
- National rank
- #5402
- State rank
- #148 of 301 in IN
Livability — Shelbyville
- Score
- 63/100
- State rank
- #450
- US rank
- #16051
Category grades
Schools grade is shown separately in the Schools card above.
Census & demographics
- Census place
- Shelbyville, IN
- County
- Shelby County · 28,782 people
- City population
- 28,782
- Metro
- Indianapolis-Carmel-Anderson, IN
- Population (ZIP)
- 28,782
- Household income
- $65,182
- Rent vs Own
- Severe rent burden
- 921.0
Population outlook (Shelby County) Hauer SSP2
- Today (2025)
- 45,020 people
- By 2030
- 44,962 · -0.1%
- By 2040
- 44,126 · -2.0%
- By 2050
- 42,110 · -6.5%
- By 2075
- 37,131 · -17.5%
- By 2100
- 29,714 · -34.0%
Race, ethnicity, and origin ACS 2023
- Neighborhood character
- Predominantly White (88%)
- Race & ethnicity
- White 88% Hispanic / Latino 7% Two or more races 4% Black 2% Asian 1%
- Hispanic origin (detail)
- Mexican 5%
- Common ancestry
- Italian 2% Slovak 1% Lithuanian 1%
- Foreign-born
- 5% · Canada
- Languages at home
- 92% English-only · Spanish 5% German/W. Germanic 1% Other Asian/Pacific 1%
Political lean MEDSL · Shelby
- 2024 margin
- Solid R (+48.0) · D 25.1% · R 73.1% · Other 1.8%
- 2008→2024 swing
- -29.0pp toward R · 2008: -19.0pp · 2024: -48.0pp
- All cycles
- 2024: R+48.0 2020: R+47.7 2016: R+47.2 2012: R+33.5 2008: R+19.0
Not yet ingested
- Civics
- —
Market trends
- HPI YoY
- ▼ -116.59%
- Current HPI
- 227.6747
- Rent YoY
- —
- Metro
- Indianapolis-Carmel-Anderson, IN
- State GDP YoY
- ▲ 2.90%
- F500 in state
- 18
Industry mix (Fortune 500 HQ in IN)
| Industry | F500 HQs | Revenue |
|---|---|---|
| Industrial Machinery | 2 | $37B |
|
||
| Healthcare | 1 | $177B |
|
||
| Pharmaceuticals | 1 | $45B |
|
||
| Metals / Steel | 1 | $18B |
|
||
| Agriculture | 1 | $17B |
|
||
| Packaging | 1 | $12B |
|
||
Price history
-2.0% since first listed3 events — show timeline
- 2026-06-10 Sold (MLS) $143,000 MIBOR as Distributed by MLS Grid
- 2026-05-11 Pending — MIBOR as Distributed by MLS Grid
- 2026-05-05 Listed $145,900 MIBOR as Distributed by MLS Grid
Property tax history
+44.6%/yrLatest (2025): $1,668 · +2.2% YoY. Source: county tax records.
Cash-flow waterfall
monthlySold comps — $/sqft
last 12 mo · ≤1 miLoading sold comps…