 Duplex
108 W Adams St · Itasca, TX
Flood risk 1/10 · Minimal
- FEMA flood zone
- X (unshaded)
- Chance of flooding over 30 yrs
- 0.0%
- Est. flood insurance / yr
- $507 – $1,088
Fire risk 5/10 · Moderate
- Est. fire insurance / yr
- $1,222 – $2,270
Heat risk 7/10 · Major
- Hot days now (above 109°F)
- 7 days/yr
- Hot days in 30 yrs
- 24 days/yr
Wind risk 6/10 · Moderate
- Chance of severe wind over 30 yrs
- 27.0%
Air-quality risk 2/10 · Minimal
- Unhealthy air days now
- 1 days/yr
- Unhealthy air days in 30 yrs
- 2 days/yr
Risk factors via First Street. Map © Google.
Why this score? — see what drove the F grade
The composite is a weighted blend of 9 inputs, each scored 0–100. Each bar is that input's sub-score; the figure is the points it added to the 100-point composite (weight × sub-score).
- Appreciation +10.0/10.0
- ARV discount +7.5/15.0
- Livability +3.2/5.0
- Cash flow +3.0/30.0
- Rent growth +2.5/5.0
- Schools +2.5/10.0
- Condition / age +2.5/5.0
- 1% rule +0.0/10.0
- DSCR +0.0/10.0
$375,000
🖨 Deal sheet 📄 Offer letter ✓ Due diligence
Multi-family units
County records classify this as Multi-Family (2-4 Unit). Listing-text estimate: 2 units. confirmed
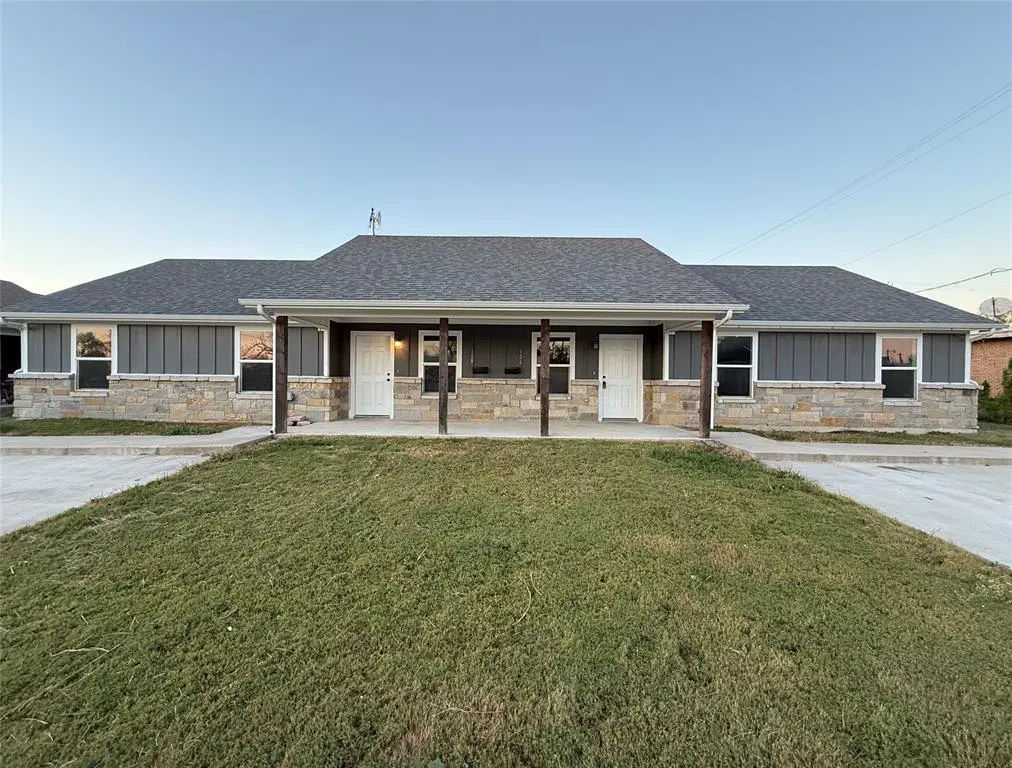
Listing remarks
Secure your next income-producing asset with this well maintained duplex. Only 5 years old but was freshly painted on the entire inside summer 2025, plus brand new vanities in both primary en suites, along with a few more updates. The kitchen comes equipped with stainless steel appliances, kitchen island, and pantry. Perfectly positioned in a quiet community, this property offers immediate cash flow with both units 100% occupied. Each side features a spacious 1,188 sq. ft. layout with 3 bedrooms and 2 full baths. The modern, open-concept floor plan is designed for long-term tenant appeal, complete with in-unit laundry room and low-maintenance finishes. Start collecting rent from day one!
Key facts
- Freshly painted
- Kitchen island
- Brand new vanities
Tags
Property features AI
Finance
- Other: Property type: Residential income duplex; Number of buildings: 1; Total units: 2; Building area reported: 2,376 (source: builder); Lot described as less than 0.5 acre
- Financial info: Gross annual income reported for property: $39,600; Gross annual expenses reported for property: $3,600; Insurance expense reported: $2,148; Net operating income reported: $33,851; Capitalization rate: 9.03%; Listing terms include 1031 Exchange, Cash, Conventional, FHA, VA
- HOA & community: No association
Exterior
- Parking: Concrete driveway; 4 parking spaces
- Utilities: City water; City sewer; Individual gas meter; Individual water meter; Cable available; Underground utilities; All-weather road
- Home design: Duplex (residential income); One story; Preowned (built in 2021)
- Construction: Brick construction; Composition roof; Slab foundation; Built in 2021
- Exterior features: Covered porches; Front porch; Rear porch; Covered patio
Interior
- Kitchen: Dishwasher; Disposal; Electric oven; Microwave; Kitchen island; Pantry; Granite counters; Eat-in kitchen; Open floorplan
- Bedrooms: 6 bedrooms
- Flooring: Concrete flooring
- Bathrooms: 4 full bathrooms
- Heating & cooling: Central air; Ceiling fans; Electric heating
- Interior features: Cable TV available; Decorative lighting; Eat-in kitchen; Granite counters; High speed internet available; Kitchen island; Open floorplan; Pantry; Vaulted ceilings; Walk-in closets; Window coverings
- Laundry & utility: Electric water heater
Neighborhood map
What this means for you Summary
Snapshot
- This is a 2 × 3-bed/2.0-bath units multifamily listed at $375k.
Deal economics
- At list price, monthly cash flow is $-1k ($-15k/yr) — negative. Per door: $-610/mo.
- To cash-flow at today's rent, offer at most $159k (57.5% below list).
- To meet the 1% rule (rent ≥ 1% of price), the offer needs to be $175k (53.3% below list).
- Recommended offer: $159k (57.5% below list) — sets the bar for cash-flow.
- Cap rate 2.4% vs local median 5.7% in Itasca — below-typical yield; the buyer is paying a premium for something (appreciation thesis, condition, location) that the cap rate doesn't capture.
Location & tenants
- Location reads 63/100 on livability (#832 in TX) — a middle-class / working-renter tenant base. Strengths: cost of living A+, housing A+, crime A-; Watch: employment D, amenities F, commute F.
- Itasca ISD (rural): math 23% / reading 35% proficiency, ranked #636 of 826 in TX (top 77%) — low school quality limits family demand, transient renter base, plan for 1-2y turnover; 63% free/reduced lunch — lower-income household profile, screen leases tightly.
- Zoned schools: Itasca El (math 17% / reading 32%, grade F, #3,052 of 4,322 statewide, top 74%, 295 students, 74% FRL).
- Market conditions: 83 active listings in the ZIP; 65 units permitted in Hill County in 2024 (0 in 5+ unit buildings).
Forward outlook
- In year one you build about $40k of equity ($3k loan paydown + $38k appreciation (10.0% local appreciation)).
- Hill County population projected at -12% by 2050 — secular population decline; favor cash flow + early exit over multi-decade hold.
- By year 2, paydown + projected appreciation supports a ~$64k cash-out refi (75% LTV) — recoverable capital for the next deal without selling this one.
Negotiation context
- It's been on market 27 days — a 2% lower offer ($369k) is reasonable based on typical stale-listing flexibility.
- 2 sale attempts with the ask held roughly flat each time — persistent listings suggest the price (not the market) is what's stuck; bring a comps-based counter.
Risks & watch-outs
- Climate carrying-cost: major wind risk, 27% chance of damaging wind over 30y; moderate wildfire risk; extreme-heat days projected 7→24/yr by 2055 (HVAC capex compounding) — expect insurance premiums to compound above CPI over the hold.
Questions for the listing agent
- What do current leases actually rent for vs. the listed asking? Can we see a recent rent roll and the last 12 months of T-12 income?
- Can we see the unit-by-unit rent roll, current vacancy, and any below-market leases? What's the average tenancy length?
- What capital expenditures (roof, boiler, parking lot, exteriors) have been made in the last 5 years, and what's planned in the next 2?
- Is there a deadline driving the sale (1031 exchange, divorce, estate, relocation)? That informs how much negotiation room exists.
- Schools are D-rated, which usually means shorter tenancies and higher turnover. Who's the typical renter profile here, and what's been the actual vacancy rate?
- The area grade is low — what's the realistic commute time and amenity access for the typical tenant pool here? Any planned neighborhood developments (good or bad) we should know about?
- What's the average days-on-market for RENTAL listings here right now (not sales)? A rising rental-DOM trend means longer vacancies and softer asking-rent achievability than the comps imply.
- What's the recent tenant-quality profile in this submarket — average credit score on applications, eviction rate, late-payment / NSF rate, and stable-employment percentage? A property-management company in the area should have these aggregated.
- How much new apartment / multifamily construction is in the pipeline within 1–3 miles? Heavy new supply (>2% of stock underway) typically softens rents 12–24 months out; light construction supports rent growth.
Investment metrics
- 1% rule
- 0.47% ✗
- Cap rate
- 2.39%
- Cash-on-cash
- -13.95%
- DSCR
- 0.38
- GRM
- 17.9
CMA / ARV
No comps found within radius.
Projected returns pro-forma
10.0% appreciation · 3.0% rent growth · sell at horizon
- IRR
- 14.6%
- Equity multiple
- 2.21×
- Total profit
- $126,549
- Equity at exit
- $337,830
- IRR
- 14.4%
- Equity multiple
- 5.13×
- Total profit
- $433,850
- Equity at exit
- $728,543
Cash invested: $105,000 (down + closing). Projections, not guarantees.
Landlord ↔ Tenant lean methodology
- Overall (STATE)
- 87 Strongly Landlord-Friendly
- State Texas
- 87 Strongly Landlord-Friendly · R+5
- County
- — inherits STATE
- City
- — inherits STATE
ZIP-level market 76055
- Home prices YoY
- 4.1%
- Active inventory
- 83
- Price-to-rent
- 35.7×
Monthly cashflow live
- Estimated rent
- $1,750 medium interval (Pro) →
- Mortgage (P&I)
- −$1,967
- Tax from tax record
- −$480 /mo · $5,760/yr
- Insurance
- −$156
- HOA
- −$0
- Vacancy / Maint / Mgmt
- −$368
- Net cashflow
- $-1,220
Break-even live
2-unit breakdown (identical units grouped — click to expand)
| Units | Beds | Baths | Est. rent |
|---|---|---|---|
| 2× units | 3 | 2 | $1,750 |
| #1 | 3 | 2 | $875 |
| #2 | 3 | 2 | $875 |
| Total (2 units) | $1,750 | ||
UW: 25.0% down · 7.5% · 30yr · 1.5% tax · 5.0% vac · 8.0% maint · 8.0% mgmt
Financing live
Cash to close
- Down payment
- $93,750
- Closing costs
- $11,250
- Reserves months
- —
- Total cash needed
- —
Loan-product check · same deal, 3 products live
Conventional
25% down · 7.5% · 30yr
- Down + closing
- —
- Monthly P&I
- —
- Monthly cashflow
- —
- DSCR
- —
- Eligible?
- —
Personal DTI + credit; lowest rate.
DSCR
20% down · 8.5% · 30yr
- Down + closing
- —
- Monthly P&I
- —
- Monthly cashflow
- —
- DSCR
- —
- Eligible?
- —
No personal income docs; deal must DSCR.
Hard money
10% down · 12.0% · 12mo
- Down + closing
- —
- Monthly P&I
- —
- Monthly cashflow
- —
- DSCR
- —
- Eligible?
- —
Short-term bridge; refi at stabilization.
Listing history 22 events
-
2026-06-18days on market $375,000 Active 27 DOM
-
2026-06-17days on market $375,000 Active 26 DOM
-
2026-06-16days on market $375,000 Active 25 DOM
-
2026-06-15days on market $375,000 Active 24 DOM
-
2026-06-13days on market $375,000 Active 22 DOM
-
2026-06-12days on market $375,000 Active 21 DOM
-
2026-06-10days on market $375,000 Active 18 DOM
-
2026-06-08days on market $375,000 Active 17 DOM
-
2026-06-08days on market $375,000 Active 16 DOM
-
2026-06-05days on market $375,000 Active 14 DOM
-
2026-06-03days on market $375,000 Active 12 DOM
-
2026-06-02days on market $375,000 Active 11 DOM
-
2026-06-01days on market $375,000 Active 10 DOM
-
2026-05-31days on market $375,000 Active 9 DOM
-
2026-05-22$375,000 Active
-
2026-02-28historical $1,750
-
2026-01-07$1,750
-
2021-11-24soldstatus
-
2020-06-25soldstatus
-
2011-06-24soldstatus
-
2011-04-04soldstatus
-
2000-01-03soldstatus
ⓘ Source: listings_history table (triggers on properties + properties_extension) + one-shot
backfill from property_details.listing_events for pre-trigger history.
Tax reassessment forecast TX · Resets to sale price
- Current annual tax
- $5,760 · $480/mo
- Projected year-2 tax
- $6,862 · $572/mo
- Expected delta
- +$1,103/yr (+$92/mo · 19.1%)
ⓘ Screening estimate from a state-policy table — verify with the county assessor before closing.
Climate risk First Street
- Flood 1/10 Low FEMA zone X (unshaded) · 0% chance over 30 yrs
- Wildfire 5/10 Major
- Heat 7/10 Severe 7 d/yr ≥109°F today · 24 d/yr by 30 yrs out
- Wind 6/10 Major 27% chance of damaging wind over 30 yrs
- Air quality 2/10 Low 1 unhealthy d/yr today · 2 by 30 yrs out
Nearby sold comps map
Loading sold comps map…
Walkable amenities ~0.75 mi
Loading nearby amenities…
Taxation est. · year 1
- Rental income
- $21,000
- − Mortgage interest
- −$21,006
- − Property taxes
- −$5,760
- − Insurance
- −$1,875
- − Repairs & maintenance
- −$1,680
- − Management
- −$1,680
- − Depreciation
- −$10,909
- Taxable loss
- −$21,910
- Est. tax savings @ 24.0%
- +$5,258
- After-tax cash flow
- $-9,385/yr
For passive investors: Depreciation is non-cash, so a rental often shows a tax loss while cash-flowing — sheltering income. Rental losses are passive: they offset passive income freely, and up to $25,000/yr can offset ordinary (W-2) income if you actively participate and your MAGI is under $100k (phasing out to $0 by $150k); unused losses carry forward. On sale, claimed depreciation is recaptured at up to 25%, and gains may owe capital-gains tax (a 1031 exchange can defer both). Figures are a year-1 estimate at your 24.0% rate — not tax advice; consult a CPA.
Schools (NCES district)
- District
- Itasca ISD
- NCES district ID
- 4824480
- Math proficiency
- 23% ▼ -8.00%
- Reading proficiency
- 35% ▼ -1.00%
- Median HH income
- $49,224
- Composite
- 25.26/100
- National rank
- #7499
- State rank
- #636 of 826 in TX
Livability — Itasca
- Score
- 63/100
- State rank
- #832
- US rank
- #14977
Category grades
Schools grade is shown separately in the Schools card above.
Census & demographics
- Census place
- Itasca, TX
- City population
- 3,719
- Population (ZIP)
- 3,719
Population outlook (Hill County) Hauer SSP2
- Today (2025)
- 34,013 people
- By 2030
- 33,289 · -2.1%
- By 2040
- 31,688 · -6.8%
- By 2050
- 30,100 · -11.5%
- By 2075
- 26,818 · -21.2%
- By 2100
- 22,918 · -32.6%
Race, ethnicity, and origin ACS 2023
- Neighborhood character
- Majority White (60%)
- Race & ethnicity
- White 60% Hispanic / Latino 30% Two or more races 9% Black 6%
- Hispanic origin (detail)
- Mexican 29%
- Common ancestry
- Lithuanian 2% Slovak 1% Italian 1%
- Foreign-born
- 5% · Canada
- Languages at home
- 87% English-only · Spanish 11% German/W. Germanic 1% French/Haitian/Cajun 1%
Political lean MEDSL · Hill
- 2024 margin
- Solid R (+64.4) · D 17.5% · R 81.8%
- 2008→2024 swing
- -23.0pp toward R · 2008: -41.4pp · 2024: -64.4pp
- All cycles
- 2024: R+64.4 2020: R+60.7 2016: R+58.4 2012: R+53.0 2008: R+41.4
Not yet ingested
- Civics
- —
Market trends
- HPI YoY
- ▲ 10.37%
- Current HPI
- 264.5221
- Rent YoY
- —
- Metro
- —
- State GDP YoY
- ▲ 3.95%
- F500 in state
- 110
Industry mix (Fortune 500 HQ in TX)
| Industry | F500 HQs | Revenue |
|---|---|---|
| Energy | 16 | $1,198B |
|
||
| Technology | 5 | $198B |
|
||
| Engineering / Construction | 4 | $72B |
|
||
| Energy Services | 3 | $60B |
|
||
| Utilities | 3 | $41B |
|
||
| Healthcare | 2 | $330B |
|
||
Price history
+21328.6% since first listed8 events — show timeline
- 2026-05-22 Listed $375,000 NTREIS
- 2026-02-28 Rental Removed $1,750 RENTEC
- 2026-01-07 Listed for Rent $1,750 RENTEC
- 2021-11-24 Sold (Public Records) — Public Records
- 2020-06-25 Sold (Public Records) — Public Records
- 2011-06-24 Sold (Public Records) — Public Records
- 2011-04-04 Sold (Public Records) — Public Records
- 2000-01-03 Sold (Public Records) — Public Records
Property tax history
+55.8%/yrLatest (2025): $5,760 · -2.2% YoY. Source: county tax records.
Cash-flow waterfall
monthlySold comps — $/sqft
last 12 mo · ≤1 miLoading sold comps…