 🏗️ New Construction
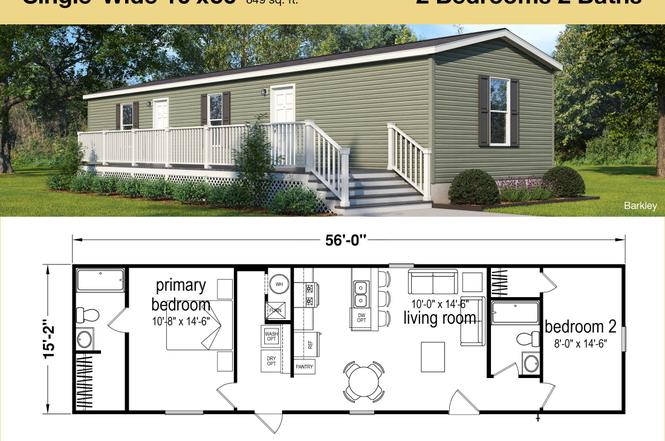
Barkley (Forest Lakes) Plan · Conway, AR
Flood risk No data
- FEMA flood zone
- —
- Chance of flooding over 30 yrs
- —
- Est. flood insurance / yr
- —
Fire risk No data
- Est. fire insurance / yr
- —
Heat risk No data
- Hot days now (above threshold)
- —
- Hot days in 30 yrs
- —
Wind risk No data
- Chance of severe wind over 30 yrs
- —
Air-quality risk No data
- Unhealthy air days now
- —
- Unhealthy air days in 30 yrs
- —
Risk factors via First Street. Map © Google.
Why this score? — see what drove the D grade
The composite is a weighted blend of 9 inputs, each scored 0–100. Each bar is that input's sub-score; the figure is the points it added to the 100-point composite (weight × sub-score).
- 1% rule +10.0/10.0
- Cash flow +8.3/30.0
- ARV discount +7.5/15.0
- Schools +3.8/10.0
- Livability +3.5/5.0
- Condition / age +2.5/5.0
- Rent growth +2.4/5.0
- DSCR +2.2/10.0
- Appreciation +0.0/10.0
$65,995
🖨 Deal sheet 📄 Offer letter ✓ Due diligence
Listing remarks
Located in Conway just north of Little Rock Arkansas, and near the beautiful Lake Conway, Forest Lake Pointe is a charming community. The community has on-site management, a clubhouse, picnic areas, playground, pickleball, shuffleboard, pavilions, and duck ponds and a community center with billiards. Forest Lake Pointe offers a refreshingly fun place to live and play. Forest Lake is minutes away from downtown Conway, retail shops, theaters, community sports complex, Conway Regional Hospital, colleges and more. Major employers in Little Rock include Amazon, Deloitte, Target, Verizon and the U. S. Air Force. Community Amenities Basketball Court, Clubhouse, Fishing Lake, On-Site Management, La
Key facts
- Clubhouse
- Pickleball
- Shuffleboard
Tags
Property features AI
Finance
- Other: Model/plan inventory type listed as 'Plan'
- Financial info: List price $65,995
- HOA & community: Association fee of $400 (period not specified)
Exterior
- Home design: Plan home (Barkley, Forest Lakes)
- Exterior features: Living area approximately 849
Interior
- Bedrooms: 2 bedrooms
- Bathrooms: 2 bathrooms (full)
- Interior features: Plan home (Barkley, Forest Lakes)
Neighborhood map
What this means for you Summary
Snapshot
- This is a 2-bed/2.0-bath manufactured listed at $66k.
Deal economics
- At list price, monthly cash flow is $-61 ($-731/yr) — negative.
- To cash-flow at today's rent, offer at most $57k (13.4% below list).
- Meets the 1% rule at list price ($1k rent vs $66k).
- Recommended offer: $57k (13.4% below list) — sets the bar for cash-flow.
- Cap rate 5.2% vs local median 3.9% in Conway — top-decile yield for the area; either an underpriced asset or a hidden risk that comps aren't pricing in. Stress-test before assuming the spread holds.
Location & tenants
- Location reads 69/100 on livability (#71 in AR) — a middle-class / working-renter tenant base. Strengths: cost of living A+, housing A+, schools B; Watch: employment C-, crime F, amenities F.
- Conway School District (urban): math 43% / reading 47% proficiency, ranked #36 of 238 in AR (top 15%) — families likely to look elsewhere, expect single-tenant / working-renter base with shorter leases.
- Market conditions: Rents soft (-0.3%/yr); 262 active listings in the ZIP; 3 comparable units currently listed for rent nearby; rentals at typical pace (median 14d on market — plan ~3-4 weeks tenant-placement turnaround); 865 units permitted in Faulkner County in 2024 (451 in 5+ unit buildings).
Forward outlook
- Local home prices are declining (-3.0%/yr); year-one equity from $456 of loan paydown is wiped out by about $2k of value loss. Plan a longer hold.
- Faulkner County population projected at +32% by 2050 — long-run rental-demand tailwind backs the buy-and-hold thesis.
Negotiation context
- It's been on market 320 days — a 12% lower offer ($58k) is reasonable based on typical stale-listing flexibility.
Risks & watch-outs
- Watch-outs: HOA is 40% of rent.
Questions for the listing agent
- What do current leases actually rent for vs. the listed asking? Can we see a recent rent roll and the last 12 months of T-12 income?
- It's been on market 320 days. Have you received any prior offers? Is the seller open to a 13% concession, seller financing, or rate buy-down credit?
- What does the HOA fee cover, when was the last increase, and are there any pending special assessments or reserve-fund shortfalls?
- Why hasn't it sold? Are there any deal-killer items the seller is aware of (foundation, flood, title, zoning, code violations)?
- Is there a deadline driving the sale (1031 exchange, divorce, estate, relocation)? That informs how much negotiation room exists.
- Schools are B-rated — typically a magnet for longer-tenancy family renters. What's the average tenant stay here, and is there a school-zone premium baked into asking?
- Crime grade is F in this area — have there been break-ins, vandalism, or insurance claims at this property in the last 3 years? What carrier currently insures it and at what premium?
- The area grade is low — what's the realistic commute time and amenity access for the typical tenant pool here? Any planned neighborhood developments (good or bad) we should know about?
- What's the average days-on-market for RENTAL listings here right now (not sales)? A rising rental-DOM trend means longer vacancies and softer asking-rent achievability than the comps imply.
- What's the recent tenant-quality profile in this submarket — average credit score on applications, eviction rate, late-payment / NSF rate, and stable-employment percentage? A property-management company in the area should have these aggregated.
- How much new for-sale + rental construction is in the pipeline within 1–3 miles? Heavy new supply typically softens prices + rents 12–24 months out; constrained supply supports both.
Investment metrics
- 1% rule
- 1.53% ✓
- Cap rate
- 5.19%
- Cash-on-cash
- -3.96%
- DSCR
- 0.82
- GRM
- 5.5
CMA / ARV
No comps found within radius.
Projected returns pro-forma
-3.0% appreciation · 0.0% rent growth · sell at horizon
- IRR
- -29.5%
- Equity multiple
- 0.07×
- Total profit
- $-17,263
- Equity at exit
- $9,840
- IRR
- -79.2%
- Equity multiple
- -0.64×
- Total profit
- $-30,368
- Equity at exit
- $5,706
Cash invested: $18,479 (down + closing). Projections, not guarantees.
Landlord ↔ Tenant lean methodology
- Overall (STATE)
- 92 Strongly Landlord-Friendly
- State Arkansas
- 92 Strongly Landlord-Friendly · R+14
- County
- — inherits STATE
- City
- — inherits STATE
ZIP-level market 72034
- Rents YoY
- -0.3%
- Active inventory
- 262
- Price-to-rent
- 5.5×
Monthly cashflow live
- Estimated rent
- $1,007 medium interval (Pro) →
- Mortgage (P&I)
- −$346
- Tax est. 1.5%
- −$82 /mo · $990/yr
- Insurance
- −$27
- HOA
- −$400
- Vacancy / Maint / Mgmt
- −$211
- Net cashflow
- $-61
Break-even live
UW: 25.0% down · 7.5% · 30yr · 1.5% tax · 5.0% vac · 8.0% maint · 8.0% mgmt
Financing live
Cash to close
- Down payment
- $16,499
- Closing costs
- $1,980
- Reserves months
- —
- Total cash needed
- —
Loan-product check · same deal, 3 products live
Conventional
25% down · 7.5% · 30yr
- Down + closing
- —
- Monthly P&I
- —
- Monthly cashflow
- —
- DSCR
- —
- Eligible?
- —
Personal DTI + credit; lowest rate.
DSCR
20% down · 8.5% · 30yr
- Down + closing
- —
- Monthly P&I
- —
- Monthly cashflow
- —
- DSCR
- —
- Eligible?
- —
No personal income docs; deal must DSCR.
Hard money
10% down · 12.0% · 12mo
- Down + closing
- —
- Monthly P&I
- —
- Monthly cashflow
- —
- DSCR
- —
- Eligible?
- —
Short-term bridge; refi at stabilization.
Rent comps 3 comps
| Address | Beds | Baths | Sqft | Rent | $/sqft | DOM | Units | Dist |
|---|---|---|---|---|---|---|---|---|
| 1313 McNutt Rd Conway, AR | 1.0–2.0 | 1.0 | 550 | $750 | $1.36 | 23d | 2 | 0.36mi |
| 901 S Salem Rd Conway, AR | 1.0–2.0 | 1.0–2.5 | 6579 | $1,599 | $0.24 | 14d | 12 | 1.27mi |
| 3300 Pebble Beach Rd Conway, AR | 1.0–2.0 | 1.0–2.0 | 818 | $1,025 | $1.25 | 14d | 1 | 1.43mi |
HOA detail
- Monthly dues
- $400 · $4,800/yr
Listing history 14 events
-
2026-06-18days on market $65,995 Active 320 DOM
-
2026-06-17days on market $65,995 Active 319 DOM
-
2026-06-16days on market $65,995 Active 318 DOM
-
2026-06-15days on market $65,995 Active 317 DOM
-
2026-06-14days on market $65,995 Active 315 DOM
-
2026-06-10days on market $65,995 Active 312 DOM
-
2026-06-09days on market $65,995 Active 311 DOM
-
2026-06-08days on market $65,995 Active 310 DOM
-
2026-06-07days on market $65,995 Active 309 DOM
-
2026-06-03days on market $65,995 Active 305 DOM
-
2026-06-02days on market $65,995 Active 304 DOM
-
2026-06-01days on market $65,995 Active 303 DOM
-
2026-05-31days on market $65,995 Active 302 DOM
-
2026-05-31days on market $65,995 Active 301 DOM
ⓘ Source: listings_history table (triggers on properties + properties_extension) + one-shot
backfill from property_details.listing_events for pre-trigger history.
Nearby sold comps map
Loading sold comps map…
Walkable amenities ~0.75 mi
Loading nearby amenities…
Taxation est. · year 1
- Rental income
- $12,078
- − Mortgage interest
- −$3,697
- − Property taxes
- −$990
- − Insurance
- −$330
- − Repairs & maintenance
- −$966
- − Management
- −$966
- − HOA
- −$4,800
- − Depreciation
- −$1,920
- Taxable loss
- −$1,591
- Est. tax savings @ 24.0%
- +$382
- After-tax cash flow
- $-349/yr
For passive investors: Depreciation is non-cash, so a rental often shows a tax loss while cash-flowing — sheltering income. Rental losses are passive: they offset passive income freely, and up to $25,000/yr can offset ordinary (W-2) income if you actively participate and your MAGI is under $100k (phasing out to $0 by $150k); unused losses carry forward. On sale, claimed depreciation is recaptured at up to 25%, and gains may owe capital-gains tax (a 1031 exchange can defer both). Figures are a year-1 estimate at your 24.0% rate — not tax advice; consult a CPA.
Schools (NCES district)
- District
- Conway School District
- NCES district ID
- 0504590
- Math proficiency
- 43% ▼ -17.00%
- Reading proficiency
- 47% ▼ -9.00%
- Median HH income
- $46,270
- Composite
- 38.27/100
- National rank
- #4236
- State rank
- #36 of 238 in AR
Livability — Conway
- Score
- 69/100
- State rank
- #71
- US rank
- #8673
Category grades
Schools grade is shown separately in the Schools card above.
Census & demographics
- Census place
- Conway, AR
- County
- Faulkner County · 103,634 people
- City population
- 84,754
- Metro
- Little Rock-North Little Rock-Conway, AR
- Population (ZIP)
- 50,285
- Household income
- $65,635
- Rent vs Own
- Severe rent burden
- 2282.0
Population outlook (Faulkner County) Hauer SSP2
- Today (2025)
- 138,985 people
- By 2030
- 148,264 · +6.7%
- By 2040
- 166,010 · +19.4%
- By 2050
- 183,362 · +31.9%
- By 2075
- 224,593 · +61.6%
- By 2100
- 250,603 · +80.3%
Race, ethnicity, and origin ACS 2023
- Neighborhood character
- Predominantly White (71%)
- Race & ethnicity
- White 71% Black 17% Hispanic / Latino 5% Two or more races 5% Asian 2%
- Hispanic origin (detail)
- Mexican 3%
- Common ancestry
- Slovak 2% Lithuanian 2% Italian 1%
- Foreign-born
- 4% · Canada, South Korea
- Languages at home
- 94% English-only · Spanish 3% Korean 1%
Political lean MEDSL · Faulkner
- 2024 margin
- Solid R (+32.3) · D 32.6% · R 64.9% · Other 2.5%
- 2008→2024 swing
- -7.1pp toward R · 2008: -25.3pp · 2024: -32.3pp
- All cycles
- 2024: R+32.3 2020: R+29.5 2016: R+31.6 2012: R+31.7 2008: R+25.3
Not yet ingested
- Civics
- —
Market trends
- HPI YoY
- ▼ -122.99%
- Current HPI
- 225.7805
- Rent YoY
- ▼ -0.28%
- Metro
- Little Rock-North Little Rock-Conway, AR
- State GDP YoY
- ▲ 3.80%
- F500 in state
- 10
Industry mix (Fortune 500 HQ in AR)
| Industry | F500 HQs | Revenue |
|---|---|---|
| Retail | 1 | $681B |
|
||
| Food / Agriculture | 1 | $53B |
|
||
| Retail / Energy | 1 | $22B |
|
||
| Transportation / Logistics | 1 | $12B |
|
||
| Energy | 1 | $4B |
|
||
Cash-flow waterfall
monthlySold comps — $/sqft
last 12 mo · ≤1 miLoading sold comps…