162 Private Road 3494 · Paradise, TX
Flood risk 1/10 · Minimal
- FEMA flood zone
- X (unshaded)
- Chance of flooding over 30 yrs
- 0.0%
- Est. flood insurance / yr
- $507 – $1,088
Fire risk 8/10 · Major
- Est. fire insurance / yr
- $1,222 – $2,270
Heat risk 7/10 · Major
- Hot days now (above 109°F)
- 7 days/yr
- Hot days in 30 yrs
- 21 days/yr
Wind risk 4/10 · Minor
- Chance of severe wind over 30 yrs
- 19.0%
Air-quality risk 2/10 · Minimal
- Unhealthy air days now
- 0 days/yr
- Unhealthy air days in 30 yrs
- 1 days/yr
Risk factors via First Street. Map © Google.
Why this score? — see what drove the D grade
The composite is a weighted blend of 9 inputs, each scored 0–100. Each bar is that input's sub-score; the figure is the points it added to the 100-point composite (weight × sub-score).
- Cash flow +12.7/30.0
- ARV discount +7.6/15.0
- Schools +5.0/10.0
- DSCR +3.8/10.0
- Livability +3.4/5.0
- 1% rule +2.9/10.0
- Rent growth +2.5/5.0
- Condition / age +2.5/5.0
- Appreciation +0.0/10.0
$256,500
🖨 Deal sheet (PDF) 📄 Offer letter ✓ Due diligence
Listing remarks
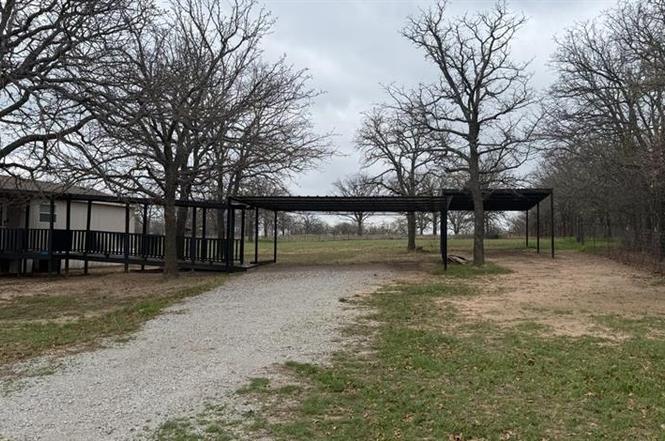
LOOKING TO BUILD YOUR DREAM HOME IN THE COUNTRY THEN LOOK NO FURTHER!! This 3.33-acre flat tract of land located in the beautiful countryside of Paradise is the perfect place to build you private home. The drive from any of the routes to the property is amazingly picturesque for what a drive in the country should be. With beautiful green pastures, grazing, happy cows, running creeks and trees, it's all you can imagine. From ranches and new development ranchettes along the way it makes for a very pleasant drive. In addition, the very well-maintained mobile home on the entrance side of the property is perfectly set up to move into to have while building your dream home on the lot to the south
Key facts
- 3.33-acre flat tract
- Green pastures
- Running creeks
Tags
Neighborhood map
What this means for you Summary
Snapshot
- This is a 3-bed/2.0-bath manufactured listed at $256k.
Deal economics
- At list price, monthly cash flow is $-27 ($-327/yr) — negative.
- To cash-flow at today's rent, offer at most $252k (1.9% below list).
- To meet the 1% rule (rent ≥ 1% of price), the offer needs to be $203k (20.9% below list).
- Recommended offer: $203k (20.9% below list) — sets the bar for 1% rule.
- Cap rate 6.2% vs local median 1.7% in Paradise — top-decile yield for the area; either an underpriced asset or a hidden risk that comps aren't pricing in. Stress-test before assuming the spread holds.
Location & tenants
- Location reads 67/100 on livability (#570 in TX) — a middle-class / working-renter tenant base. Strengths: cost of living A+, housing A+; Watch: employment C-, health & safety D+, crime D-.
- Paradise ISD (rural): math 58% / reading 59% proficiency, ranked #74 of 826 in TX (top 9%) — acceptable for families but not a draw, mixed tenant base, ~2y average lease.
- Zoned schools: Paradise El (math 42% / reading 47%, grade F, #1,155 of 4,322 statewide, top 29%, 436 students, 34% FRL); Paradise Middle (math 50% / reading 55%, grade C+, #293 of 1,662 statewide, top 18%, 293 students, 25% FRL); Paradise H S (math 67% / reading 77%, grade B+, #95 of 1,632 statewide, top 7%, 388 students, 24% FRL) — zoned schools at 28% FRL track the district average.
- Market conditions: 106 active listings in the ZIP; 460 units permitted in Wise County in 2024 (243 in 5+ unit buildings).
Forward outlook
- Local home prices are declining (-3.0%/yr); year-one equity from $2k of loan paydown is wiped out by about $8k of value loss. Plan a longer hold.
- Wise County population projected at +27% by 2050 — long-run rental-demand tailwind backs the buy-and-hold thesis.
Negotiation context
- It's been on market 44 days — a 3% lower offer ($249k) is reasonable based on typical stale-listing flexibility.
Risks & watch-outs
- Climate carrying-cost: severe wildfire risk; extreme-heat days projected 7→21/yr by 2055 (HVAC capex compounding) — expect insurance premiums to compound above CPI over the hold.
Questions for the listing agent
- What do current leases actually rent for vs. the listed asking? Can we see a recent rent roll and the last 12 months of T-12 income?
- It's been on market 44 days. Have you received any prior offers? Is the seller open to a 21% concession, seller financing, or rate buy-down credit?
- Is there a deadline driving the sale (1031 exchange, divorce, estate, relocation)? That informs how much negotiation room exists.
- Crime grade is D in this area — have there been break-ins, vandalism, or insurance claims at this property in the last 3 years? What carrier currently insures it and at what premium?
- The area grade is low — what's the realistic commute time and amenity access for the typical tenant pool here? Any planned neighborhood developments (good or bad) we should know about?
- What's the average days-on-market for RENTAL listings here right now (not sales)? A rising rental-DOM trend means longer vacancies and softer asking-rent achievability than the comps imply.
- What's the recent tenant-quality profile in this submarket — average credit score on applications, eviction rate, late-payment / NSF rate, and stable-employment percentage? A property-management company in the area should have these aggregated.
- How much new for-sale + rental construction is in the pipeline within 1–3 miles? Heavy new supply typically softens prices + rents 12–24 months out; constrained supply supports both.
Investment metrics
- 1% rule
- 0.79% ✗
- Cap rate
- 6.17%
- Cash-on-cash
- -0.46%
- DSCR
- 0.98
- GRM
- 10.5
CMA / ARV
- ARV (on-the-fly)
- $257,184
- Comps found
- 1
Show comp detail 1 sale within ~0.75 mi
| Address | Dist | Beds/Ba | Sqft | Sold | Price | $/sf | Match |
|---|---|---|---|---|---|---|---|
| 162 Private Road 3494 | 0.00mi | 3/2.0 | 1,368 (0%) | 1mo | $256,500 | $188 | 99 |
Match score weights: distance 35% · size 25% · config 20% · recency 20%. Top-matched comps best support the ARV.
Projected returns pro-forma
-3.0% appreciation · 3.0% rent growth · sell at horizon
- IRR
- -17.1%
- Equity multiple
- 0.40×
- Total profit
- $-43,356
- Equity at exit
- $38,245
- IRR
- -9.1%
- Equity multiple
- 0.44×
- Total profit
- $-40,219
- Equity at exit
- $22,177
Cash invested: $71,820 (down + closing). Projections, not guarantees.
Landlord ↔ Tenant lean methodology
- Overall (STATE)
- 87 Strongly Landlord-Friendly
- State Texas
- 87 Strongly Landlord-Friendly · R+5
- County
- — inherits STATE
- City
- — inherits STATE
ZIP-level market 76073
- Home prices YoY
- -13.9%
- Active inventory
- 106
- Price-to-rent
- 10.5×
Monthly cashflow live
- Estimated rent
- $2,029 medium interval (Pro) →
- Mortgage (P&I)
- −$1,345
- Tax from tax record
- −$178 /mo · $2,142/yr
- Insurance
- −$107
- HOA
- −$0
- Vacancy / Maint / Mgmt
- −$426
- Net cashflow
- $-27
Break-even live
Sensitivity live
| Price | -10% $118 | -5% $45 | +0% $-27 | +5% $-100 | +10% $-172 |
|---|---|---|---|---|---|
| Rent | -10% $-188 | -5% $-107 | +0% $-27 | +5% $53 | +10% $133 |
| Rate | -1.0pp $102 | -0.5pp $38 | base $-27 | +0.5pp $-94 | +1.0pp $-161 |
UW: 25.0% down · 7.5% · 30yr · 1.5% tax · 5.0% vac · 8.0% maint · 8.0% mgmt
Financing live
Cash to close
- Down payment
- $64,125
- Closing costs
- $7,695
- Reserves months
- —
- Total cash needed
- —
Loan-product check · same deal, 3 products live
Conventional
25% down · 7.5% · 30yr
- Down + closing
- —
- Monthly P&I
- —
- Monthly cashflow
- —
- DSCR
- —
- Eligible?
- —
Personal DTI + credit; lowest rate.
DSCR
20% down · 8.5% · 30yr
- Down + closing
- —
- Monthly P&I
- —
- Monthly cashflow
- —
- DSCR
- —
- Eligible?
- —
No personal income docs; deal must DSCR.
Hard money
10% down · 12.0% · 12mo
- Down + closing
- —
- Monthly P&I
- —
- Monthly cashflow
- —
- DSCR
- —
- Eligible?
- —
Short-term bridge; refi at stabilization.
Listing history 4 events
-
2026-04-24status Pending
-
2026-04-19historical Active Option Contract
-
2026-03-20price $256,500
-
2026-03-11$257,000 Active
ⓘ Source: listings_history table (triggers on properties + properties_extension) + one-shot
backfill from property_details.listing_events for pre-trigger history.
Tax reassessment forecast TX · Resets to sale price
- Current annual tax
- $2,142 · $178/mo
- Projected year-2 tax
- $4,694 · $391/mo
- Expected delta
- +$2,552/yr (+$213/mo · 119.2%)
ⓘ Screening estimate from a state-policy table — verify with the county assessor before closing.
Climate risk First Street
- Flood 1/10 Low FEMA zone X (unshaded) · 0% chance over 30 yrs
- Wildfire 8/10 Severe
- Heat 7/10 Severe 7 d/yr ≥109°F today · 21 d/yr by 30 yrs out
- Wind 4/10 Moderate 19% chance of damaging wind over 30 yrs
- Air quality 2/10 Low 0 unhealthy d/yr today · 1 by 30 yrs out
Nearby sold comps map
Loading sold comps map…
Walkable amenities ~0.75 mi
Loading nearby amenities…
Taxation est. · year 1
- Rental income
- $24,353
- − Mortgage interest
- −$14,368
- − Property taxes
- −$2,142
- − Insurance
- −$1,282
- − Repairs & maintenance
- −$1,948
- − Management
- −$1,948
- − Depreciation
- −$7,462
- Taxable loss
- −$4,798
- Est. tax savings @ 24.0%
- +$1,151
- After-tax cash flow
- $824/yr
For passive investors: Depreciation is non-cash, so a rental often shows a tax loss while cash-flowing — sheltering income. Rental losses are passive: they offset passive income freely, and up to $25,000/yr can offset ordinary (W-2) income if you actively participate and your MAGI is under $100k (phasing out to $0 by $150k); unused losses carry forward. On sale, claimed depreciation is recaptured at up to 25%, and gains may owe capital-gains tax (a 1031 exchange can defer both). Figures are a year-1 estimate at your 24.0% rate — not tax advice; consult a CPA.
Schools (NCES district)
- District
- Paradise ISD
- NCES district ID
- 4834260
- Math proficiency
- 58% ▼ -2.00%
- Reading proficiency
- 59% ▲ 6.00%
- Median HH income
- $56,115
- Composite
- 50.42/100
- National rank
- #1871
- State rank
- #74 of 826 in TX
Livability — Paradise
- Score
- 67/100
- State rank
- #570
- US rank
- #10880
Category grades
Schools grade is shown separately in the Schools card above.
Census & demographics
- Population (ZIP)
- 7,267
Population outlook (Wise County) Hauer SSP2
- Today (2025)
- 71,620 people
- By 2030
- 75,858 · +5.9%
- By 2040
- 83,908 · +17.2%
- By 2050
- 90,717 · +26.7%
- By 2075
- 107,583 · +50.2%
- By 2100
- 114,996 · +60.6%
Race, ethnicity, and origin ACS 2023
- Neighborhood character
- Predominantly White (84%)
- Race & ethnicity
- White 84% Hispanic / Latino 10% Two or more races 7%
- Hispanic origin (detail)
- Mexican 9%
- Common ancestry
- Italian 4% Iranian 3% Slovak 2%
- Foreign-born
- 2% · Canada
- Languages at home
- 94% English-only · Spanish 6%
Political lean MEDSL · Wise
- 2024 margin
- Solid R (+70.0) · D 14.7% · R 84.7%
- 2008→2024 swing
- -14.3pp toward R · 2008: -55.7pp · 2024: -70.0pp
- All cycles
- 2024: R+70.0 2020: R+68.2 2016: R+69.9 2012: R+67.5 2008: R+55.7
Not yet ingested
- Civics
- —
Market trends
- HPI YoY
- ▼ -42.57%
- Current HPI
- 263.5271
- Rent YoY
- —
- Metro
- —
- State GDP YoY
- ▲ 3.95%
- F500 in state
- 110
Industry mix (Fortune 500 HQ in TX)
| Industry | F500 HQs | Revenue |
|---|---|---|
| Energy | 16 | $1,198B |
|
||
| Technology | 5 | $198B |
|
||
| Engineering / Construction | 4 | $72B |
|
||
| Energy Services | 3 | $60B |
|
||
| Utilities | 3 | $41B |
|
||
| Healthcare | 2 | $330B |
|
||
Price history
-0.2% since first listed4 events — show timeline
- 2026-04-24 Pending — NTREIS
- 2026-04-19 Contingent — NTREIS
- 2026-03-20 Price Changed $256,500 NTREIS
- 2026-03-11 Listed $257,000 NTREIS
Property tax history
+8.3%/yrLatest (2025): $2,142 · +21.0% YoY. Source: county tax records.
Cash-flow waterfall
monthlySold comps — $/sqft
last 12 mo · ≤1 miLoading sold comps…