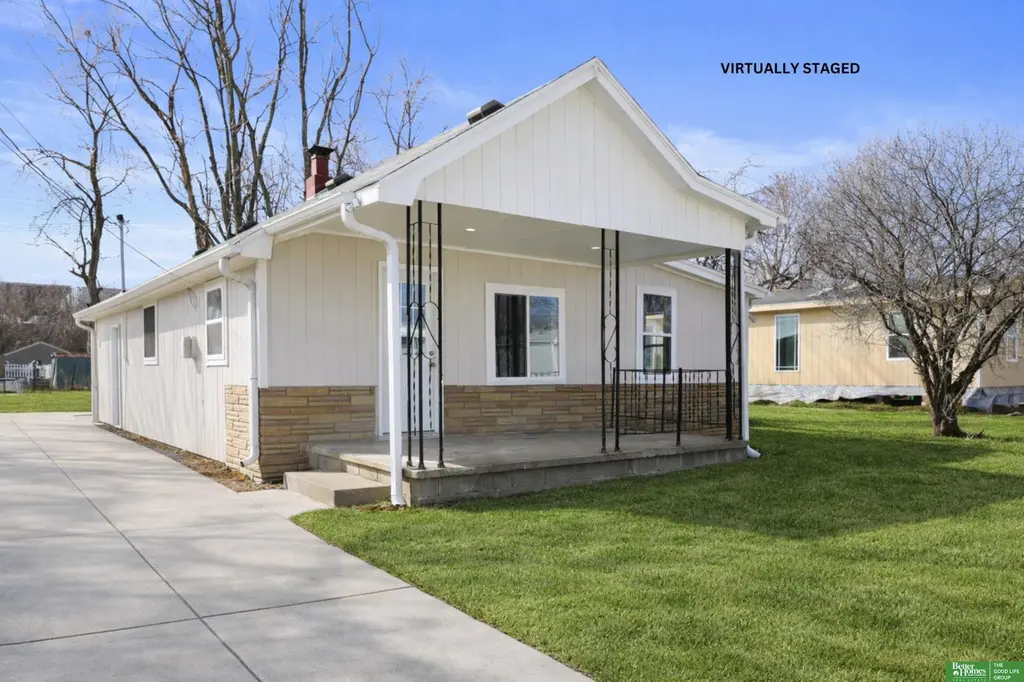
3115 12th Ave · Council Bluffs, IA
Flood risk 1/10 · Minimal
- FEMA flood zone
- X
- Chance of flooding over 30 yrs
- 0.0%
- Est. flood insurance / yr
- $507 – $1,088
Fire risk 2/10 · Minimal
- Est. fire insurance / yr
- $902 – $1,676
Heat risk 3/10 · Minor
- Hot days now (above 104°F)
- 7 days/yr
- Hot days in 30 yrs
- 15 days/yr
Wind risk 2/10 · Minimal
- Chance of severe wind over 30 yrs
- —
Air-quality risk 2/10 · Minimal
- Unhealthy air days now
- 1 days/yr
- Unhealthy air days in 30 yrs
- 1 days/yr
Risk factors via First Street. Map © Google.
Why this score? — see what drove the D grade
The composite is a weighted blend of 9 inputs, each scored 0–100. Each bar is that input's sub-score; the figure is the points it added to the 100-point composite (weight × sub-score).
- ARV discount +11.1/15.0
- Cash flow +11.0/30.0
- Schools +4.5/10.0
- Livability +3.5/5.0
- DSCR +3.2/10.0
- 1% rule +3.0/10.0
- Rent growth +2.6/5.0
- Condition / age +2.5/5.0
- Appreciation +0.0/10.0
$157,900
🖨 Deal sheet (PDF) 📄 Offer letter ✓ Due diligence
Listing remarks MLS
Fully renovated 3-bedroom, 1-bath home offering modern updates and move-in-ready convenience. This home features new flooring throughout, fresh interior paint, stainless steel appliances, and numerous recent upgrades including new A/C, water heater, windows, and siding. The bright and functional layout creates a comfortable living space perfect for everyday living. A great opportunity to own a beautifully updated home with major improvements already completed.
Key facts
- New flooring
- New water heater
- New a/c
Tags
Neighborhood map
What this means for you Summary
Snapshot
- This is a 3-bed/1.0-bath single-family listed at $158k.
Deal economics
- At list price, monthly cash flow is $-66 ($-798/yr) — negative.
- To cash-flow at today's rent, offer at most $146k (7.4% below list).
- To meet the 1% rule (rent ≥ 1% of price), the offer needs to be $126k (20.0% below list).
- Recommended offer: $126k (20.0% below list) — sets the bar for 1% rule.
- Cap rate 5.8% vs local median 3.3% in Council Bluffs — top-decile yield for the area; either an underpriced asset or a hidden risk that comps aren't pricing in. Stress-test before assuming the spread holds.
Location & tenants
- Location reads 70/100 on livability (#368 in IA) — a middle-class / working-renter tenant base. Strengths: cost of living A+, housing A+, health & safety B+; Watch: employment C-, amenities D, crime D-.
- Council Bluffs Community School District (urban): math 52% / reading 55% proficiency, ranked #272 of 289 in IA (top 94%) — acceptable for families but not a draw, mixed tenant base, ~2y average lease.
- Market conditions: Rents flat; 140 active listings in the ZIP; 20 comparable units currently listed for rent nearby; rentals at typical pace (median 25d on market — plan ~3-4 weeks tenant-placement turnaround); 40% of comp listings sitting > 30 days — soft ceiling on asking rent; 679 units permitted in Pottawattamie County in 2024 (566 in 5+ unit buildings).
Forward outlook
- Local home prices are declining (-3.0%/yr); year-one equity from $1k of loan paydown is wiped out by about $5k of value loss. Plan a longer hold.
- Pottawattamie County population projected to shrink 7% by 2050 — rents likely to lag national; underwrite the cash flow, not the appreciation.
Negotiation context
- It's been on market 76 days — a 6% lower offer ($148k) is reasonable based on typical stale-listing flexibility.
- 3 sale attempts since 8y ago; this cycle's ask has dropped $11k (7%) from the opening price — seller is motivated, your offer sets the floor, not the list.
- Current owner paid $35k; list at $158k implies a 351% gain — meaningful room to come down on a strong offer.
Risks & watch-outs
- Watch-outs: built in 1940 — expect roof / HVAC / electrical / plumbing capex.
Questions for the listing agent
- What do current leases actually rent for vs. the listed asking? Can we see a recent rent roll and the last 12 months of T-12 income?
- It's been on market 76 days. Have you received any prior offers? Is the seller open to a 20% concession, seller financing, or rate buy-down credit?
- Built in 1940 — when were the roof, HVAC, electrical panel, plumbing, and water heater last replaced?
- Why hasn't it sold? Are there any deal-killer items the seller is aware of (foundation, flood, title, zoning, code violations)?
- Is there a deadline driving the sale (1031 exchange, divorce, estate, relocation)? That informs how much negotiation room exists.
- Crime grade is D in this area — have there been break-ins, vandalism, or insurance claims at this property in the last 3 years? What carrier currently insures it and at what premium?
- The area grade is low — what's the realistic commute time and amenity access for the typical tenant pool here? Any planned neighborhood developments (good or bad) we should know about?
- What's the average days-on-market for RENTAL listings here right now (not sales)? A rising rental-DOM trend means longer vacancies and softer asking-rent achievability than the comps imply.
- What's the recent tenant-quality profile in this submarket — average credit score on applications, eviction rate, late-payment / NSF rate, and stable-employment percentage? A property-management company in the area should have these aggregated.
- How much new for-sale + rental construction is in the pipeline within 1–3 miles? Heavy new supply typically softens prices + rents 12–24 months out; constrained supply supports both.
Investment metrics
- 1% rule
- 0.80% ✗
- Cap rate
- 5.79%
- Cash-on-cash
- -1.80%
- DSCR
- 0.92
- GRM
- 10.4
CMA / ARV
- ARV (median comp)
- $171,474
- List price
- $157,900
- Delta
- -7.92%
- Verdict
- FAIR
- Comps
- 20 within 1.0 mi
Show comp detail 12 sales within ~0.75 mi
| Address | Dist | Beds/Ba | Sqft | Sold | Price | $/sf | Match |
|---|---|---|---|---|---|---|---|
| 3100 11th Ave | 0.09mi | 3/1.0 | 1,066 (+3%) | 4mo | $129,000 | $121 | 88 |
| 917 Spruce St | 0.21mi | 2/1.0 (-1) | 1,018 (-2%) | 4mo | $195,000 | $192 | 79 |
| 3233 2nd Ave | 0.62mi | 3/1.0 | 1,016 (-2%) | 4mo | $165,000 | $162 | 65 |
| 3227 2nd Ave | 0.62mi | 2/1.0 (-1) | 1,084 (+5%) | 1mo | $103,000 | $95 | 58 |
| 2621 6th Ave | 0.62mi | 2/1.0 (-1) | 1,053 (+2%) | 8mo | $85,000 | $81 | 57 |
| 3439 5th Ave | 0.54mi | 2/1.0 (-1) | 994 (-4%) | 11mo | $194,000 | $195 | 54 |
| 3126 4th Ave | 0.51mi | 3/1.5 | 1,175 (+13%) | 5mo | $195,000 | $166 | 48 |
| 2709 2nd Ave | 0.72mi | 2/1.0 (-1) | 943 (-9%) | 1mo | $215,000 | $228 | 45 |
| 3431 5th Ave | 0.53mi | 2/1.0 (-1) | 886 (-14%) | 1mo | $169,000 | $191 | 45 |
| 403 S 28th St | 0.58mi | 3/2.0 | 1,162 (+12%) | 11mo | $180,000 | $155 | 40 |
| 2733 2nd Ave | 0.70mi | 4/1.0 (+1) | 1,152 (+11%) | 6mo | $145,000 | $126 | 39 |
| 2719 6th Ave | 0.53mi | 2/1.0 (-1) | 896 (-14%) | 11mo | $187,700 | $209 | 39 |
Match score weights: distance 35% · size 25% · config 20% · recency 20%. Top-matched comps best support the ARV.
Projected returns pro-forma
-3.0% appreciation · 0.56% rent growth · sell at horizon
- IRR
- -22.0%
- Equity multiple
- 0.26×
- Total profit
- $-32,846
- Equity at exit
- $23,543
- IRR
- -23.0%
- Equity multiple
- -0.04×
- Total profit
- $-45,877
- Equity at exit
- $13,652
Cash invested: $44,212 (down + closing). Projections, not guarantees.
Landlord ↔ Tenant lean methodology
- Overall (STATE)
- 83 Strongly Landlord-Friendly
- State Iowa
- 83 Strongly Landlord-Friendly · R+6
- County
- — inherits STATE
- City
- — inherits STATE
ZIP-level market 51501
- Rents YoY
- 0.6%
- Active inventory
- 140
- Price-to-rent
- 10.4×
Monthly cashflow live
- Estimated rent
- $1,264 high interval (Pro) →
- Mortgage (P&I)
- −$828
- Tax from tax record
- −$171 /mo · $2,051/yr
- Insurance
- −$66
- HOA
- −$0
- Vacancy / Maint / Mgmt
- −$265
- Net cashflow
- $-66
Break-even live
Sensitivity live
| Price | -10% $23 | -5% $-22 | +0% $-66 | +5% $-111 | +10% $-156 |
|---|---|---|---|---|---|
| Rent | -10% $-166 | -5% $-116 | +0% $-66 | +5% $-17 | +10% $33 |
| Rate | -1.0pp $13 | -0.5pp $-26 | base $-66 | +0.5pp $-107 | +1.0pp $-149 |
UW: 25.0% down · 7.5% · 30yr · 1.5% tax · 5.0% vac · 8.0% maint · 8.0% mgmt
Financing live
Cash to close
- Down payment
- $39,475
- Closing costs
- $4,737
- Reserves months
- —
- Total cash needed
- —
Loan-product check · same deal, 3 products live
Conventional
25% down · 7.5% · 30yr
- Down + closing
- —
- Monthly P&I
- —
- Monthly cashflow
- —
- DSCR
- —
- Eligible?
- —
Personal DTI + credit; lowest rate.
DSCR
20% down · 8.5% · 30yr
- Down + closing
- —
- Monthly P&I
- —
- Monthly cashflow
- —
- DSCR
- —
- Eligible?
- —
No personal income docs; deal must DSCR.
Hard money
10% down · 12.0% · 12mo
- Down + closing
- —
- Monthly P&I
- —
- Monthly cashflow
- —
- DSCR
- —
- Eligible?
- —
Short-term bridge; refi at stabilization.
Rent comps 20 comps
| Address | Beds | Baths | Sqft | Rent | $/sqft | DOM | Units | Dist |
|---|---|---|---|---|---|---|---|---|
| 1025 S 34th St Council Bluffs, IA | 3.0 | 2.0 | 1470 | $1,650 | $1.12 | 15d | 1 | 0.23mi |
| 10 N 31st St Unit A Council Bluffs, IA | 2.0 | 1.0 | 840 | $795 | $0.95 | 44d | 1 | 0.80mi |
| 2523 3rd Ave Unit 8 Council Bluffs, IA | 2.0 | 1.0 | 720 | $750 | $1.04 | 44d | 1 | 0.81mi |
| 3726 3rd Ave Apt E Council Bluffs, IA | 2.0 | 1.0 | 748 | $895 | $1.20 | 44d | 1 | 0.90mi |
| 2436 3rd Ave Unit 04 Council Bluffs, IA | 2.0 | 1.0 | 768 | $950 | $1.24 | 44d | 1 | 0.92mi |
| 2404 Avenue B Unit B Council Bluffs, IA | 2.0 | 1.0 | 1014 | $1,585 | $1.56 | 44d | 1 | 1.19mi |
| 20 S 41st St Council Bluffs, IA | 2.0 | 1.0–2.0 | 709 | $1,640 | $2.31 | 2d | 14 | 1.21mi |
| 806 N 34th St Council Bluffs, IA | 2.0 | 1.0 | 942 | $1,062 | $1.13 | 44d | 11 | 1.28mi |
| 806 N 34th St Council Bluffs, IA | 1.0–2.0 | 1.0 | 776 | $1,105 | $1.42 | 2d | 16 | 1.28mi |
| 806 N 34th St Unit 802-6 Council Bluffs, IA | 2.0 | 1.0 | 930 | $1,090 | $1.17 | 24d | 1 | 1.28mi |
| 806 N 34th St Unit 805-17 Council Bluffs, IA | 2.0 | 1.0 | 955 | $1,125 | $1.18 | 24d | 1 | 1.28mi |
| 806 N 34th St Unit 803-2 Council Bluffs, IA | 2.0 | 1.0 | 955 | $1,115 | $1.17 | 24d | 1 | 1.28mi |
| 806 N 34th St Unit 802-2 Council Bluffs, IA | 2.0 | 1.0 | 955 | $1,079 | $1.13 | 24d | 1 | 1.28mi |
| 806 N 34th St Unit 805-4 Council Bluffs, IA | 2.0 | 1.0 | 930 | $1,049 | $1.13 | 24d | 1 | 1.28mi |
| 806 N 34th St Unit 803-14 Council Bluffs, IA | 2.0 | 1.0 | 930 | $1,000 | $1.08 | 22d | 1 | 1.28mi |
| 3611 Avenue G Unit 1 Council Bluffs, IA | 2.0 | 1.0 | 1080 | $1,050 | $0.97 | 44d | 1 | 1.29mi |
| 4141 Rivers Edge Pkwy Council Bluffs, IA | 2.0 | 1.0–2.0 | 808 | $1,900 | $2.35 | 2d | 8 | 1.31mi |
| 415 Leavenworth St Omaha, NE | 1.0–2.0 | 1.0–2.0 | 881 | $2,395 | $2.72 | 2d | 38 | 1.41mi |
| 4123 Avenue C Council Bluffs, IA | 2.0 | 1.0 | 985 | $1,100 | $1.12 | 44d | 1 | 1.43mi |
| 1222 N 31st St Council Bluffs, IA | 2.0–4.0 | 1.0 | 1031 | $1,186 | $1.15 | 2d | 7 | 1.49mi |
Listing history 21 events
-
2026-06-18days on market $157,900 Active 76 DOM
-
2026-06-17days on market $157,900 Active 75 DOM
-
2026-06-16days on market $157,900 Active 74 DOM
-
2026-06-15days on market $157,900 Active 73 DOM
-
2026-06-13days on market $157,900 Active 71 DOM
-
2026-06-10days on market $157,900 Active 68 DOM
-
2026-06-09days on market $157,900 Active 67 DOM
-
2026-06-08days on market $157,900 Active 66 DOM
-
2026-06-07days on market $157,900 Active 65 DOM
-
2026-06-05days on market $157,900 Active 62 DOM
-
2026-06-03days on market $157,900 Active 61 DOM
-
2026-06-03days on market $157,900 Active 60 DOM
-
2026-06-01pricedays on market $157,900 Active 59 DOM
-
2026-05-31days on market $164,500 Active 58 DOM
-
2026-04-13price $164,500 464-char remark
Show marketing remark (464 chars)
Fully renovated 3-bedroom, 1-bath home offering modern updates and move-in-ready convenience. This home features new flooring throughout, fresh interior paint, stainless steel appliances, and numerous recent upgrades including new A/C, water heater, windows, and siding. The bright and functional layout creates a comfortable living space perfect for everyday living. A great opportunity to own a beautifully updated home with major improvements already completed.
-
2026-03-10$169,000 Active 464-char remark
Show marketing remark (464 chars)
Fully renovated 3-bedroom, 1-bath home offering modern updates and move-in-ready convenience. This home features new flooring throughout, fresh interior paint, stainless steel appliances, and numerous recent upgrades including new A/C, water heater, windows, and siding. The bright and functional layout creates a comfortable living space perfect for everyday living. A great opportunity to own a beautifully updated home with major improvements already completed.
-
2026-03-10$169,000 New 464-char remark
Show marketing remark (464 chars)
Fully renovated 3-bedroom, 1-bath home offering modern updates and move-in-ready convenience. This home features new flooring throughout, fresh interior paint, stainless steel appliances, and numerous recent upgrades including new A/C, water heater, windows, and siding. The bright and functional layout creates a comfortable living space perfect for everyday living. A great opportunity to own a beautifully updated home with major improvements already completed.
-
2018-02-05soldstatus $35,000
-
2018-02-02soldstatus $35,000
-
2018-01-10$39,900
ⓘ Source: listings_history table (triggers on properties + properties_extension) + one-shot
backfill from property_details.listing_events for pre-trigger history.
Tax reassessment forecast IA · Partial reset (capped growth)
- Current annual tax
- $2,051 · $171/mo
- Projected year-2 tax
- $2,265 · $189/mo
- Expected delta
- +$214/yr (+$18/mo · 10.4%)
ⓘ Screening estimate from a state-policy table — verify with the county assessor before closing.
Climate risk First Street
- Flood 1/10 Low FEMA zone X · 0% chance over 30 yrs
- Wildfire 2/10 Low
- Heat 3/10 Moderate 7 d/yr ≥104°F today · 15 d/yr by 30 yrs out
- Wind 2/10 Low
- Air quality 2/10 Low 1 unhealthy d/yr today · 1 by 30 yrs out
Nearby sold comps map
Loading sold comps map…
Walkable amenities ~0.75 mi
Loading nearby amenities…
Taxation est. · year 1
- Rental income
- $15,164
- − Mortgage interest
- −$8,845
- − Property taxes
- −$2,051
- − Insurance
- −$790
- − Repairs & maintenance
- −$1,213
- − Management
- −$1,213
- − Depreciation
- −$4,593
- Taxable loss
- −$3,541
- Est. tax savings @ 24.0%
- +$850
- After-tax cash flow
- $52/yr
For passive investors: Depreciation is non-cash, so a rental often shows a tax loss while cash-flowing — sheltering income. Rental losses are passive: they offset passive income freely, and up to $25,000/yr can offset ordinary (W-2) income if you actively participate and your MAGI is under $100k (phasing out to $0 by $150k); unused losses carry forward. On sale, claimed depreciation is recaptured at up to 25%, and gains may owe capital-gains tax (a 1031 exchange can defer both). Figures are a year-1 estimate at your 24.0% rate — not tax advice; consult a CPA.
Schools (NCES district)
- District
- Council Bluffs Community School District
- NCES district ID
- 1908220
- Math proficiency
- 52% ▼ -9.00%
- Reading proficiency
- 55% ▼ -1.00%
- Median HH income
- $45,259
- Composite
- 45.23/100
- National rank
- #2665
- State rank
- #272 of 289 in IA
Livability — Council Bluffs
- Score
- 70/100
- State rank
- #368
- US rank
- #7695
Category grades
Schools grade is shown separately in the Schools card above.
Census & demographics
- Census place
- Council Bluffs, IA
- County
- Pottawattamie County · 72,590 people
- City population
- 72,590
- Metro
- Omaha-Council Bluffs, NE-IA
- Population (ZIP)
- 34,618
- Household income
- $59,843
- Rent vs Own
- Severe rent burden
- 1110.0
Population outlook (Pottawattamie County) Hauer SSP2
- Today (2025)
- 93,683 people
- By 2030
- 92,772 · -1.0%
- By 2040
- 89,917 · -4.0%
- By 2050
- 86,994 · -7.1%
- By 2075
- 82,756 · -11.7%
- By 2100
- 79,097 · -15.6%
Race, ethnicity, and origin ACS 2023
- Neighborhood character
- Predominantly White (79%)
- Race & ethnicity
- White 79% Hispanic / Latino 14% Two or more races 8% Asian 2% Black 2%
- Hispanic origin (detail)
- Mexican 13%
- Common ancestry
- Portuguese 2% Romanian 2% Iranian 1%
- Foreign-born
- 6% · Canada, China
- Languages at home
- 90% English-only · Spanish 8% Chinese 1%
Political lean MEDSL · Pottawattamie
- 2024 margin
- R (+20.0) · D 39.3% · R 59.3% · Other 1.4%
- 2008→2024 swing
- -18.1pp toward R · 2008: -1.9pp · 2024: -20.0pp
- All cycles
- 2024: R+20.0 2020: R+16.8 2016: R+21.6 2012: R+5.8 2008: R+1.9
Not yet ingested
- Civics
- —
Market trends
- HPI YoY
- ▼ -187.49%
- Current HPI
- 215.2532
- Rent YoY
- ▲ 0.56%
- Metro
- Omaha-Council Bluffs, NE-IA
- State GDP YoY
- ▲ 2.48%
- F500 in state
- 4
Industry mix (Fortune 500 HQ in IA)
| Industry | F500 HQs | Revenue |
|---|---|---|
| Financial Services | 1 | $16B |
|
||
| Retail / Convenience | 1 | $15B |
|
||
Price history
+312.3% since first listed7 events — show timeline
- 2026-04-13 Price Changed $164,500 SWIAR
- 2026-04-13 Price Changed $164,500 GPRMLS
- 2026-03-10 Listed $169,000 SWIAR
- 2026-03-10 Listed $169,000 GPRMLS
- 2018-02-05 Sold (Public Records) $35,000 Public Records
- 2018-02-02 Sold (MLS) $35,000 SWIAR
- 2018-01-10 Listed $39,900 SWIAR
Property tax history
+7.4%/yrLatest (2025): $2,051 · -14.0% YoY. Source: county tax records.
Cash-flow waterfall
monthlySold comps — $/sqft
last 12 mo · ≤1 miLoading sold comps…