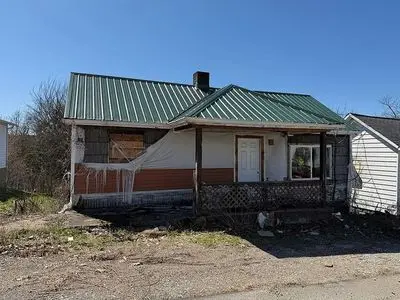
1348 Paradise Ave · Washington, PA
Flood risk 1/10 · Minimal
- FEMA flood zone
- X (unshaded)
- Chance of flooding over 30 yrs
- 0.0%
- Est. flood insurance / yr
- $473 – $860
Fire risk 1/10 · Minimal
- Est. fire insurance / yr
- $511 – $949
Heat risk 3/10 · Minor
- Hot days now (above 97°F)
- 7 days/yr
- Hot days in 30 yrs
- 18 days/yr
Wind risk 2/10 · Minimal
- Chance of severe wind over 30 yrs
- —
Air-quality risk 2/10 · Minimal
- Unhealthy air days now
- 1 days/yr
- Unhealthy air days in 30 yrs
- 2 days/yr
Risk factors via First Street. Map © Google.
Why this score? — see what drove the C grade
The composite is a weighted blend of 9 inputs, each scored 0–100. Each bar is that input's sub-score; the figure is the points it added to the 100-point composite (weight × sub-score).
- Cash flow +15.0/30.0
- Appreciation +10.0/10.0
- ARV discount +7.5/15.0
- 1% rule +5.0/10.0
- DSCR +5.0/10.0
- Livability +4.2/5.0
- Schools +3.9/10.0
- Rent growth +2.5/5.0
- Condition / age +2.5/5.0
$26,000
🖨 Deal sheet 📄 Offer letter ✓ Due diligence
Listing remarks MLS
Opportunity awaits with this 2-bedroom, 1-bath property offering strong potential for renovation or investment. Situated on a manageable lot with on-street parking, this home is ideal for buyers looking to add value and create something truly their own. The property features a traditional layout and solid footprint, providing a great starting point for a full rehab or restoration project. With the right vision, this space can be transformed into a charming residence or income-producing asset. Conveniently located with easy access to local amenities, this is a great opportunity for investors, contractors, or buyers seeking a project property with upside potential.
Key facts
- Metal roof
- New siding
- New doors
Tags
Neighborhood map
What this means for you Summary
Snapshot
- This is a 2-bed/1.0-bath single-family listed at $26k.
Deal economics
- At list price, monthly cash flow is $1k ($13k/yr) — positive.
- The deal already cash-flows at list — no discount required.
- Meets the 1% rule at list price ($2k rent vs $26k).
- Recommended offer: $25k (3.0% below list) — sets the bar for market timing.
- Cap rate 56.0% vs local median 2.8% in Washington — top-decile yield for the area; either an underpriced asset or a hidden risk that comps aren't pricing in. Stress-test before assuming the spread holds.
Location & tenants
- Location reads 85/100 on livability (#77 in PA, #558 nationally) — a professional / high-income tenant draw. Strengths: amenities A+, commute A+, cost of living A+; Watch: employment D-.
- Belle Vernon Area SD (suburban): math 34% / reading 56% proficiency, ranked #267 of 539 in PA (top 50%) — families likely to look elsewhere, expect single-tenant / working-renter base with shorter leases.
- Market conditions: 93 active listings in the ZIP; 1 comparable units currently listed for rent nearby; 201 units permitted in Fayette County in 2024 (10 in 5+ unit buildings).
Forward outlook
- In year one you build about $3k of equity ($180 loan paydown + $3k appreciation (10.0% local appreciation)).
- Fayette County population projected at -19% by 2050 — secular population decline; favor cash flow + early exit over multi-decade hold.
- At projected returns (10.0% appreciation + 3.0% rent growth), your $7k cash investment doubles in ~1 year — after that, you're playing with house money.
- By year 10, paydown + projected appreciation supports a ~$34k cash-out refi (75% LTV) — recoverable capital for the next deal without selling this one.
Negotiation context
- It's been on market 38 days — a 3% lower offer ($25k) is reasonable based on typical stale-listing flexibility.
- 2 sale attempts with the ask held roughly flat each time — persistent listings suggest the price (not the market) is what's stuck; bring a comps-based counter.
Risks & watch-outs
- Watch-outs: property tax is 3.7% of price; built in 1930 — expect roof / HVAC / electrical / plumbing capex.
Questions for the listing agent
- It's been on market 38 days. Have you received any prior offers? Is the seller open to a 3% concession, seller financing, or rate buy-down credit?
- Built in 1930 — when were the roof, HVAC, electrical panel, plumbing, and water heater last replaced?
- Property tax is high relative to price — has the assessment been appealed recently, and will the sale trigger a re-assessment?
- Is there a deadline driving the sale (1031 exchange, divorce, estate, relocation)? That informs how much negotiation room exists.
- Schools are B-rated — typically a magnet for longer-tenancy family renters. What's the average tenant stay here, and is there a school-zone premium baked into asking?
- What's the average days-on-market for RENTAL listings here right now (not sales)? A rising rental-DOM trend means longer vacancies and softer asking-rent achievability than the comps imply.
- What's the recent tenant-quality profile in this submarket — average credit score on applications, eviction rate, late-payment / NSF rate, and stable-employment percentage? A property-management company in the area should have these aggregated.
- How much new for-sale + rental construction is in the pipeline within 1–3 miles? Heavy new supply typically softens prices + rents 12–24 months out; constrained supply supports both.
Investment metrics
- 1% rule
- 6.35% ✓
- Cap rate
- 55.97%
- Cash-on-cash
- 177.43%
- DSCR
- 8.89
- GRM
- 1.3
CMA / ARV
- ARV (on-the-fly)
- $147,200
- Comps found
- 5
Show comp detail 5 sales within ~0.75 mi
| Address | Dist | Beds/Ba | Sqft | Sold | Price | $/sf | Match |
|---|---|---|---|---|---|---|---|
| 1340 Paradise Ave | 0.08mi | 2/1.0 | 1,387 (+8%) | 16mo | $160,000 | $115 | 69 |
| 2 Nellie Ave | 0.64mi | 3/2.5 (+1) | 1,289 (+1%) | 16mo | $375,000 | $291 | 45 |
| 107 Perry Ave | 0.40mi | 3/1.0 (+1) | 1,136 (-11%) | 17mo | $113,000 | $99 | 44 |
| 225 Dent St | 0.12mi | 3/1.5 (+1) | 1,470 (+15%) | 24mo | $159,900 | $109 | 43 |
| 16 Railroad St | 0.75mi | 3/2.0 (+1) | 1,281 (+0%) | 22mo | $190,000 | $148 | 38 |
Match score weights: distance 35% · size 25% · config 20% · recency 20%. Top-matched comps best support the ARV.
Projected returns pro-forma
10.0% appreciation · 3.0% rent growth · sell at horizon
- IRR
- —
- Equity multiple
- 12.37×
- Total profit
- $82,771
- Equity at exit
- $23,423
- IRR
- —
- Equity multiple
- 27.09×
- Total profit
- $189,942
- Equity at exit
- $50,512
Cash invested: $7,280 (down + closing). Projections, not guarantees.
Landlord ↔ Tenant lean methodology
- Overall (STATE)
- 62 Landlord-Friendly
- State Pennsylvania
- 62 Landlord-Friendly · EVEN
- County
- — inherits STATE
- City
- — inherits STATE
ZIP-level market 15012
- Home prices YoY
- 5.9%
- Active inventory
- 93
- Price-to-rent
- 1.3×
Monthly cashflow live
- Estimated rent
- $1,650 medium interval (Pro) →
- Mortgage (P&I)
- −$136
- Tax from tax record
- −$80 /mo · $959/yr
- Insurance
- −$11
- HOA
- −$0
- Vacancy / Maint / Mgmt
- −$346
- Net cashflow
- $1,076
Break-even live
UW: 25.0% down · 7.5% · 30yr · 1.5% tax · 5.0% vac · 8.0% maint · 8.0% mgmt
Financing live
Cash to close
- Down payment
- $6,500
- Closing costs
- $780
- Reserves months
- —
- Total cash needed
- —
Loan-product check · same deal, 3 products live
Conventional
25% down · 7.5% · 30yr
- Down + closing
- —
- Monthly P&I
- —
- Monthly cashflow
- —
- DSCR
- —
- Eligible?
- —
Personal DTI + credit; lowest rate.
DSCR
20% down · 8.5% · 30yr
- Down + closing
- —
- Monthly P&I
- —
- Monthly cashflow
- —
- DSCR
- —
- Eligible?
- —
No personal income docs; deal must DSCR.
Hard money
10% down · 12.0% · 12mo
- Down + closing
- —
- Monthly P&I
- —
- Monthly cashflow
- —
- DSCR
- —
- Eligible?
- —
Short-term bridge; refi at stabilization.
Rent comps 1 comps
| Address | Beds | Baths | Sqft | Rent | $/sqft | DOM | Units | Dist |
|---|---|---|---|---|---|---|---|---|
| 383 Fell St Belle Vernon, PA | 2.0 | 2.0 | 1157 | $1,650 | $1.43 | 1d | 1 | 1.31mi |
Listing history 16 events
-
2026-06-18days on market $26,000 Active 38 DOM
-
2026-06-17days on market $26,000 Active 37 DOM
-
2026-06-16days on market $26,000 Active 36 DOM
-
2026-06-15days on market $26,000 Active 35 DOM
-
2026-06-13days on market $26,000 Active 33 DOM
-
2026-06-09days on market $26,000 Active 29 DOM
-
2026-06-08days on market $26,000 Active 28 DOM
-
2026-06-07days on market $26,000 Active 27 DOM
-
2026-06-03days on market $26,000 Active 23 DOM
-
2026-06-02days on market $26,000 Active 22 DOM
-
2026-06-01days on market $26,000 Active 21 DOM
-
2026-05-31days on market $26,000 Active 20 DOM
-
2026-05-12$26,000 Active 262-char remark
-
2026-04-22price $20,000 671-char remark
Show marketing remark (671 chars)
Opportunity awaits with this 2-bedroom, 1-bath property offering strong potential for renovation or investment. Situated on a manageable lot with on-street parking, this home is ideal for buyers looking to add value and create something truly their own. The property features a traditional layout and solid footprint, providing a great starting point for a full rehab or restoration project. With the right vision, this space can be transformed into a charming residence or income-producing asset. Conveniently located with easy access to local amenities, this is a great opportunity for investors, contractors, or buyers seeking a project property with upside potential.
-
2026-04-08price $25,000 671-char remark
Show marketing remark (671 chars)
Opportunity awaits with this 2-bedroom, 1-bath property offering strong potential for renovation or investment. Situated on a manageable lot with on-street parking, this home is ideal for buyers looking to add value and create something truly their own. The property features a traditional layout and solid footprint, providing a great starting point for a full rehab or restoration project. With the right vision, this space can be transformed into a charming residence or income-producing asset. Conveniently located with easy access to local amenities, this is a great opportunity for investors, contractors, or buyers seeking a project property with upside potential.
-
2026-03-25$30,000 Active 671-char remark
Show marketing remark (671 chars)
Opportunity awaits with this 2-bedroom, 1-bath property offering strong potential for renovation or investment. Situated on a manageable lot with on-street parking, this home is ideal for buyers looking to add value and create something truly their own. The property features a traditional layout and solid footprint, providing a great starting point for a full rehab or restoration project. With the right vision, this space can be transformed into a charming residence or income-producing asset. Conveniently located with easy access to local amenities, this is a great opportunity for investors, contractors, or buyers seeking a project property with upside potential.
ⓘ Source: listings_history table (triggers on properties + properties_extension) + one-shot
backfill from property_details.listing_events for pre-trigger history.
Tax reassessment forecast PA · Partial reset (capped growth)
- Current annual tax
- $959 · $80/mo
- Projected year-2 tax
- $959 · $80/mo
- Expected delta
- $0/yr ($0/mo · 0.0%)
ⓘ Screening estimate from a state-policy table — verify with the county assessor before closing.
Climate risk First Street
- Flood 1/10 Low FEMA zone X (unshaded) · 0% chance over 30 yrs
- Wildfire 1/10 Low
- Heat 3/10 Moderate 7 d/yr ≥97°F today · 18 d/yr by 30 yrs out
- Wind 2/10 Low
- Air quality 2/10 Low 1 unhealthy d/yr today · 2 by 30 yrs out
Nearby sold comps map
Loading sold comps map…
Walkable amenities ~0.75 mi
Loading nearby amenities…
Taxation est. · year 1
- Rental income
- $19,800
- − Mortgage interest
- −$1,456
- − Property taxes
- −$959
- − Insurance
- −$130
- − Repairs & maintenance
- −$1,584
- − Management
- −$1,584
- − Depreciation
- −$756
- Taxable income
- $13,330
- Est. tax owed @ 24.0%
- −$3,199
- After-tax cash flow
- $9,718/yr
For passive investors: Depreciation is non-cash, so a rental often shows a tax loss while cash-flowing — sheltering income. Rental losses are passive: they offset passive income freely, and up to $25,000/yr can offset ordinary (W-2) income if you actively participate and your MAGI is under $100k (phasing out to $0 by $150k); unused losses carry forward. On sale, claimed depreciation is recaptured at up to 25%, and gains may owe capital-gains tax (a 1031 exchange can defer both). Figures are a year-1 estimate at your 24.0% rate — not tax advice; consult a CPA.
Schools (NCES district)
- District
- Belle Vernon Area SD
- NCES district ID
- 4203210
- Math proficiency
- 34% ▼ -15.00%
- Reading proficiency
- 56% ▼ -13.00%
- Median HH income
- $51,784
- Composite
- 38.72/100
- National rank
- #4134
- State rank
- #267 of 539 in PA
Livability — Washington
- Score
- 85/100
- State rank
- #77
- US rank
- #558
Category grades
Schools grade is shown separately in the Schools card above.
Census & demographics
- Census place
- Fairhope, PA
- City population
- 50,348
- Population (ZIP)
- 15,294
Population outlook (Fayette County) Hauer SSP2
- Today (2025)
- 127,561 people
- By 2030
- 123,206 · -3.4%
- By 2040
- 113,232 · -11.2%
- By 2050
- 103,468 · -18.9%
- By 2075
- 83,185 · -34.8%
- By 2100
- 62,384 · -51.1%
Race, ethnicity, and origin ACS 2023
- Neighborhood character
- Predominantly White (90%)
- Race & ethnicity
- White 90% Black 4% Two or more races 3% Hispanic / Latino 2% Asian 1%
- Common ancestry
- Romanian 10% Slovak 4% Scotch-Irish 2%
- Foreign-born
- 2% · Canada, India, China
- Languages at home
- 97% English-only · Spanish 2% Other Indo-European 1%
Political lean MEDSL · Fayette
- 2024 margin
- Solid R (+37.9) · D 30.8% · R 68.7%
- 2008→2024 swing
- -37.5pp toward R · 2008: -0.4pp · 2024: -37.9pp
- All cycles
- 2024: R+37.9 2020: R+33.5 2016: R+31.0 2012: R+8.3 2008: R+0.4
Not yet ingested
- Civics
- —
Market trends
- HPI YoY
- ▲ 14.36%
- Current HPI
- 258.8202
- Rent YoY
- —
- Metro
- —
- State GDP YoY
- ▲ 1.68%
- F500 in state
- 34
Industry mix (Fortune 500 HQ in PA)
| Industry | F500 HQs | Revenue |
|---|---|---|
| Healthcare | 2 | $309B |
|
||
| Insurance | 2 | $27B |
|
||
| Telecommunications / Media | 1 | $124B |
|
||
| Industrial Distribution | 1 | $22B |
|
||
| Financial Services | 1 | $20B |
|
||
| Chemicals / Materials | 1 | $18B |
|
||
Price history
-13.3% since first listed4 events — show timeline
- 2026-05-12 Listed $26,000 FSBO.com
- 2026-04-22 Price Changed $20,000 West Penn MLS
- 2026-04-08 Price Changed $25,000 West Penn MLS
- 2026-03-25 Listed $30,000 West Penn MLS
Property tax history
+1.9%/yrLatest (2026): $959 · +0.5% YoY. Source: county tax records.
Cash-flow waterfall
monthlySold comps — $/sqft
last 12 mo · ≤1 miLoading sold comps…