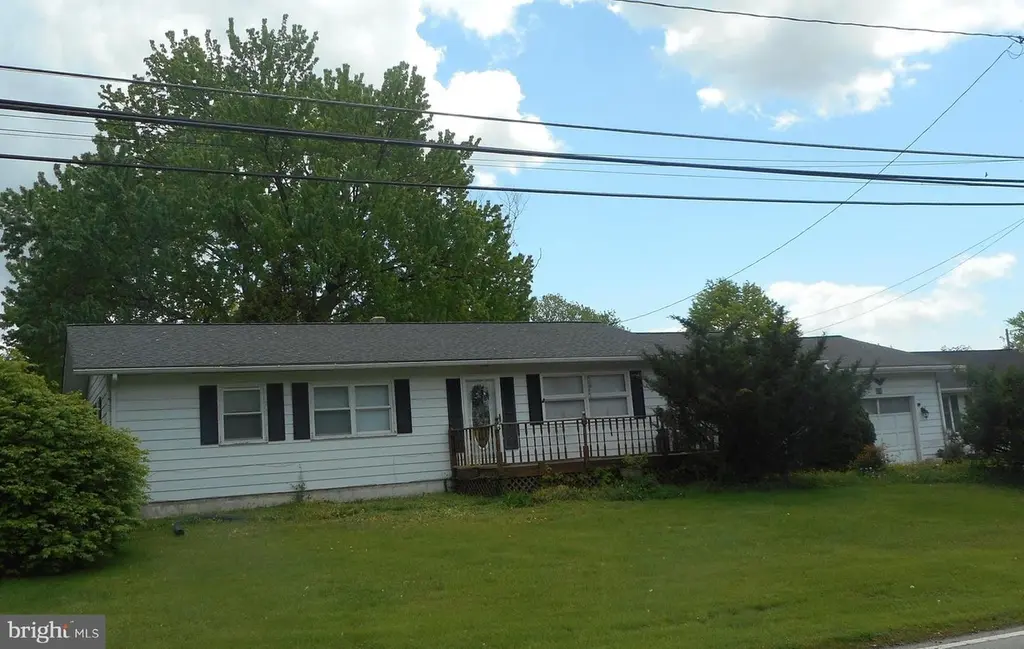
614 Bladen St · Charlestown, MD
Flood risk 1/10 · Minimal
- FEMA flood zone
- X (unshaded)
- Chance of flooding over 30 yrs
- 0.0%
- Est. flood insurance / yr
- $507 – $1,088
Fire risk 2/10 · Minimal
- Est. fire insurance / yr
- $755 – $1,403
Heat risk 7/10 · Major
- Hot days now (above 105°F)
- 7 days/yr
- Hot days in 30 yrs
- 15 days/yr
Wind risk 6/10 · Moderate
- Chance of severe wind over 30 yrs
- 27.0%
Air-quality risk 3/10 · Minor
- Unhealthy air days now
- 2 days/yr
- Unhealthy air days in 30 yrs
- 3 days/yr
Risk factors via First Street. Map © Google.
Why this score? — see what drove the C- grade
The composite is a weighted blend of 9 inputs, each scored 0–100. Each bar is that input's sub-score; the figure is the points it added to the 100-point composite (weight × sub-score).
- ARV discount +15.0/15.0
- Cash flow +11.0/30.0
- Appreciation +7.1/10.0
- Livability +3.7/5.0
- DSCR +3.2/10.0
- 1% rule +2.9/10.0
- Rent growth +2.5/5.0
- Condition / age +2.5/5.0
- Schools +2.2/10.0
$259,900
🖨 Deal sheet 📄 Offer letter ✓ Due diligence
Listing remarks MLS
Estate sale
Key facts
- 0.28 acre lot
- Garage
- Built 1957
Neighborhood map
What this means for you Summary
Snapshot
- This is a 3-bed/1.5-bath single-family listed at $260k.
Deal economics
- At list price, monthly cash flow is $-109 ($-1k/yr) — negative.
- To cash-flow at today's rent, offer at most $241k (7.4% below list).
- To meet the 1% rule (rent ≥ 1% of price), the offer needs to be $206k (20.5% below list).
- Recommended offer: $206k (20.5% below list) — sets the bar for 1% rule.
- Cap rate 5.8% vs local median 3.1% in Charlestown — top-decile yield for the area; either an underpriced asset or a hidden risk that comps aren't pricing in. Stress-test before assuming the spread holds.
Location & tenants
- Location reads 73/100 on livability (#129 in MD) — a middle-class / working-renter tenant base. Strengths: crime A+, employment A+, housing A+; Watch: amenities F, commute F.
- Cecil County Public Schools (rural): math 15% / reading 30% proficiency, ranked #15 of 24 in MD (top 62%) — low school quality limits family demand, transient renter base, plan for 1-2y turnover.
- Market conditions: 5 active listings in the ZIP; 1 comparable units currently listed for rent nearby; 563 units permitted in Cecil County in 2024 (330 in 5+ unit buildings).
Forward outlook
- In year one you build about $13k of equity ($2k loan paydown + $11k appreciation (4.3% local appreciation)).
- By year 3, paydown + projected appreciation supports a ~$32k cash-out refi (75% LTV) — recoverable capital for the next deal without selling this one.
Negotiation context
- It's been on market 64 days — a 6% lower offer ($244k) is reasonable based on typical stale-listing flexibility.
- 3 sale attempts since 27y ago; this cycle's ask has dropped $20k (7%) from the opening price — seller is motivated, your offer sets the floor, not the list.
- Current owner paid $112k; list at $260k implies a 132% gain — meaningful room to come down on a strong offer.
Risks & watch-outs
- Watch-outs: built in 1957 — expect roof / HVAC / electrical / plumbing capex.
- Climate carrying-cost: major wind risk, 27% chance of damaging wind over 30y; extreme-heat days projected 7→15/yr by 2055 (HVAC capex compounding) — expect insurance premiums to compound above CPI over the hold.
Questions for the listing agent
- What do current leases actually rent for vs. the listed asking? Can we see a recent rent roll and the last 12 months of T-12 income?
- It's been on market 64 days. Have you received any prior offers? Is the seller open to a 21% concession, seller financing, or rate buy-down credit?
- Built in 1957 — when were the roof, HVAC, electrical panel, plumbing, and water heater last replaced?
- Why hasn't it sold? Are there any deal-killer items the seller is aware of (foundation, flood, title, zoning, code violations)?
- Is there a deadline driving the sale (1031 exchange, divorce, estate, relocation)? That informs how much negotiation room exists.
- What's the average days-on-market for RENTAL listings here right now (not sales)? A rising rental-DOM trend means longer vacancies and softer asking-rent achievability than the comps imply.
- What's the recent tenant-quality profile in this submarket — average credit score on applications, eviction rate, late-payment / NSF rate, and stable-employment percentage? A property-management company in the area should have these aggregated.
- How much new for-sale + rental construction is in the pipeline within 1–3 miles? Heavy new supply typically softens prices + rents 12–24 months out; constrained supply supports both.
Investment metrics
- 1% rule
- 0.79% ✗
- Cap rate
- 5.79%
- Cash-on-cash
- -1.80%
- DSCR
- 0.92
- GRM
- 10.5
CMA / ARV
- ARV (median comp)
- $330,050
- List price
- $259,900
- Delta
- -21.25%
- Verdict
- UNDERPRICED
- Comps
- 20 within 1.0 mi
Show comp detail 4 sales within ~0.75 mi
| Address | Dist | Beds/Ba | Sqft | Sold | Price | $/sf | Match |
|---|---|---|---|---|---|---|---|
| 167 Bridgewood Ave | 0.63mi | 3/2.0 | 1,488 (-5%) | 7mo | $468,700 | $315 | 54 |
| 90 Salvation Cir | 0.56mi | 3/2.0 | 1,710 (+9%) | 7mo | $335,000 | $196 | 51 |
| 555 Baltimore St | 0.49mi | 4/2.0 (+1) | 1,800 (+15%) | 5mo | $362,000 | $201 | 41 |
| 120 Cool Springs Rd | 0.67mi | 3/2.5 | 1,800 (+15%) | 10mo | $385,000 | $214 | 31 |
Match score weights: distance 35% · size 25% · config 20% · recency 20%. Top-matched comps best support the ARV.
Projected returns pro-forma
4.29% appreciation · 3.0% rent growth · sell at horizon
- IRR
- 9.5%
- Equity multiple
- 1.58×
- Total profit
- $42,517
- Equity at exit
- $136,179
- IRR
- 11.3%
- Equity multiple
- 2.92×
- Total profit
- $139,938
- Equity at exit
- $226,322
Cash invested: $72,772 (down + closing). Projections, not guarantees.
Landlord ↔ Tenant lean methodology
- Overall (STATE)
- 27 Tenant-Leaning
- State Maryland
- 27 Tenant-Leaning · D+14
- County
- — inherits STATE
- City
- — inherits STATE
ZIP-level market 21914
- Home prices YoY
- 1.5%
- Active inventory
- 5
- Price-to-rent
- 10.5×
Monthly cashflow live
- Estimated rent
- $2,065 medium interval (Pro) →
- Mortgage (P&I)
- −$1,363
- Tax from tax record
- −$269 /mo · $3,230/yr
- Insurance
- −$108
- HOA
- −$0
- Vacancy / Maint / Mgmt
- −$434
- Net cashflow
- $-109
Break-even live
UW: 25.0% down · 7.5% · 30yr · 1.5% tax · 5.0% vac · 8.0% maint · 8.0% mgmt
Financing live
Cash to close
- Down payment
- $64,975
- Closing costs
- $7,797
- Reserves months
- —
- Total cash needed
- —
Loan-product check · same deal, 3 products live
Conventional
25% down · 7.5% · 30yr
- Down + closing
- —
- Monthly P&I
- —
- Monthly cashflow
- —
- DSCR
- —
- Eligible?
- —
Personal DTI + credit; lowest rate.
DSCR
20% down · 8.5% · 30yr
- Down + closing
- —
- Monthly P&I
- —
- Monthly cashflow
- —
- DSCR
- —
- Eligible?
- —
No personal income docs; deal must DSCR.
Hard money
10% down · 12.0% · 12mo
- Down + closing
- —
- Monthly P&I
- —
- Monthly cashflow
- —
- DSCR
- —
- Eligible?
- —
Short-term bridge; refi at stabilization.
Rent comps 1 comps
| Address | Beds | Baths | Sqft | Rent | $/sqft | DOM | Units | Dist |
|---|---|---|---|---|---|---|---|---|
| 400 W Claiborne Rd North East, MD | 1.0–2.0 | 1.0–2.0 | 973 | $2,065 | $2.12 | 1d | 21 | 1.34mi |
Listing history 23 events
-
2026-06-18days on market $259,900 Active 64 DOM
-
2026-06-17days on market $259,900 Active 63 DOM
-
2026-06-16days on market $259,900 Active 62 DOM
-
2026-06-15days on market $259,900 Active 61 DOM
-
2026-06-13remarks 220-char remark
-
2026-06-13pricedays on market $259,900 Active 59 DOM
-
2026-06-09days on market $279,900 Active 55 DOM
-
2026-06-08days on market $279,900 Active 54 DOM
-
2026-06-07days on market $279,900 Active 53 DOM
-
2026-06-04days on market $279,900 Active 50 DOM
-
2026-06-03days on market $279,900 Active 49 DOM
-
2026-06-02days on market $279,900 Active 48 DOM
-
2026-06-01days on market $279,900 Active 47 DOM
-
2026-05-31days on market $279,900 Active 46 DOM
-
2026-04-15$279,900 Active 12-char remark
Show marketing remark (12 chars)
Estate sale
-
2026-04-02historical $279,900 12-char remark
Show marketing remark (12 chars)
Estate sale
-
1999-10-04soldstatus $112,000
-
1999-09-29soldstatus $112,000
-
1999-08-24historical
-
1999-08-14$112,000
-
1999-08-06historical
-
1999-05-13
-
1985-04-22soldstatus $55,370
ⓘ Source: listings_history table (triggers on properties + properties_extension) + one-shot
backfill from property_details.listing_events for pre-trigger history.
Tax reassessment forecast MD · Partial reset (capped growth)
- Current annual tax
- $3,230 · $269/mo
- Projected year-2 tax
- $3,230 · $269/mo
- Expected delta
- $0/yr ($0/mo · 0.0%)
ⓘ Screening estimate from a state-policy table — verify with the county assessor before closing.
Climate risk First Street
- Flood 1/10 Low FEMA zone X (unshaded) · 0% chance over 30 yrs
- Wildfire 2/10 Low
- Heat 7/10 Severe 7 d/yr ≥105°F today · 15 d/yr by 30 yrs out
- Wind 6/10 Major 27% chance of damaging wind over 30 yrs
- Air quality 3/10 Moderate 2 unhealthy d/yr today · 3 by 30 yrs out
Nearby sold comps map
Loading sold comps map…
Walkable amenities ~0.75 mi
Loading nearby amenities…
Taxation est. · year 1
- Rental income
- $24,780
- − Mortgage interest
- −$14,558
- − Property taxes
- −$3,230
- − Insurance
- −$1,300
- − Repairs & maintenance
- −$1,982
- − Management
- −$1,982
- − Depreciation
- −$7,561
- Taxable loss
- −$5,834
- Est. tax savings @ 24.0%
- +$1,400
- After-tax cash flow
- $91/yr
For passive investors: Depreciation is non-cash, so a rental often shows a tax loss while cash-flowing — sheltering income. Rental losses are passive: they offset passive income freely, and up to $25,000/yr can offset ordinary (W-2) income if you actively participate and your MAGI is under $100k (phasing out to $0 by $150k); unused losses carry forward. On sale, claimed depreciation is recaptured at up to 25%, and gains may owe capital-gains tax (a 1031 exchange can defer both). Figures are a year-1 estimate at your 24.0% rate — not tax advice; consult a CPA.
Schools (NCES district)
- District
- Cecil County Public Schools
- NCES district ID
- 2400240
- Math proficiency
- 15% ▼ -21.00%
- Reading proficiency
- 30% ▼ -15.00%
- Median HH income
- $66,544
- Composite
- 21.51/100
- National rank
- #8322
- State rank
- #15 of 24 in MD
Livability — Charlestown
- Score
- 73/100
- State rank
- #129
- US rank
- #5488
Category grades
Schools grade is shown separately in the Schools card above.
Census & demographics
- Census place
- Charlestown, MD
- City population
- 786
- Population (ZIP)
- 786
Population outlook (Cecil County) Hauer SSP2
- Today (2025)
- 105,877 people
- By 2030
- 106,905 · +1.0%
- By 2040
- 107,156 · +1.2%
- By 2050
- 104,170 · -1.6%
- By 2075
- 95,771 · -9.5%
- By 2100
- 82,381 · -22.2%
Race, ethnicity, and origin ACS 2023
- Neighborhood character
- Predominantly White (98%)
- Race & ethnicity
- White 98% Two or more races 1%
- Common ancestry
- Slovak 6% Iranian 4% Serbian 3%
Political lean MEDSL · Cecil
- 2024 margin
- Solid R (+30.9) · D 33.5% · R 64.4% · Other 2.1%
- 2008→2024 swing
- -16.3pp toward R · 2008: -14.6pp · 2024: -30.9pp
- All cycles
- 2024: R+30.9 2020: R+26.6 2016: R+35.3 2012: R+20.4 2008: R+14.6
Not yet ingested
- Civics
- —
Market trends
- HPI YoY
- ▲ 4.29%
- Current HPI
- 293.6892
- Rent YoY
- —
- Metro
- —
- State GDP YoY
- ▲ 2.97%
- F500 in state
- 12
Industry mix (Fortune 500 HQ in MD)
| Industry | F500 HQs | Revenue |
|---|---|---|
| Aerospace / Defense | 1 | $71B |
|
||
| Utilities | 1 | $25B |
|
||
| Hotels | 1 | $24B |
|
||
| Consumer Goods | 1 | $7B |
|
||
| Real Estate | 1 | $6B |
|
||
| Chemicals | 1 | $2B |
|
||
Price history
+405.5% since first listed9 events — show timeline
- 2026-04-15 Listed $279,900 BRIGHT MLS
- 2026-04-02 Coming Soon $279,900 BRIGHT MLS
- 1999-10-04 Sold (Public Records) $112,000 Public Records
- 1999-09-29 Sold (MLS) $112,000 MRIS
- 1999-08-24 Delisted — MRIS
- 1999-08-14 Listed $112,000 MRIS
- 1999-08-06 Delisted — MRIS
- 1999-05-13 Listed — MRIS
- 1985-04-22 Sold (Public Records) $55,370 Public Records
Property tax history
+2.9%/yrLatest (2025): $3,230 · +18.6% YoY. Source: county tax records.
Cash-flow waterfall
monthlySold comps — $/sqft
last 12 mo · ≤1 miLoading sold comps…