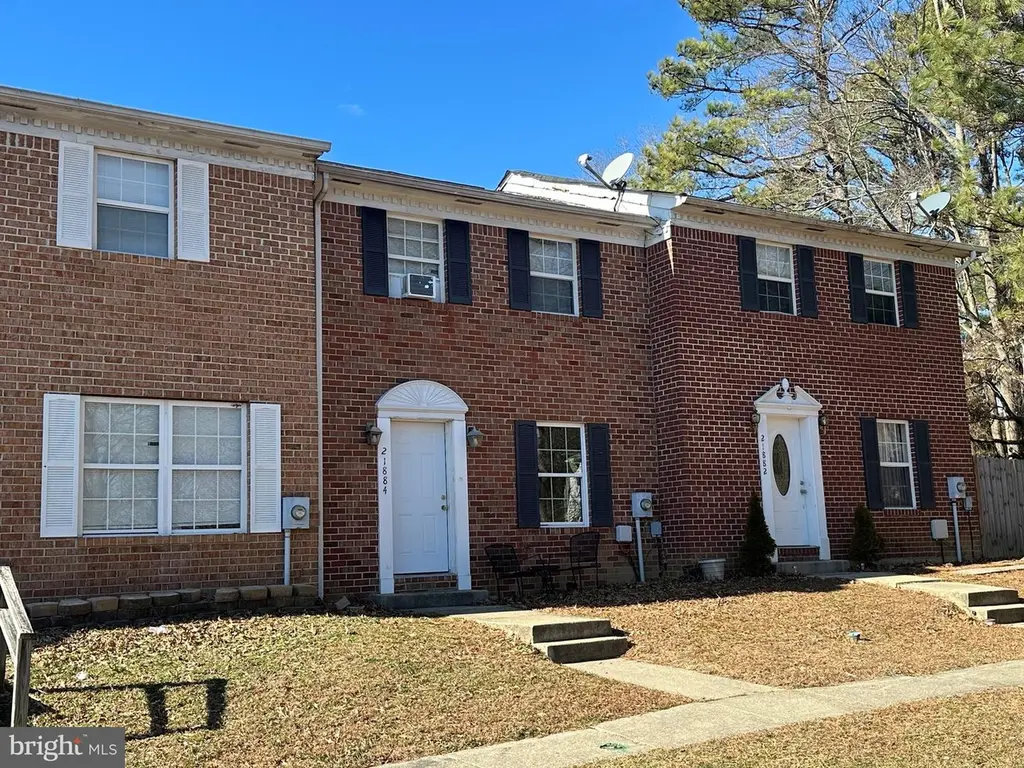
21884 Ronald Dr · Lexington Park, MD
Flood risk 1/10 · Minimal
- FEMA flood zone
- X (unshaded)
- Chance of flooding over 30 yrs
- 0.0%
- Est. flood insurance / yr
- $507 – $1,088
Fire risk 4/10 · Minor
- Est. fire insurance / yr
- $755 – $1,403
Heat risk 9/10 · Severe
- Hot days now (above 100°F)
- 7 days/yr
- Hot days in 30 yrs
- 17 days/yr
Wind risk 6/10 · Moderate
- Chance of severe wind over 30 yrs
- 68.0%
Air-quality risk 2/10 · Minimal
- Unhealthy air days now
- 1 days/yr
- Unhealthy air days in 30 yrs
- 2 days/yr
Risk factors via First Street. Map © Google.
Why this score? — see what drove the C grade
The composite is a weighted blend of 9 inputs, each scored 0–100. Each bar is that input's sub-score; the figure is the points it added to the 100-point composite (weight × sub-score).
- Cash flow +26.6/30.0
- DSCR +9.1/10.0
- 1% rule +6.3/10.0
- Appreciation +3.2/10.0
- Livability +3.1/5.0
- Schools +3.0/10.0
- Rent growth +2.6/5.0
- Condition / age +2.5/5.0
- ARV discount +0.0/15.0
$190,000
🖨 Deal sheet (PDF) 📄 Offer letter ✓ Due diligence
Listing remarks MLS
Great investment opportunity, currently tenant occupied. Need 24 hours notice to show. Home being sold AS-IS. HVAC new March 26. Location close to Navy Base, shopping , dining, theater, boating & more. Three bedrooms , 2 baths & linen closet on 2nd level . (Occupied w/ Tenants personal items/furnishings. Lower level has laundry, kitchen, storage closet, living room w/ slider to rear yard. Assigned parking 2 spaces marked (84)
Key facts
- Built 1989
- Listed 100 days
Neighborhood map
What this means for you Summary
Snapshot
- This is a 3-bed/1.5-bath townhouse listed at $190k.
Deal economics
- At list price, monthly cash flow is $510 ($6k/yr) — positive.
- The deal already cash-flows at list — no discount required.
- Meets the 1% rule at list price ($2k rent vs $190k).
- Recommended offer: $173k (9.0% below list) — sets the bar for market timing.
- Cap rate 9.5% vs local median 4.0% in Lexington Park — top-decile yield for the area; either an underpriced asset or a hidden risk that comps aren't pricing in. Stress-test before assuming the spread holds.
Location & tenants
- Location reads 61/100 on livability (#331 in MD) — a middle-class / working-renter tenant base. Strengths: employment A+, housing A; Watch: crime F, amenities F, commute F.
- St. Mary'S County Public Schools (rural): math 23% / reading 38% proficiency, ranked #8 of 24 in MD (top 33%) — families likely to look elsewhere, expect single-tenant / working-renter base with shorter leases.
- Zoned schools: Green Holly Elementary School (math 17% / reading 12%, grade F, #477 of 860 statewide, top 59%, 492 students, 63% FRL); Esperanza Middle (math 18% / reading 41%, grade F, #67 of 225 statewide, top 32%, 875 students, 41% FRL); Great Mills High (math 42% / reading 55%, grade D, #111 of 222 statewide, top 50%, 1,779 students, 55% FRL) — zoned schools average 53% FRL vs 28% district-wide (25 pts higher); higher-poverty schools than district average — tighter screening recommended.
- Market conditions: Rents flat; 94 active listings in the ZIP; solid renter incomes; 265 units permitted in St. Mary's County in 2024 (0 in 5+ unit buildings).
Forward outlook
- Local home prices are declining (-3.0%/yr); year-one equity from $1k of loan paydown is wiped out by about $6k of value loss. Plan a longer hold.
- St. Mary's County population projected at +16% by 2050 — long-run rental-demand tailwind backs the buy-and-hold thesis.
Negotiation context
- It's been on market 101 days — a 9% lower offer ($173k) is reasonable based on typical stale-listing flexibility.
- Current owner paid $100k; list at $190k implies a 90% gain — meaningful room to come down on a strong offer.
Risks & watch-outs
- Climate carrying-cost: major wind risk, 68% chance of damaging wind over 30y; extreme-heat days projected 7→17/yr by 2055 (HVAC capex compounding) — expect insurance premiums to compound above CPI over the hold.
Questions for the listing agent
- It's been on market 101 days. Have you received any prior offers? Is the seller open to a 9% concession, seller financing, or rate buy-down credit?
- Why hasn't it sold? Are there any deal-killer items the seller is aware of (foundation, flood, title, zoning, code violations)?
- Is there a deadline driving the sale (1031 exchange, divorce, estate, relocation)? That informs how much negotiation room exists.
- Schools are D-rated, which usually means shorter tenancies and higher turnover. Who's the typical renter profile here, and what's been the actual vacancy rate?
- Crime grade is F in this area — have there been break-ins, vandalism, or insurance claims at this property in the last 3 years? What carrier currently insures it and at what premium?
- What's the average days-on-market for RENTAL listings here right now (not sales)? A rising rental-DOM trend means longer vacancies and softer asking-rent achievability than the comps imply.
- What's the recent tenant-quality profile in this submarket — average credit score on applications, eviction rate, late-payment / NSF rate, and stable-employment percentage? A property-management company in the area should have these aggregated.
- How much new for-sale + rental construction is in the pipeline within 1–3 miles? Heavy new supply typically softens prices + rents 12–24 months out; constrained supply supports both.
Investment metrics
- 1% rule
- 1.13% ✓
- Cap rate
- 9.51%
- Cash-on-cash
- 11.50%
- DSCR
- 1.51
- GRM
- 7.4
CMA / ARV
- ARV (median comp)
- $135,695
- List price
- $190,000
- Delta
- 40.02%
- Verdict
- OVERPRICED
- Comps
- 20 within 1.0 mi
Show comp detail 12 sales within ~0.75 mi
| Address | Dist | Beds/Ba | Sqft | Sold | Price | $/sf | Match |
|---|---|---|---|---|---|---|---|
| 46351 Columbus Dr #207 | 0.58mi | 2/1.5 (-1) | 1,114 (-0%) | 2mo | $228,145 | $205 | 65 |
| 46359 Columbus Dr | 0.61mi | 3/1.5 | 1,164 (+4%) | 7mo | $215,000 | $185 | 59 |
| 46315 Creeping Primrose Ln Unit B | 0.48mi | 3/2.5 | 1,220 (+9%) | 2mo | $294,000 | $241 | 57 |
| 22087 Spring Valley Dr | 0.34mi | 3/1.5 | 1,280 (+14%) | 6mo | $160,000 | $125 | 55 |
| 46345 Creeping Primrose Ln Unit G | 0.52mi | 3/2.5 | 1,220 (+9%) | 2mo | $283,000 | $232 | 55 |
| 46349 Columbus Dr | 0.57mi | 3/1.5 | 990 (-12%) | 2mo | $149,000 | $151 | 53 |
| 21805 Primrose Willow Ln Unit D | 0.47mi | 3/2.5 | 1,220 (+9%) | 10mo | $295,000 | $242 | 51 |
| 46289 Mako Way | 0.65mi | 3/1.5 | 1,200 (+7%) | 9mo | $260,000 | $217 | 50 |
| 21825 Primrose Willow Ln Unit C | 0.45mi | 3/2.5 | 1,220 (+9%) | 12mo | $290,000 | $238 | 50 |
| 21810 Primrose Willow Ln Unit D | 0.48mi | 3/2.5 | 1,220 (+9%) | 12mo | $290,000 | $238 | 49 |
| 46345 Creeping Primrose Ln Unit A | 0.52mi | 3/2.5 | 1,220 (+9%) | 12mo | $300,000 | $246 | 47 |
| 46281 Mako Way | 0.65mi | 3/1.5 | 1,280 (+14%) | 7mo | $239,400 | $187 | 40 |
Match score weights: distance 35% · size 25% · config 20% · recency 20%. Top-matched comps best support the ARV.
Projected returns pro-forma
-3.0% appreciation · 0.49% rent growth · sell at horizon
- IRR
- -1.9%
- Equity multiple
- 0.93×
- Total profit
- $-3,665
- Equity at exit
- $28,330
- IRR
- 5.1%
- Equity multiple
- 1.33×
- Total profit
- $17,769
- Equity at exit
- $16,428
Cash invested: $53,200 (down + closing). Projections, not guarantees.
Landlord ↔ Tenant lean methodology
- Overall (STATE)
- 27 Tenant-Leaning
- State Maryland
- 27 Tenant-Leaning · D+14
- County
- — inherits STATE
- City
- — inherits STATE
ZIP-level market 20653
- Home prices YoY
- -1.4%
- Rents YoY
- 0.5%
- Active inventory
- 94
- Price-to-rent
- 7.4×
Monthly cashflow live
- Estimated rent
- $2,149 medium interval (Pro) →
- Mortgage (P&I)
- −$996
- Tax from tax record
- −$112 /mo · $1,346/yr
- Insurance
- −$79
- HOA
- −$0
- Vacancy / Maint / Mgmt
- −$451
- Net cashflow
- $510
Break-even live
Sensitivity live
| Price | -10% $617 | -5% $563 | +0% $510 | +5% $456 | +10% $402 |
|---|---|---|---|---|---|
| Rent | -10% $340 | -5% $425 | +0% $510 | +5% $595 | +10% $679 |
| Rate | -1.0pp $605 | -0.5pp $558 | base $510 | +0.5pp $460 | +1.0pp $410 |
UW: 25.0% down · 7.5% · 30yr · 1.5% tax · 5.0% vac · 8.0% maint · 8.0% mgmt
Financing live
Cash to close
- Down payment
- $47,500
- Closing costs
- $5,700
- Reserves months
- —
- Total cash needed
- —
Loan-product check · same deal, 3 products live
Conventional
25% down · 7.5% · 30yr
- Down + closing
- —
- Monthly P&I
- —
- Monthly cashflow
- —
- DSCR
- —
- Eligible?
- —
Personal DTI + credit; lowest rate.
DSCR
20% down · 8.5% · 30yr
- Down + closing
- —
- Monthly P&I
- —
- Monthly cashflow
- —
- DSCR
- —
- Eligible?
- —
No personal income docs; deal must DSCR.
Hard money
10% down · 12.0% · 12mo
- Down + closing
- —
- Monthly P&I
- —
- Monthly cashflow
- —
- DSCR
- —
- Eligible?
- —
Short-term bridge; refi at stabilization.
Listing history 20 events
-
2026-06-21days on market $190,000 Active 101 DOM
-
2026-06-19days on market $190,000 Active 99 DOM
-
2026-06-18days on market $190,000 Active 98 DOM
-
2026-06-17days on market $190,000 Active 97 DOM
-
2026-06-16days on market $190,000 Active 96 DOM
-
2026-06-15days on market $190,000 Active 95 DOM
-
2026-06-14days on market $190,000 Active 93 DOM
-
2026-06-12days on market $190,000 Active 92 DOM
-
2026-06-09days on market $190,000 Active 89 DOM
-
2026-06-08days on market $190,000 Active 88 DOM
-
2026-06-07days on market $190,000 Active 87 DOM
-
2026-06-05days on market $190,000 Active 84 DOM
-
2026-06-02days on market $190,000 Active 82 DOM
-
2026-06-01days on market $190,000 Active 81 DOM
-
2026-05-31days on market $190,000 Active 80 DOM
-
2026-05-30days on market $190,000 Active 79 DOM
-
2026-04-15price $190,000 441-char remark
Show marketing remark (441 chars)
Great investment opportunity, currently tenant occupied. Need 24 hours notice to show. Home being sold AS-IS. HVAC new March 26. Location close to Navy Base, shopping , dining, theater, boating & more. Three bedrooms , 2 baths & linen closet on 2nd level . (Occupied w/ Tenants personal items/furnishings. Lower level has laundry, kitchen, storage closet, living room w/ slider to rear yard. Assigned parking 2 spaces marked (84)
-
2026-03-13$205,000 Active 441-char remark
Show marketing remark (441 chars)
Great investment opportunity, currently tenant occupied. Need 24 hours notice to show. Home being sold AS-IS. HVAC new March 26. Location close to Navy Base, shopping , dining, theater, boating & more. Three bedrooms , 2 baths & linen closet on 2nd level . (Occupied w/ Tenants personal items/furnishings. Lower level has laundry, kitchen, storage closet, living room w/ slider to rear yard. Assigned parking 2 spaces marked (84)
-
2026-02-15historical $205,000 441-char remark
Show marketing remark (441 chars)
Great investment opportunity, currently tenant occupied. Need 24 hours notice to show. Home being sold AS-IS. HVAC new March 26. Location close to Navy Base, shopping , dining, theater, boating & more. Three bedrooms , 2 baths & linen closet on 2nd level . (Occupied w/ Tenants personal items/furnishings. Lower level has laundry, kitchen, storage closet, living room w/ slider to rear yard. Assigned parking 2 spaces marked (84)
-
2019-11-12soldstatus $100,000
ⓘ Source: listings_history table (triggers on properties + properties_extension) + one-shot
backfill from property_details.listing_events for pre-trigger history.
Tax reassessment forecast MD · Partial reset (capped growth)
- Current annual tax
- $1,346 · $112/mo
- Projected year-2 tax
- $1,708 · $142/mo
- Expected delta
- +$363/yr (+$30/mo · 27.0%)
ⓘ Screening estimate from a state-policy table — verify with the county assessor before closing.
Climate risk First Street
- Flood 1/10 Low FEMA zone X (unshaded) · 0% chance over 30 yrs
- Wildfire 4/10 Moderate
- Heat 9/10 Extreme 7 d/yr ≥100°F today · 17 d/yr by 30 yrs out
- Wind 6/10 Major 68% chance of damaging wind over 30 yrs
- Air quality 2/10 Low 1 unhealthy d/yr today · 2 by 30 yrs out
Nearby sold comps map
Loading sold comps map…
Walkable amenities ~0.75 mi
Loading nearby amenities…
Taxation est. · year 1
- Rental income
- $25,782
- − Mortgage interest
- −$10,643
- − Property taxes
- −$1,346
- − Insurance
- −$950
- − Repairs & maintenance
- −$2,063
- − Management
- −$2,063
- − Depreciation
- −$5,527
- Taxable income
- $3,191
- Est. tax owed @ 24.0%
- −$766
- After-tax cash flow
- $5,350/yr
For passive investors: Depreciation is non-cash, so a rental often shows a tax loss while cash-flowing — sheltering income. Rental losses are passive: they offset passive income freely, and up to $25,000/yr can offset ordinary (W-2) income if you actively participate and your MAGI is under $100k (phasing out to $0 by $150k); unused losses carry forward. On sale, claimed depreciation is recaptured at up to 25%, and gains may owe capital-gains tax (a 1031 exchange can defer both). Figures are a year-1 estimate at your 24.0% rate — not tax advice; consult a CPA.
Schools (NCES district)
- District
- St. Mary'S County Public Schools
- NCES district ID
- 2400600
- Math proficiency
- 23% ▼ -23.00%
- Reading proficiency
- 38% ▼ -12.00%
- Median HH income
- $83,240
- Composite
- 29.74/100
- National rank
- #6444
- State rank
- #8 of 24 in MD
Livability — Lexington Park
- Score
- 61/100
- State rank
- #331
- US rank
- #17418
Category grades
Schools grade is shown separately in the Schools card above.
Census & demographics
- Census place
- Lexington Park, MD
- County
- Saint Marys County · 48,152 people
- City population
- 26,852
- Metro
- California-Lexington Park, MD
- Population (ZIP)
- 26,852
- Household income
- $103,048
- Rent vs Own
- Severe rent burden
- 1571.0
Population outlook (St. Mary's County) Hauer SSP2
- Today (2025)
- 123,125 people
- By 2030
- 128,374 · +4.3%
- By 2040
- 137,305 · +11.5%
- By 2050
- 143,065 · +16.2%
- By 2075
- 153,408 · +24.6%
- By 2100
- 151,790 · +23.3%
Race, ethnicity, and origin ACS 2023
- Neighborhood character
- Diverse neighborhood (Simpson 0.63)
- Race & ethnicity
- White 54% Black 28% Two or more races 11% Hispanic / Latino 6% Asian 4%
- Hispanic origin (detail)
- Mexican 3% Puerto Rican 1%
- Common ancestry
- Romanian 2% Slovak 2% Italian 1%
- Foreign-born
- 6% · Canada, Jamaica
- Languages at home
- 92% English-only · Spanish 3% Tagalog/Filipino 3% Other Asian/Pacific 1%
Political lean MEDSL · St. Mary's
- 2024 margin
- R (+17.2) · D 40.2% · R 57.4% · Other 2.4%
- 2008→2024 swing
- -4.4pp toward R · 2008: -12.8pp · 2024: -17.2pp
- All cycles
- 2024: R+17.2 2020: R+13.8 2016: R+24.6 2012: R+16.1 2008: R+12.8
Not yet ingested
- Civics
- —
Market trends
- HPI YoY
- ▼ -3.67%
- Current HPI
- 256.5435
- Rent YoY
- ▲ 0.49%
- Metro
- California-Lexington Park, MD
- State GDP YoY
- ▲ 2.97%
- F500 in state
- 12
Industry mix (Fortune 500 HQ in MD)
| Industry | F500 HQs | Revenue |
|---|---|---|
| Aerospace / Defense | 1 | $71B |
|
||
| Utilities | 1 | $25B |
|
||
| Hotels | 1 | $24B |
|
||
| Consumer Goods | 1 | $7B |
|
||
| Real Estate | 1 | $6B |
|
||
| Chemicals | 1 | $2B |
|
||
Price history
+90.0% since first listed4 events — show timeline
- 2026-04-15 Price Changed $190,000 BRIGHT MLS
- 2026-03-13 Listed $205,000 BRIGHT MLS
- 2026-02-15 Coming Soon $205,000 BRIGHT MLS
- 2019-11-12 Sold (Public Records) $100,000 Public Records
Property tax history
+0.5%/yrLatest (2025): $1,346 · +7.5% YoY. Source: county tax records.
Cash-flow waterfall
monthlySold comps — $/sqft
last 12 mo · ≤1 miLoading sold comps…