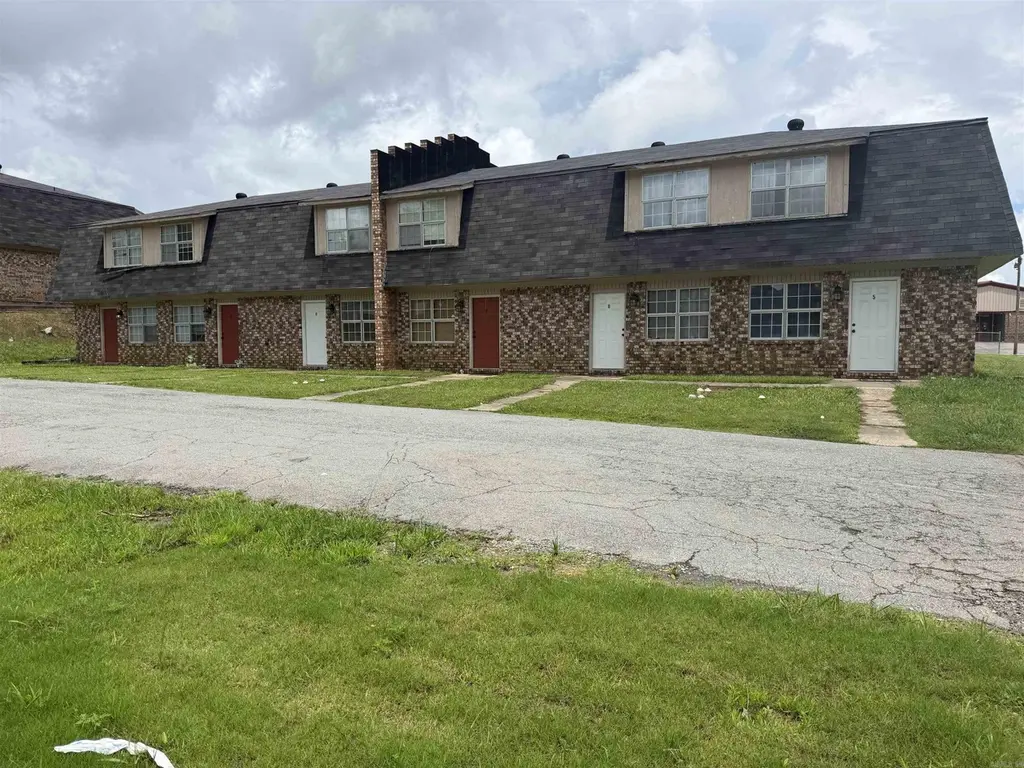
 24-Plex
201 White Hall · White Hall, AR
Flood risk 1/10 · Minimal
- FEMA flood zone
- X (unshaded)
- Chance of flooding over 30 yrs
- 0.0%
- Est. flood insurance / yr
- $507 – $1,088
Fire risk 4/10 · Minor
- Est. fire insurance / yr
- $1,499 – $2,785
Heat risk 7/10 · Major
- Hot days now (above 111°F)
- 7 days/yr
- Hot days in 30 yrs
- 20 days/yr
Wind risk 4/10 · Minor
- Chance of severe wind over 30 yrs
- 23.0%
Air-quality risk 1/10 · Minimal
- Unhealthy air days now
- 0 days/yr
- Unhealthy air days in 30 yrs
- 0 days/yr
Risk factors via First Street. Map © Google.
Why this score? — see what drove the C grade
The composite is a weighted blend of 9 inputs, each scored 0–100. Each bar is that input's sub-score; the figure is the points it added to the 100-point composite (weight × sub-score).
- Cash flow +25.1/30.0
- DSCR +8.2/10.0
- ARV discount +7.5/15.0
- 1% rule +5.7/10.0
- Livability +3.7/5.0
- Schools +3.2/10.0
- Rent growth +2.5/5.0
- Condition / age +2.5/5.0
- Appreciation +0.0/10.0
$1,650,000
🖨 Deal sheet (PDF) 📄 Offer letter ✓ Due diligence
Multi-family units
County records classify this as Multi-Family (5+ Unit). Listing-text estimate: 24 units. confirmed
5+ unit building — per-unit beds/baths from public records are typically unavailable; the breakdown below (if shown) is an estimate from the listing text.
Listing remarks MLS
Snooty Fox has been a staple in the White Hall area for many years! This beautiful property is located directly by the White Hall Jr High! It has 24 units that are totally full, there are no vacancies! Some of the units have been had new paint and flooring and some updates! These are unique, because they are townhouses! The kitchen and living areas are down stairs and the bedrooms and bath are upstairs. Very well maintained, and centrally located, near shopping, grocery stores, community center, Crenshaw Springs water park and more.
Key facts
- 1.08 acre lot
- Built 1973
- Listed 19 days
Property features AI
Finance
- Other: Approximate lot size: 1.08 acres; Approximate building area recorded as 31,500 (source: tax records)
- Financial info: 24 total units; All units are 2-bedroom; 2-bedroom rents range from $750 to $800; Tenant expenses: Electricity; Owner pays taxes, insurance, maintenance/lawn care, trash, and water/sewer
Exterior
- Utilities: Public water; Public sewer
- Home design: Multifamily property (zoned MF); Does not subdivide
- Construction: Composition roof; Slab foundation
- Exterior features: Brick exterior; Level lot; Paved road access
Interior
- Kitchen: Free-standing stove; Dishwasher
- Bedrooms: Twenty-four 2-bedroom units
- Flooring: Laminate
- Heating & cooling: Central electric heating and cooling
- Interior features: Laminate flooring; Central cooling (electric); Central heat (electric)
- Laundry & utility: Tenant pays electricity
Neighborhood map
What this means for you Summary
Snapshot
- This is a 24 × 2-bed/1-bath units multifamily listed at $1.65M.
Deal economics
- At list price, monthly cash flow is $4k ($44k/yr) — positive. Per door: $152/mo.
- The deal already cash-flows at list — no discount required.
- Meets the 1% rule at list price ($18k rent vs $1.65M).
- Recommended offer: $1.63M (1.5% below list) — sets the bar for market timing.
- Cap rate 8.9% vs local median 4.0% in White Hall — top-decile yield for the area; either an underpriced asset or a hidden risk that comps aren't pricing in. Stress-test before assuming the spread holds.
Location & tenants
- Location reads 73/100 on livability (#20 in AR) — a middle-class / working-renter tenant base. Strengths: employment A+, cost of living A+, housing A+; Watch: amenities F, commute F.
- White Hall School District (rural): math 36% / reading 38% proficiency, ranked #86 of 238 in AR (top 36%) — families likely to look elsewhere, expect single-tenant / working-renter base with shorter leases.
- Zoned schools: Taylor Elementary School (math 37% / reading 47%, grade F, #173 of 454 statewide, top 43%, 387 students, 62% FRL); White Hall Junior High School (math 40% / reading 39%, grade F, #92 of 201 statewide, top 50%, 703 students, 54% FRL); White Hall High School (math 23% / reading 34%, grade F, #157 of 292 statewide, top 54%, 969 students, 53% FRL) — zoned schools average 56% FRL vs 36% district-wide (20 pts higher); higher-poverty schools than district average — tighter screening recommended.
- Market conditions: 93 active listings in the ZIP; 62 units permitted in Jefferson County in 2024 (0 in 5+ unit buildings).
Forward outlook
- Local home prices are declining (-3.0%/yr); year-one equity from $11k of loan paydown is wiped out by about $50k of value loss. Plan a longer hold.
- Jefferson County population projected at -33% by 2050 — secular population decline; favor cash flow + early exit over multi-decade hold.
Negotiation context
- It's been on market 20 days — a 2% lower offer ($1.63M) is reasonable based on typical stale-listing flexibility.
- 2 sale attempts with the ask held roughly flat each time — persistent listings suggest the price (not the market) is what's stuck; bring a comps-based counter.
- Current owner paid $1.20M; 38% above their basis — modest negotiation headroom, anchor on the comps not their cost.
Risks & watch-outs
- Climate carrying-cost: extreme-heat days projected 7→20/yr by 2055 (HVAC capex compounding) — expect insurance premiums to compound above CPI over the hold.
Questions for the listing agent
- Can we see the unit-by-unit rent roll, current vacancy, and any below-market leases? What's the average tenancy length?
- What capital expenditures (roof, boiler, parking lot, exteriors) have been made in the last 5 years, and what's planned in the next 2?
- Built in 1973 — when were the roof, HVAC, electrical panel, plumbing, and water heater last replaced?
- Is there a deadline driving the sale (1031 exchange, divorce, estate, relocation)? That informs how much negotiation room exists.
- What's the average days-on-market for RENTAL listings here right now (not sales)? A rising rental-DOM trend means longer vacancies and softer asking-rent achievability than the comps imply.
- What's the recent tenant-quality profile in this submarket — average credit score on applications, eviction rate, late-payment / NSF rate, and stable-employment percentage? A property-management company in the area should have these aggregated.
- How much new apartment / multifamily construction is in the pipeline within 1–3 miles? Heavy new supply (>2% of stock underway) typically softens rents 12–24 months out; light construction supports rent growth.
Investment metrics
- 1% rule
- 1.07% ✓
- Cap rate
- 8.94%
- Cash-on-cash
- 9.47%
- DSCR
- 1.42
- GRM
- 7.8
CMA / ARV
No comps found within radius.
Projected returns pro-forma
-3.0% appreciation · 3.0% rent growth · sell at horizon
- IRR
- -2.0%
- Equity multiple
- 0.92×
- Total profit
- $-35,519
- Equity at exit
- $246,020
- IRR
- 7.6%
- Equity multiple
- 1.58×
- Total profit
- $266,572
- Equity at exit
- $142,662
Cash invested: $462,000 (down + closing). Projections, not guarantees.
Landlord ↔ Tenant lean methodology
- Overall (STATE)
- 92 Strongly Landlord-Friendly
- State Arkansas
- 92 Strongly Landlord-Friendly · R+14
- County
- — inherits STATE
- City
- — inherits STATE
ZIP-level market 71602
- Home prices YoY
- -7.8%
- Active inventory
- 93
- Price-to-rent
- 186.2×
Monthly cashflow live
- Estimated rent
- $17,722 medium interval (Pro) →
- Mortgage (P&I)
- −$8,653
- Tax from tax record
- −$1,014 /mo · $12,167/yr
- Insurance
- −$688
- HOA
- −$0
- Vacancy / Maint / Mgmt
- −$3,722
- Net cashflow
- $3,646
Break-even live
Sensitivity live
| Price | -10% $4,580 | -5% $4,113 | +0% $3,646 | +5% $3,179 | +10% $2,712 |
|---|---|---|---|---|---|
| Rent | -10% $2,246 | -5% $2,946 | +0% $3,646 | +5% $4,346 | +10% $5,046 |
| Rate | -1.0pp $4,477 | -0.5pp $4,066 | base $3,646 | +0.5pp $3,219 | +1.0pp $2,784 |
24-unit breakdown (identical units grouped — click to expand)
| Units | Beds | Baths | Est. rent |
|---|---|---|---|
| 24× units | 2 | 1 | $17,712 |
| #1 | 2 | 1 | $738 |
| #2 | 2 | 1 | $738 |
| #3 | 2 | 1 | $738 |
| #4 | 2 | 1 | $738 |
| #5 | 2 | 1 | $738 |
| #6 | 2 | 1 | $738 |
| #7 | 2 | 1 | $738 |
| #8 | 2 | 1 | $738 |
| #9 | 2 | 1 | $738 |
| #10 | 2 | 1 | $738 |
| #11 | 2 | 1 | $738 |
| #12 | 2 | 1 | $738 |
| #13 | 2 | 1 | $738 |
| #14 | 2 | 1 | $738 |
| #15 | 2 | 1 | $738 |
| #16 | 2 | 1 | $738 |
| #17 | 2 | 1 | $738 |
| #18 | 2 | 1 | $738 |
| #19 | 2 | 1 | $738 |
| #20 | 2 | 1 | $738 |
| #21 | 2 | 1 | $738 |
| #22 | 2 | 1 | $738 |
| #23 | 2 | 1 | $738 |
| #24 | 2 | 1 | $738 |
| Total (24 units) | $17,722 | ||
UW: 25.0% down · 7.5% · 30yr · 1.5% tax · 5.0% vac · 8.0% maint · 8.0% mgmt
Financing live
Cash to close
- Down payment
- $412,500
- Closing costs
- $49,500
- Reserves months
- —
- Total cash needed
- —
Loan-product check · same deal, 3 products live
Conventional
25% down · 7.5% · 30yr
- Down + closing
- —
- Monthly P&I
- —
- Monthly cashflow
- —
- DSCR
- —
- Eligible?
- —
Personal DTI + credit; lowest rate.
DSCR
20% down · 8.5% · 30yr
- Down + closing
- —
- Monthly P&I
- —
- Monthly cashflow
- —
- DSCR
- —
- Eligible?
- —
No personal income docs; deal must DSCR.
Hard money
10% down · 12.0% · 12mo
- Down + closing
- —
- Monthly P&I
- —
- Monthly cashflow
- —
- DSCR
- —
- Eligible?
- —
Short-term bridge; refi at stabilization.
Listing history 15 events
-
2026-06-21days on market $1,650,000 Active 20 DOM
-
2026-06-19days on market $1,650,000 Active 18 DOM
-
2026-06-18days on market $1,650,000 Active 17 DOM
-
2026-06-17days on market $1,650,000 Active 16 DOM
-
2026-06-16days on market $1,650,000 Active 15 DOM
-
2026-06-15days on market $1,650,000 Active 14 DOM
-
2026-06-14days on market $1,650,000 Active 12 DOM
-
2026-06-12days on market $1,650,000 Active 11 DOM
-
2026-06-09days on market $1,650,000 Active 8 DOM
-
2026-06-08statusdays on market $1,650,000 Active 7 DOM
-
2026-06-07days on market $1,650,000 New Listing 6 DOM
-
2026-06-05days on market $1,650,000 New Listing 3 DOM
-
2026-06-03days on market $1,650,000 New Listing 2 DOM
-
2026-06-01remarks 699-char remark
-
2026-06-01$1,650,000 New Listing 1 DOM
ⓘ Source: listings_history table (triggers on properties + properties_extension) + one-shot
backfill from property_details.listing_events for pre-trigger history.
Tax reassessment forecast AR · Resets to sale price
- Current annual tax
- $12,167 · $1,014/mo
- Projected year-2 tax
- $12,167 · $1,014/mo
- Expected delta
- $0/yr ($0/mo · 0.0%)
ⓘ Screening estimate from a state-policy table — verify with the county assessor before closing.
Climate risk First Street
- Flood 1/10 Low FEMA zone X (unshaded) · 0% chance over 30 yrs
- Wildfire 4/10 Moderate
- Heat 7/10 Severe 7 d/yr ≥111°F today · 20 d/yr by 30 yrs out
- Wind 4/10 Moderate 23% chance of damaging wind over 30 yrs
- Air quality 1/10 Low 0 unhealthy d/yr today · 0 by 30 yrs out
Nearby sold comps map
Loading sold comps map…
Walkable amenities ~0.75 mi
Loading nearby amenities…
Taxation est. · year 1
- Rental income
- $212,664
- − Mortgage interest
- −$92,426
- − Property taxes
- −$12,167
- − Insurance
- −$8,250
- − Repairs & maintenance
- −$17,013
- − Management
- −$17,013
- − Depreciation
- −$48,000
- Taxable income
- $17,795
- Est. tax owed @ 24.0%
- −$4,271
- After-tax cash flow
- $39,484/yr
For passive investors: Depreciation is non-cash, so a rental often shows a tax loss while cash-flowing — sheltering income. Rental losses are passive: they offset passive income freely, and up to $25,000/yr can offset ordinary (W-2) income if you actively participate and your MAGI is under $100k (phasing out to $0 by $150k); unused losses carry forward. On sale, claimed depreciation is recaptured at up to 25%, and gains may owe capital-gains tax (a 1031 exchange can defer both). Figures are a year-1 estimate at your 24.0% rate — not tax advice; consult a CPA.
Schools (NCES district)
- District
- White Hall School District
- NCES district ID
- 0514140
- Math proficiency
- 36% ▼ -12.00%
- Reading proficiency
- 38% ▼ -13.00%
- Median HH income
- $51,633
- Composite
- 32.16/100
- National rank
- #5788
- State rank
- #86 of 238 in AR
Livability — White Hall
- Score
- 73/100
- State rank
- #20
- US rank
- #5275
Category grades
Schools grade is shown separately in the Schools card above.
Census & demographics
- Census place
- White Hall, AR
- Population (ZIP)
- 15,922
Population outlook (Jefferson County) Hauer SSP2
- Today (2025)
- 63,110 people
- By 2030
- 58,519 · -7.3%
- By 2040
- 49,740 · -21.2%
- By 2050
- 42,331 · -32.9%
- By 2075
- 29,591 · -53.1%
- By 2100
- 21,047 · -66.7%
Race, ethnicity, and origin ACS 2023
- Neighborhood character
- Diverse neighborhood (Simpson 0.56)
- Race & ethnicity
- White 58% Black 32% Two or more races 5% Hispanic / Latino 4% Asian 1%
- Common ancestry
- Italian 1% Slovak 1% Serbian 1%
- Foreign-born
- 2% · Canada
- Languages at home
- 95% English-only · Spanish 3% Other Indo-European 1%
Political lean MEDSL · Jefferson
- 2024 margin
- Strong D (+20.1) · D 59.2% · R 39.2% · Other 1.6%
- 2008→2024 swing
- -6.2pp toward R · 2008: 26.3pp · 2024: 20.1pp
- All cycles
- 2024: D+20.1 2020: D+21.7 2016: D+25.3 2012: D+29.0 2008: D+26.3
Not yet ingested
- Civics
- —
Market trends
- HPI YoY
- ▼ -18.84%
- Current HPI
- 223.9305
- Rent YoY
- —
- Metro
- —
- State GDP YoY
- ▲ 3.80%
- F500 in state
- 10
Industry mix (Fortune 500 HQ in AR)
| Industry | F500 HQs | Revenue |
|---|---|---|
| Retail | 1 | $681B |
|
||
| Food / Agriculture | 1 | $53B |
|
||
| Retail / Energy | 1 | $22B |
|
||
| Transportation / Logistics | 1 | $12B |
|
||
| Energy | 1 | $4B |
|
||
Price history
+153.8% since first listed7 events — show timeline
- 2026-06-01 Listed $1,650,000 CARMLS
- 2025-06-23 Pending — CARMLS
- 2025-06-11 Sold (Public Records) $1,200,000 Public Records
- 2025-06-11 Sold (MLS) $1,200,000 CARMLS
- 2025-05-06 Contingent — CARMLS
- 2025-04-21 Listed $1,250,000 CARMLS
- 2020-04-01 Sold (Public Records) $650,000 Public Records
Property tax history
+3.4%/yrLatest (2025): $12,167 · +0.0% YoY. Source: county tax records.
Cash-flow waterfall
monthlySold comps — $/sqft
last 12 mo · ≤1 miLoading sold comps…