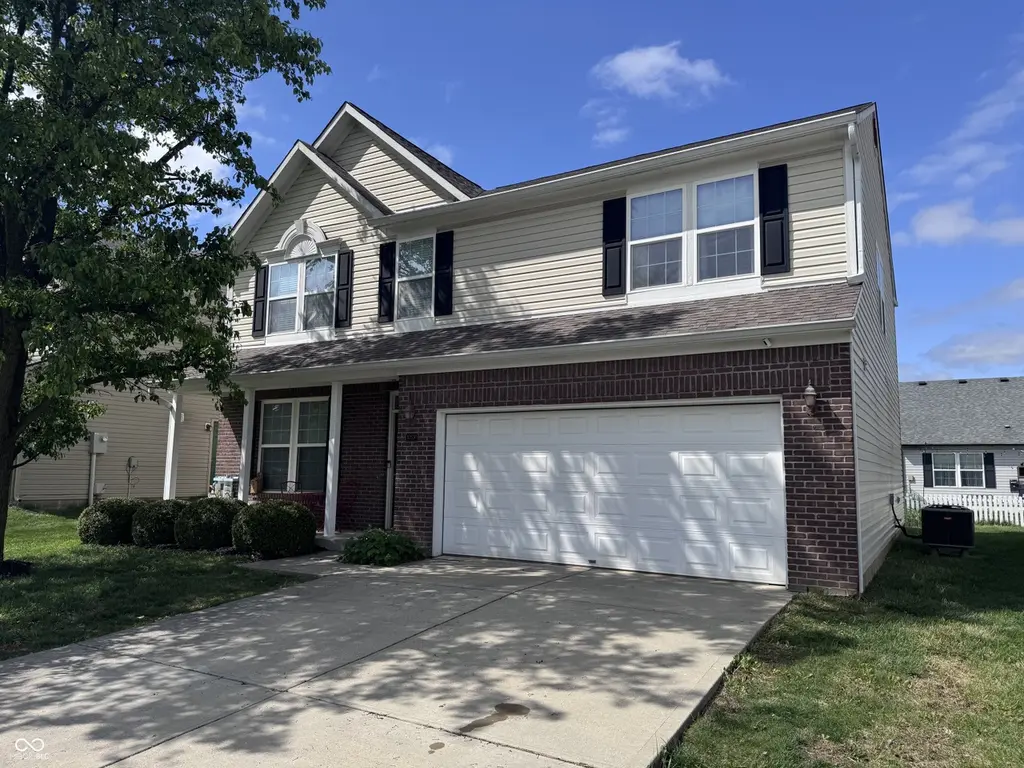
10530 Lookout Ln · Brownsburg, IN
Flood risk 1/10 · Minimal
- FEMA flood zone
- X (unshaded)
- Chance of flooding over 30 yrs
- 0.0%
- Est. flood insurance / yr
- $507 – $1,088
Fire risk 1/10 · Minimal
- Est. fire insurance / yr
- $717 – $1,331
Heat risk 4/10 · Minor
- Hot days now (above 101°F)
- 7 days/yr
- Hot days in 30 yrs
- 20 days/yr
Wind risk 2/10 · Minimal
- Chance of severe wind over 30 yrs
- 0.0%
Air-quality risk 4/10 · Minor
- Unhealthy air days now
- 4 days/yr
- Unhealthy air days in 30 yrs
- 5 days/yr
Risk factors via First Street. Map © Google.
Why this score? — see what drove the D grade
The composite is a weighted blend of 9 inputs, each scored 0–100. Each bar is that input's sub-score; the figure is the points it added to the 100-point composite (weight × sub-score).
- Cash flow +11.0/30.0
- ARV discount +8.4/15.0
- Schools +4.7/10.0
- Rent growth +4.4/5.0
- Livability +3.8/5.0
- DSCR +3.2/10.0
- 1% rule +3.0/10.0
- Condition / age +2.5/5.0
- Appreciation +0.0/10.0
$305,000
🖨 Deal sheet (PDF) 📄 Offer letter ✓ Due diligence
Listing remarks MLS
Spacious & Immaculate best describes this wonderful home. Wood burning fireplace flanked by enormous windows in the great room. Note the new lighting & fresh paint. Expansive kitchen includes huge walk-in pantry & newer appliances. Upstairs, a massive master suite boasts a whirlpool tub & separate shower. You will love the upstairs loft space which separates the additional bedrooms, all of which feature walk-in closets. This home is a must see, get in and make it yours. Welcome home.
Key facts
- 5,227 sq ft lot
- 2 garage spots
- Community pool
Property features AI
Finance
- Other: Association fee includes entrance common, insurance, maintenance, nature area, park/playground, snow removal and tennis courts
- HOA & community: Homeowners association with annual fee; HOA provides community pool; Annual association fee
Exterior
- Parking: Attached garage; Two-car garage (approximately 441 sq ft)
- Security: Smoke detectors
- Utilities: Public water; Municipal sewer connected; Cable available
- Home design: Single-family residence; Two levels; Planned unit development with mandatory fees
- Construction: Vinyl with brick and brick exterior; Slab foundation
- Exterior features: Covered patio/porch; Sidewalks; Street lights; Small trees (under 20 ft)
Interior
- Kitchen: Dishwasher; Electric oven; Microwave (with hood); Refrigerator; Garbage disposal
- Bedrooms: Three upper-level bedrooms; Primary bedroom with walk-in closet
- Bathrooms: Two full bathrooms; One half bathroom; Primary bathroom with double sinks, full shower stall, suite layout and whirlpool tub
- Heating & cooling: Forced air heating (electric); Central air conditioning
- Interior features: Attic access; High vaulted ceilings; Painted woodwork; Kitchen island; Pantry; Living room (formal); Wood-burning fireplace in great room / living room
- Laundry & utility: Washer; Dryer; Main-level laundry; Electric water heater
Neighborhood map
What this means for you Summary
Snapshot
- This is a 3-bed/2.5-bath single-family listed at $305k.
Deal economics
- At list price, monthly cash flow is $-130 ($-2k/yr) — negative.
- To cash-flow at today's rent, offer at most $282k (7.5% below list).
- To meet the 1% rule (rent ≥ 1% of price), the offer needs to be $243k (20.4% below list).
- Recommended offer: $243k (20.4% below list) — sets the bar for 1% rule.
- Cap rate 5.8% vs local median 3.8% in Brownsburg — top-decile yield for the area; either an underpriced asset or a hidden risk that comps aren't pricing in. Stress-test before assuming the spread holds.
Location & tenants
- Location reads 75/100 on livability (#61 in IN, #4,105 nationally) — a middle-class / working-renter tenant base. Strengths: crime A+, employment A+, cost of living A+; Watch: amenities F, commute F, health & safety F.
- Avon Community School Corporation (suburban): math 51% / reading 53% proficiency, ranked #32 of 301 in IN (top 11%) — acceptable for families but not a draw, mixed tenant base, ~2y average lease; only 20% free/reduced lunch — higher-income household profile.
- Zoned schools: River Birch Elementary School (math 64% / reading 48%, grade C+, #183 of 994 statewide, top 19%, 655 students, 39% FRL); Avon Middle School North (math 45% / reading 55%, grade C, #48 of 330 statewide, top 15%, 854 students, 42% FRL); Avon High School (math 44% / reading 76%, grade C+, #46 of 369 statewide, top 13%, 3,348 students, 38% FRL) — zoned schools average 40% FRL vs 20% district-wide (20 pts higher); higher-poverty schools than district average — tighter screening recommended.
- Market conditions: Rents rising fast (+7.6%/yr); 66 active listings in the ZIP; 5 comparable units currently listed for rent nearby; rentals at typical pace (median 17d on market — plan ~3-4 weeks tenant-placement turnaround); 40% of comp listings sitting > 30 days — soft ceiling on asking rent; solid renter incomes; 1,294 units permitted in Hendricks County in 2024 (18 in 5+ unit buildings).
- This rent runs 35% of the median local income ($83k/yr) — at the standard rent-burdened threshold; future hikes will face affordability resistance.
Forward outlook
- Local home prices are declining (-3.0%/yr); year-one equity from $2k of loan paydown is wiped out by about $9k of value loss. Plan a longer hold.
- Hendricks County population projected at +35% by 2050 — long-run rental-demand tailwind backs the buy-and-hold thesis.
Negotiation context
- Only 5 days on market — expect competitive offers; lowballing is unlikely to land.
- 2 sale attempts since 14y ago with the ask held roughly flat each time — persistent listings suggest the price (not the market) is what's stuck; bring a comps-based counter.
Questions for the listing agent
- What do current leases actually rent for vs. the listed asking? Can we see a recent rent roll and the last 12 months of T-12 income?
- What does the HOA fee cover, when was the last increase, and are there any pending special assessments or reserve-fund shortfalls?
- Is there a deadline driving the sale (1031 exchange, divorce, estate, relocation)? That informs how much negotiation room exists.
- Schools are A-rated — typically a magnet for longer-tenancy family renters. What's the average tenant stay here, and is there a school-zone premium baked into asking?
- The area grade is low — what's the realistic commute time and amenity access for the typical tenant pool here? Any planned neighborhood developments (good or bad) we should know about?
- What's the average days-on-market for RENTAL listings here right now (not sales)? A rising rental-DOM trend means longer vacancies and softer asking-rent achievability than the comps imply.
- What's the recent tenant-quality profile in this submarket — average credit score on applications, eviction rate, late-payment / NSF rate, and stable-employment percentage? A property-management company in the area should have these aggregated.
- How much new for-sale + rental construction is in the pipeline within 1–3 miles? Heavy new supply typically softens prices + rents 12–24 months out; constrained supply supports both.
Investment metrics
- 1% rule
- 0.80% ✗
- Cap rate
- 5.78%
- Cash-on-cash
- -1.82%
- DSCR
- 0.92
- GRM
- 10.5
CMA / ARV
- ARV (median comp)
- $311,433
- List price
- $305,000
- Delta
- -2.07%
- Verdict
- FAIR
- Comps
- 20 within 1.0 mi
Show comp detail 12 sales within ~0.75 mi
| Address | Dist | Beds/Ba | Sqft | Sold | Price | $/sf | Match |
|---|---|---|---|---|---|---|---|
| 10530 Lookout Ln | 0.00mi | 3/2.5 | 2,295 (0%) | 0mo | $305,000 | $133 | 100 |
| 10487 Secretariat Dr | 0.09mi | 3/2.5 | 2,254 (-2%) | 8mo | $315,000 | $140 | 86 |
| 10450 Wintergreen Way | 0.13mi | 3/2.5 | 2,254 (-2%) | 7mo | $305,000 | $135 | 85 |
| 2363 Tobello Blvd | 0.18mi | 3/2.5 | 2,137 (-7%) | 3mo | $310,000 | $145 | 78 |
| 10420 Day Star Dr | 0.18mi | 3/2.5 | 2,147 (-6%) | 11mo | $280,000 | $130 | 72 |
| 10432 Dark Star Dr | 0.11mi | 3/2.5 | 2,032 (-12%) | 11mo | $300,000 | $148 | 66 |
| 10452 Dark Star Dr | 0.09mi | 3/2.5 | 1,970 (-14%) | 8mo | $285,000 | $145 | 66 |
| 2350 Seattle Slew Dr | 0.21mi | 3/2.0 | 1,986 (-14%) | 5mo | $305,000 | $154 | 61 |
| 10780 Affirmed Dr | 0.38mi | 3/2.5 | 2,476 (+8%) | 10mo | $319,900 | $129 | 61 |
| 10419 Dark Star Dr | 0.11mi | 3/2.5 | 1,960 (-15%) | 11mo | $280,000 | $143 | 61 |
| 1905 Persimmon Grove Dr | 0.52mi | 3/3.0 | 2,214 (-4%) | 9mo | $338,000 | $153 | 60 |
| 10890 Poppy Hill Dr | 0.58mi | 4/3.5 (+1) | 2,488 (+8%) | 9mo | $370,000 | $149 | 42 |
Match score weights: distance 35% · size 25% · config 20% · recency 20%. Top-matched comps best support the ARV.
Projected returns pro-forma
-3.0% appreciation · 7.56% rent growth · sell at horizon
- IRR
- -14.5%
- Equity multiple
- 0.46×
- Total profit
- $-46,037
- Equity at exit
- $45,476
- IRR
- 0.3%
- Equity multiple
- 1.02×
- Total profit
- $1,800
- Equity at exit
- $26,371
Cash invested: $85,400 (down + closing). Projections, not guarantees.
Landlord ↔ Tenant lean methodology
- Overall (STATE)
- 90 Strongly Landlord-Friendly
- State Indiana
- 90 Strongly Landlord-Friendly · R+11
- County
- — inherits STATE
- City
- — inherits STATE
ZIP-level market 46234
- Home prices YoY
- -33.0%
- Rents YoY
- 7.6%
- Active inventory
- 66
- Price-to-rent
- 10.5×
Monthly cashflow live
- Estimated rent
- $2,427 high interval (Pro) →
- Mortgage (P&I)
- −$1,599
- Tax from tax record
- −$273 /mo · $3,274/yr
- Insurance
- −$127
- HOA
- −$48
- Vacancy / Maint / Mgmt
- −$510
- Net cashflow
- $-130
Break-even live
Sensitivity live
| Price | -10% $43 | -5% $-43 | +0% $-130 | +5% $-216 | +10% $-302 |
|---|---|---|---|---|---|
| Rent | -10% $-321 | -5% $-226 | +0% $-130 | +5% $-34 | +10% $62 |
| Rate | -1.0pp $24 | -0.5pp $-52 | base $-130 | +0.5pp $-209 | +1.0pp $-289 |
UW: 25.0% down · 7.5% · 30yr · 1.5% tax · 5.0% vac · 8.0% maint · 8.0% mgmt
Financing live
Cash to close
- Down payment
- $76,250
- Closing costs
- $9,150
- Reserves months
- —
- Total cash needed
- —
Loan-product check · same deal, 3 products live
Conventional
25% down · 7.5% · 30yr
- Down + closing
- —
- Monthly P&I
- —
- Monthly cashflow
- —
- DSCR
- —
- Eligible?
- —
Personal DTI + credit; lowest rate.
DSCR
20% down · 8.5% · 30yr
- Down + closing
- —
- Monthly P&I
- —
- Monthly cashflow
- —
- DSCR
- —
- Eligible?
- —
No personal income docs; deal must DSCR.
Hard money
10% down · 12.0% · 12mo
- Down + closing
- —
- Monthly P&I
- —
- Monthly cashflow
- —
- DSCR
- —
- Eligible?
- —
Short-term bridge; refi at stabilization.
Rent comps 5 comps
| Address | Beds | Baths | Sqft | Rent | $/sqft | DOM | Units | Dist |
|---|---|---|---|---|---|---|---|---|
| 10440 Wintergreen Way Indianapolis, IN | 3.0 | 2.5 | 2416 | $2,281 | $0.94 | 45d | 1 | 0.12mi |
| 10483 Day Star Dr Indianapolis, IN | 3.0 | 2.5 | 1840 | $2,071 | $1.13 | 45d | 1 | 0.18mi |
| 10363 Fairmont Ln Unit 1522300P Indianapolis, IN | 3.0 | 2.0 | 2152 | $3,695 | $1.72 | 4d | 1 | 1.07mi |
| 1267 Constitution Dr Indianapolis, IN | 4.0 | 2.5 | 2228 | $2,455 | $1.10 | 16d | 1 | 1.19mi |
| 10301 Kensington Way Indianapolis, IN | 3.0 | 3.5 | 2636 | $2,430 | $0.92 | 6d | 1 | 1.22mi |
HOA detail
- Monthly dues
- $48 · $576/yr
- Likely covers
- pool
Listing history 5 events
-
2026-05-03status Pending 770-char remark
-
2026-04-28$305,000 Active 770-char remark
-
2012-08-17historical 505-char remark
Show marketing remark (505 chars)
Spacious & Immaculate best describes this wonderful home. Wood burning fireplace flanked by enormous windows in the great room. Note the new lighting & fresh paint. Expansive kitchen includes huge walk-in pantry & newer appliances. Upstairs, a massive master suite boasts a whirlpool tub & separate shower. You will love the upstairs loft space which separates the additional bedrooms, all of which feature walk-in closets. This home is a must see, get in and make it yours. Welcome home.
-
2012-08-16soldstatus $135,000 505-char remark
Show marketing remark (505 chars)
Spacious & Immaculate best describes this wonderful home. Wood burning fireplace flanked by enormous windows in the great room. Note the new lighting & fresh paint. Expansive kitchen includes huge walk-in pantry & newer appliances. Upstairs, a massive master suite boasts a whirlpool tub & separate shower. You will love the upstairs loft space which separates the additional bedrooms, all of which feature walk-in closets. This home is a must see, get in and make it yours. Welcome home.
-
2012-07-05$137,900 505-char remark
Show marketing remark (505 chars)
Spacious & Immaculate best describes this wonderful home. Wood burning fireplace flanked by enormous windows in the great room. Note the new lighting & fresh paint. Expansive kitchen includes huge walk-in pantry & newer appliances. Upstairs, a massive master suite boasts a whirlpool tub & separate shower. You will love the upstairs loft space which separates the additional bedrooms, all of which feature walk-in closets. This home is a must see, get in and make it yours. Welcome home.
ⓘ Source: listings_history table (triggers on properties + properties_extension) + one-shot
backfill from property_details.listing_events for pre-trigger history.
Tax reassessment forecast IN · Partial reset (capped growth)
- Current annual tax
- $3,274 · $273/mo
- Projected year-2 tax
- $3,274 · $273/mo
- Expected delta
- $0/yr ($0/mo · 0.0%)
ⓘ Screening estimate from a state-policy table — verify with the county assessor before closing.
Climate risk First Street
- Flood 1/10 Low FEMA zone X (unshaded) · 0% chance over 30 yrs
- Wildfire 1/10 Low
- Heat 4/10 Moderate 7 d/yr ≥101°F today · 20 d/yr by 30 yrs out
- Wind 2/10 Low 0% chance of damaging wind over 30 yrs
- Air quality 4/10 Moderate 4 unhealthy d/yr today · 5 by 30 yrs out
Nearby sold comps map
Loading sold comps map…
Walkable amenities ~0.75 mi
Loading nearby amenities…
Taxation est. · year 1
- Rental income
- $29,129
- − Mortgage interest
- −$17,085
- − Property taxes
- −$3,274
- − Insurance
- −$1,525
- − Repairs & maintenance
- −$2,330
- − Management
- −$2,330
- − HOA
- −$576
- − Depreciation
- −$8,873
- Taxable loss
- −$6,864
- Est. tax savings @ 24.0%
- +$1,647
- After-tax cash flow
- $91/yr
For passive investors: Depreciation is non-cash, so a rental often shows a tax loss while cash-flowing — sheltering income. Rental losses are passive: they offset passive income freely, and up to $25,000/yr can offset ordinary (W-2) income if you actively participate and your MAGI is under $100k (phasing out to $0 by $150k); unused losses carry forward. On sale, claimed depreciation is recaptured at up to 25%, and gains may owe capital-gains tax (a 1031 exchange can defer both). Figures are a year-1 estimate at your 24.0% rate — not tax advice; consult a CPA.
Schools (NCES district)
- District
- Avon Community School Corporation
- NCES district ID
- 1800270
- Math proficiency
- 51% ▼ -8.00%
- Reading proficiency
- 53% ▼ -8.00%
- Median HH income
- $75,987
- Composite
- 46.93/100
- National rank
- #2362
- State rank
- #32 of 301 in IN
Livability — Brownsburg
- Score
- 75/100
- State rank
- #61
- US rank
- #4105
Category grades
Schools grade is shown separately in the Schools card above.
Census & demographics
- County
- Marion County · 998,460 people
- City population
- 44,220
- Metro
- Indianapolis-Carmel-Anderson, IN
- Population (ZIP)
- 28,300
- Household income
- $83,190
- Rent vs Own
- Severe rent burden
- 764.0
Population outlook (Hendricks County) Hauer SSP2
- Today (2025)
- 187,418 people
- By 2030
- 201,494 · +7.5%
- By 2040
- 228,487 · +21.9%
- By 2050
- 253,068 · +35.0%
- By 2075
- 308,920 · +64.8%
- By 2100
- 336,510 · +79.6%
Race, ethnicity, and origin ACS 2023
- Neighborhood character
- Diverse neighborhood (Simpson 0.56)
- Race & ethnicity
- White 63% Black 19% Hispanic / Latino 10% Two or more races 7% Asian 4%
- Hispanic origin (detail)
- Mexican 6%
- Common ancestry
- Italian 2% Romanian 2% Iranian 2%
- Foreign-born
- 11% · Canada, China, United Kingdom
- Languages at home
- 82% English-only · Spanish 8% Other Indo-European 3% French/Haitian/Cajun 3%
Political lean MEDSL · Hendricks
- 2024 margin
- Strong R (+21.5) · D 38.4% · R 59.9% · Other 1.7%
- 2008→2024 swing
- +1.9pp toward D · 2008: -23.4pp · 2024: -21.5pp
- All cycles
- 2024: R+21.5 2020: R+23.9 2016: R+34.2 2012: R+34.9 2008: R+23.4
Not yet ingested
- Civics
- —
Market trends
- HPI YoY
- ▼ -106.23%
- Current HPI
- 215.5854
- Rent YoY
- ▲ 7.56%
- Metro
- Indianapolis-Carmel-Anderson, IN
- State GDP YoY
- ▲ 2.90%
- F500 in state
- 18
Industry mix (Fortune 500 HQ in IN)
| Industry | F500 HQs | Revenue |
|---|---|---|
| Industrial Machinery | 2 | $37B |
|
||
| Healthcare | 1 | $177B |
|
||
| Pharmaceuticals | 1 | $45B |
|
||
| Metals / Steel | 1 | $18B |
|
||
| Agriculture | 1 | $17B |
|
||
| Packaging | 1 | $12B |
|
||
Price history
+121.2% since first listed6 events — show timeline
- 2026-06-16 Sold (MLS) $305,000 MIBOR as Distributed by MLS Grid
- 2026-05-03 Pending — MIBOR as Distributed by MLS Grid
- 2026-04-28 Listed $305,000 MIBOR as Distributed by MLS Grid
- 2012-08-17 Listing Removed — MIBOR as Distributed by MLS Grid
- 2012-08-16 Sold (MLS) $135,000 MIBOR as Distributed by MLS Grid
- 2012-07-05 Listed $137,900 MIBOR as Distributed by MLS Grid
Property tax history
+7.4%/yrLatest (2025): $3,274 · +7.3% YoY. Source: county tax records.
Cash-flow waterfall
monthlySold comps — $/sqft
last 12 mo · ≤1 miLoading sold comps…