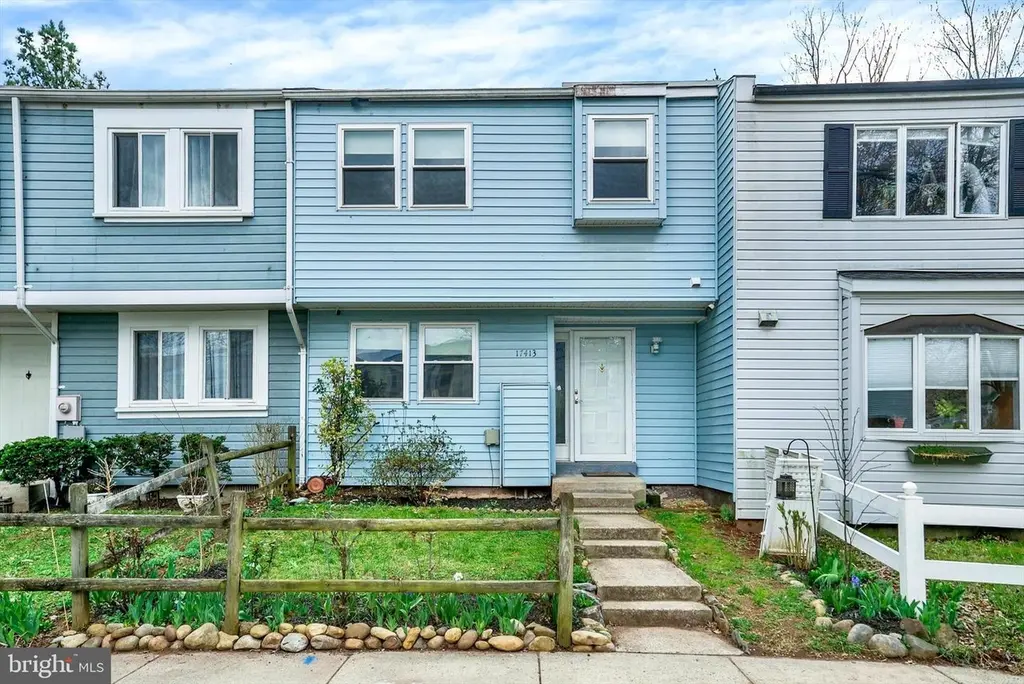
17413 Hoskinson Rd · Poolesville, MD
Flood risk 1/10 · Minimal
- FEMA flood zone
- X (unshaded)
- Chance of flooding over 30 yrs
- 0.0%
- Est. flood insurance / yr
- $507 – $1,088
Fire risk 1/10 · Minimal
- Est. fire insurance / yr
- $755 – $1,403
Heat risk 6/10 · Moderate
- Hot days now (above 103°F)
- 7 days/yr
- Hot days in 30 yrs
- 16 days/yr
Wind risk 4/10 · Minor
- Chance of severe wind over 30 yrs
- 11.0%
Air-quality risk 3/10 · Minor
- Unhealthy air days now
- 2 days/yr
- Unhealthy air days in 30 yrs
- 3 days/yr
Risk factors via First Street. Map © Google.
Why this score? — see what drove the D grade
The composite is a weighted blend of 9 inputs, each scored 0–100. Each bar is that input's sub-score; the figure is the points it added to the 100-point composite (weight × sub-score).
- Cash flow +13.5/30.0
- ARV discount +10.4/15.0
- DSCR +4.1/10.0
- 1% rule +3.6/10.0
- Schools +3.6/10.0
- Livability +3.5/5.0
- Rent growth +2.5/5.0
- Condition / age +2.5/5.0
- Appreciation +0.0/10.0
$325,000
🖨 Deal sheet 📄 Offer letter ✓ Due diligence
Listing remarks
Major updates already completed—move in with confidence as this home is being sold as-is! The home features a roof replaced in 2023, a Bryant HVAC system (2019), and a Rheem water heater installed in 2025, offering solid long-term value and peace of mind. Located in highly desirable Poolesville, this charming three-bedroom, two-and-a-half-bath home offers a functional and comfortable layout with incredible bones and room to make it your own. Enjoy the convenience of in-home laundry, assigned parking with additional guest spaces, and a sliding glass door that opens to a private fenced yard—perfect for relaxing or entertaining. Ideally situated within walking distance to Poolesvil
Key facts
- Rheem water heater
- Bryant hvac system
- In-home laundry
Tags
Property features AI
Finance
- Other: Finished above-grade living area per assessor; No basement; Year built and living area source per assessor; In city limits (Town of Poolesville)
- HOA & community: HOA fee $282.95 quarterly; HOA covers snow removal; Community amenities include basketball courts and a tot lot/playground
Exterior
- Parking: Assigned parking in a parking lot (2 spaces). Assigned space number 17413
- Utilities: Public water; Public sewer; Electric service for heating, cooling, and hot water
- Home design: Interior townhouse/rowhouse; Fee simple ownership
- Construction: Frame construction; Architectural shingle roof; Crawl space foundation
- Exterior features: Not on tidal water; Above grade and below grade structures noted
Interior
- Bedrooms: Three bedrooms on the upper level
- Flooring: Carpet flooring
- Bathrooms: Two full bathrooms on upper level; One half bathroom on main level; Two full bathrooms total, one half bathroom total
- Heating & cooling: Forced air heating (electric); Central air conditioning with ceiling fans; Electric hot water
- Interior features: Has one fireplace; Property has a property manager
Neighborhood map
What this means for you Summary
Snapshot
- This is a 3-bed/2.5-bath townhouse listed at $325k.
Deal economics
- At list price, monthly cash flow is $11 ($133/yr) — positive.
- The deal already cash-flows at list — no discount required.
- To meet the 1% rule (rent ≥ 1% of price), the offer needs to be $280k (13.8% below list).
- Recommended offer: $280k (13.8% below list) — sets the bar for 1% rule.
- Cap rate 6.3% vs local median 1.0% in Poolesville — top-decile yield for the area; either an underpriced asset or a hidden risk that comps aren't pricing in. Stress-test before assuming the spread holds.
Location & tenants
- Location reads 70/100 on livability (#169 in MD) — a middle-class / working-renter tenant base. Strengths: schools A+, crime A+, employment A+; Watch: amenities D-, commute F, cost of living F.
- Montgomery County Public Schools (suburban): math 27% / reading 45% proficiency, ranked #3 of 24 in MD (top 12%) — families likely to look elsewhere, expect single-tenant / working-renter base with shorter leases.
- Market conditions: 45 active listings in the ZIP; 1 comparable units currently listed for rent nearby; 3,880 units permitted in Montgomery County in 2024 (2,054 in 5+ unit buildings).
Forward outlook
- Local home prices are declining (-3.0%/yr); year-one equity from $2k of loan paydown is wiped out by about $10k of value loss. Plan a longer hold.
- Montgomery County population projected at +27% by 2050 — long-run rental-demand tailwind backs the buy-and-hold thesis.
Negotiation context
- It's been on market 23 days — a 2% lower offer ($320k) is reasonable based on typical stale-listing flexibility.
- Current owner paid $55k; list at $325k implies a 491% gain — meaningful room to come down on a strong offer.
Risks & watch-outs
- Climate carrying-cost: extreme-heat days projected 7→16/yr by 2055 (HVAC capex compounding) — expect insurance premiums to compound above CPI over the hold.
Questions for the listing agent
- Built in 1977 — when were the roof, HVAC, electrical panel, plumbing, and water heater last replaced?
- What does the HOA fee cover, when was the last increase, and are there any pending special assessments or reserve-fund shortfalls?
- Is there a deadline driving the sale (1031 exchange, divorce, estate, relocation)? That informs how much negotiation room exists.
- Schools are A-rated — typically a magnet for longer-tenancy family renters. What's the average tenant stay here, and is there a school-zone premium baked into asking?
- The area grade is low — what's the realistic commute time and amenity access for the typical tenant pool here? Any planned neighborhood developments (good or bad) we should know about?
- What's the average days-on-market for RENTAL listings here right now (not sales)? A rising rental-DOM trend means longer vacancies and softer asking-rent achievability than the comps imply.
- What's the recent tenant-quality profile in this submarket — average credit score on applications, eviction rate, late-payment / NSF rate, and stable-employment percentage? A property-management company in the area should have these aggregated.
- How much new for-sale + rental construction is in the pipeline within 1–3 miles? Heavy new supply typically softens prices + rents 12–24 months out; constrained supply supports both.
Investment metrics
- 1% rule
- 0.86% ✗
- Cap rate
- 6.33%
- Cash-on-cash
- 0.15%
- DSCR
- 1.01
- GRM
- 9.7
CMA / ARV
- ARV (on-the-fly)
- $347,688
- Comps found
- 12
Show comp detail 12 sales within ~0.75 mi
| Address | Dist | Beds/Ba | Sqft | Sold | Price | $/sf | Match |
|---|---|---|---|---|---|---|---|
| 17413 Hoskinson Rd | 0.00mi | 3/2.5 | 1,317 (0%) | 1mo | $325,000 | $247 | 99 |
| 17425 Hughes Rd | 0.10mi | 3/2.5 | 1,317 (0%) | 3mo | $356,100 | $270 | 92 |
| 17500 Hoskinson Rd | 0.06mi | 3/2.5 | 1,349 (+2%) | 6mo | $320,000 | $237 | 88 |
| 19724 Wootton Ave | 0.09mi | 3/2.5 | 1,349 (+2%) | 7mo | $354,000 | $262 | 86 |
| 19728 Wootton Ave | 0.10mi | 3/2.5 | 1,413 (+7%) | 2mo | $372,500 | $264 | 81 |
| 19656 Wootton Ave | 0.13mi | 3/2.5 | 1,413 (+7%) | 3mo | $240,000 | $170 | 79 |
| 17422 Hughes Rd | 0.06mi | 3/2.5 | 1,413 (+7%) | 7mo | $355,000 | $251 | 79 |
| 17427 Hughes Rd | 0.10mi | 3/2.5 | 1,237 (-6%) | 12mo | $213,000 | $172 | 75 |
| 17422 Hoskinson Rd | 0.05mi | 4/2.5 (+1) | 1,400 (+6%) | 14mo | $374,750 | $268 | 71 |
| 17532 Kohlhoss Rd | 0.36mi | 3/2.5 | 1,200 (-9%) | 2mo | $390,000 | $325 | 67 |
| 17607 Kohlhoss Rd | 0.43mi | 3/2.5 | 1,200 (-9%) | 10mo | $360,000 | $300 | 57 |
| 17677 Kohlhoss Rd | 0.50mi | 3/2.5 | 1,200 (-9%) | 10mo | $396,000 | $330 | 54 |
Match score weights: distance 35% · size 25% · config 20% · recency 20%. Top-matched comps best support the ARV.
Projected returns pro-forma
-3.0% appreciation · 3.0% rent growth · sell at horizon
- IRR
- -16.1%
- Equity multiple
- 0.43×
- Total profit
- $-51,941
- Equity at exit
- $48,459
- IRR
- -7.7%
- Equity multiple
- 0.51×
- Total profit
- $-44,259
- Equity at exit
- $28,100
Cash invested: $91,000 (down + closing). Projections, not guarantees.
Landlord ↔ Tenant lean methodology
- Overall (STATE)
- 27 Tenant-Leaning
- State Maryland
- 27 Tenant-Leaning · D+14
- County
- — inherits STATE
- City
- — inherits STATE
ZIP-level market 20837
- Home prices YoY
- -34.2%
- Active inventory
- 45
- Price-to-rent
- 9.7×
Monthly cashflow live
- Estimated rent
- $2,800 medium interval (Pro) →
- Mortgage (P&I)
- −$1,704
- Tax from tax record
- −$267 /mo · $3,206/yr
- Insurance
- −$135
- HOA
- −$94
- Vacancy / Maint / Mgmt
- −$588
- Net cashflow
- $11
Break-even live
UW: 25.0% down · 7.5% · 30yr · 1.5% tax · 5.0% vac · 8.0% maint · 8.0% mgmt
Financing live
Cash to close
- Down payment
- $81,250
- Closing costs
- $9,750
- Reserves months
- —
- Total cash needed
- —
Loan-product check · same deal, 3 products live
Conventional
25% down · 7.5% · 30yr
- Down + closing
- —
- Monthly P&I
- —
- Monthly cashflow
- —
- DSCR
- —
- Eligible?
- —
Personal DTI + credit; lowest rate.
DSCR
20% down · 8.5% · 30yr
- Down + closing
- —
- Monthly P&I
- —
- Monthly cashflow
- —
- DSCR
- —
- Eligible?
- —
No personal income docs; deal must DSCR.
Hard money
10% down · 12.0% · 12mo
- Down + closing
- —
- Monthly P&I
- —
- Monthly cashflow
- —
- DSCR
- —
- Eligible?
- —
Short-term bridge; refi at stabilization.
Rent comps 1 comps
| Address | Beds | Baths | Sqft | Rent | $/sqft | DOM | Units | Dist |
|---|---|---|---|---|---|---|---|---|
| 18600 Jerusalem Church Rd Poolesville, MD | 4.0 | 3.0 | 1150 | $2,800 | $2.43 | 24d | 1 | 1.39mi |
HOA detail
- Monthly dues
- $94 · $1,128/yr
- Likely covers
- waterpoolparking
Listing history 4 events
-
2026-05-13status Pending
-
2026-04-25historical Active Under Contract
-
2026-04-02$325,000 Active
-
1980-05-06soldstatus $55,000
ⓘ Source: listings_history table (triggers on properties + properties_extension) + one-shot
backfill from property_details.listing_events for pre-trigger history.
Tax reassessment forecast MD · Partial reset (capped growth)
- Current annual tax
- $3,206 · $267/mo
- Projected year-2 tax
- $3,374 · $281/mo
- Expected delta
- +$168/yr (+$14/mo · 5.3%)
ⓘ Screening estimate from a state-policy table — verify with the county assessor before closing.
Climate risk First Street
- Flood 1/10 Low FEMA zone X (unshaded) · 0% chance over 30 yrs
- Wildfire 1/10 Low
- Heat 6/10 Major 7 d/yr ≥103°F today · 16 d/yr by 30 yrs out
- Wind 4/10 Moderate 11% chance of damaging wind over 30 yrs
- Air quality 3/10 Moderate 2 unhealthy d/yr today · 3 by 30 yrs out
Nearby sold comps map
Loading sold comps map…
Walkable amenities ~0.75 mi
Loading nearby amenities…
Taxation est. · year 1
- Rental income
- $33,600
- − Mortgage interest
- −$18,205
- − Property taxes
- −$3,206
- − Insurance
- −$1,625
- − Repairs & maintenance
- −$2,688
- − Management
- −$2,688
- − HOA
- −$1,128
- − Depreciation
- −$9,455
- Taxable loss
- −$5,394
- Est. tax savings @ 24.0%
- +$1,295
- After-tax cash flow
- $1,428/yr
For passive investors: Depreciation is non-cash, so a rental often shows a tax loss while cash-flowing — sheltering income. Rental losses are passive: they offset passive income freely, and up to $25,000/yr can offset ordinary (W-2) income if you actively participate and your MAGI is under $100k (phasing out to $0 by $150k); unused losses carry forward. On sale, claimed depreciation is recaptured at up to 25%, and gains may owe capital-gains tax (a 1031 exchange can defer both). Figures are a year-1 estimate at your 24.0% rate — not tax advice; consult a CPA.
Schools (NCES district)
- District
- Montgomery County Public Schools
- NCES district ID
- 2400480
- Math proficiency
- 27% ▼ -21.00%
- Reading proficiency
- 45% ▼ -10.00%
- Median HH income
- $97,191
- Composite
- 35.62/100
- National rank
- #4889
- State rank
- #3 of 24 in MD
Livability — Poolesville
- Score
- 70/100
- State rank
- #169
- US rank
- #7582
Category grades
Schools grade is shown separately in the Schools card above.
Census & demographics
- Census place
- Poolesville, MD
- Population (ZIP)
- 6,605
Population outlook (Montgomery County) Hauer SSP2
- Today (2025)
- 1,173,231 people
- By 2030
- 1,237,402 · +5.5%
- By 2040
- 1,365,115 · +16.4%
- By 2050
- 1,491,592 · +27.1%
- By 2075
- 1,803,893 · +53.8%
- By 2100
- 2,035,619 · +73.5%
Race, ethnicity, and origin ACS 2023
- Neighborhood character
- Predominantly White (72%)
- Race & ethnicity
- White 72% Hispanic / Latino 12% Two or more races 9% Asian 9% Black 3%
- Hispanic origin (detail)
- Mexican 2% Salvadoran 4%
- Common ancestry
- Slovak 4% Serbian 3% Lithuanian 3%
- Foreign-born
- 15% · Canada, Dominican Republic, China
- Languages at home
- 80% English-only · Spanish 9% Tagalog/Filipino 6% Other Indo-European 2%
Political lean MEDSL · Montgomery
- 2024 margin
- Solid D (+53.3) · D 75.2% · R 21.9% · Other 2.9%
- 2008→2024 swing
- +8.7pp toward D · 2008: 44.6pp · 2024: 53.3pp
- All cycles
- 2024: D+53.3 2020: D+59.6 2016: D+55.5 2012: D+43.4 2008: D+44.6
Not yet ingested
- Civics
- —
Market trends
- HPI YoY
- ▼ -138.58%
- Current HPI
- 266.7175
- Rent YoY
- —
- Metro
- —
- State GDP YoY
- ▲ 2.97%
- F500 in state
- 12
Industry mix (Fortune 500 HQ in MD)
| Industry | F500 HQs | Revenue |
|---|---|---|
| Aerospace / Defense | 1 | $71B |
|
||
| Utilities | 1 | $25B |
|
||
| Hotels | 1 | $24B |
|
||
| Consumer Goods | 1 | $7B |
|
||
| Real Estate | 1 | $6B |
|
||
| Chemicals | 1 | $2B |
|
||
Price history
+490.9% since first listed4 events — show timeline
- 2026-05-13 Pending — BRIGHT MLS
- 2026-04-25 Contingent — BRIGHT MLS
- 2026-04-02 Listed $325,000 BRIGHT MLS
- 1980-05-06 Sold (Public Records) $55,000 Public Records
Property tax history
+2.1%/yrLatest (2025): $3,206 · +11.0% YoY. Source: county tax records.
Cash-flow waterfall
monthlySold comps — $/sqft
last 12 mo · ≤1 miLoading sold comps…