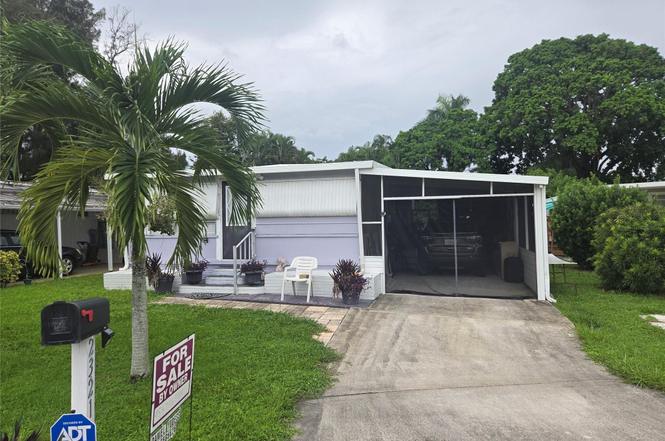
2321 SW 87th Ter · Davie, FL
Flood risk 1/10 · Minimal
- FEMA flood zone
- X (shaded)
- Chance of flooding over 30 yrs
- 0.0%
- Est. flood insurance / yr
- $507 – $1,088
Fire risk 1/10 · Minimal
- Est. fire insurance / yr
- $947 – $1,759
Heat risk 10/10 · Severe
- Hot days now (above 105°F)
- 7 days/yr
- Hot days in 30 yrs
- 26 days/yr
Wind risk 10/10 · Severe
- Chance of severe wind over 30 yrs
- 99.0%
Air-quality risk 3/10 · Minor
- Unhealthy air days now
- 2 days/yr
- Unhealthy air days in 30 yrs
- 3 days/yr
Risk factors via First Street. Map © Google.
Why this score? — see what drove the B- grade
The composite is a weighted blend of 9 inputs, each scored 0–100. Each bar is that input's sub-score; the figure is the points it added to the 100-point composite (weight × sub-score).
- Cash flow +29.3/30.0
- DSCR +10.0/10.0
- 1% rule +8.4/10.0
- ARV discount +4.9/15.0
- Schools +4.1/10.0
- Livability +4.1/5.0
- Rent growth +2.8/5.0
- Condition / age +2.5/5.0
- Appreciation +0.0/10.0
$159,000
🖨 Deal sheet (PDF) 📄 Offer letter ✓ Due diligence
Listing remarks
YOU OWN THE LAND! NO LOT FEES! 2nd master bedroom in front has private entrance & sliding door to main house. Front large bedroom has new bathroom with state-of-the-art intelligent bidet attachment with remote control and adjustable temperature settings for personal comfort. The new rainfall shower has elegant porcelain walls from floor to ceiling, spray hose and niche for storage. Wide pocket door for wheelchair access. New barndoor vanity with LED lights, GFI outlet and USB. Deep lot has shed with electricity & light. Room 4 pool & addt'l bedroom behind main house. The kitchen has a pass-through to dining room but can be opened up to dining room or closed off for a 3rd b
Key facts
- Barndoor vanity
- Deep lot
- New rainfall shower
Tags
Property features AI
Finance
- Other: Living area reported as 860
- Financial info: Located in a senior community; Pets allowed (limits on number and size)
- HOA & community: Has association; Association amenities include clubhouse, pool, shuffleboard court, maintained community, and street lights; HOA fee $125 monthly (includes common areas)
Exterior
- Parking: Attached covered carport (2 spaces); Additional covered spaces: 2; Driveway parking; Guest parking; 1 open parking space
- Security: Smoke detector(s)
- Utilities: Public water; Public sewer; 220 volt electric; Cable available
- Home design: Mobile home (1964 Star double wide); One-story; First-floor entry; Home faces west
- Construction: Aluminum roof; Brick skirt; Resale condition
- Exterior features: Shed(s); Waterfront: Yes (no waterfront features listed)
Interior
- Kitchen: Electric range; Microwave; Refrigerator; Electric water heater
- Bedrooms: 2 bedrooms on the main level
- Flooring: Laminate flooring
- Bathrooms: 2 full bathrooms on the main level
- Heating & cooling: Central heating (electric); Central air conditioning; Ceiling fan(s); Wall/window unit(s)
- Interior features: Built-in features; Closet cabinetry; Blinds on windows; Furnished negotiable
- Laundry & utility: Laundry located outside
Neighborhood map
What this means for you Summary
Snapshot
- This is a 2-bed/2.0-bath manufactured listed at $159k.
Deal economics
- At list price, monthly cash flow is $557 ($7k/yr) — positive.
- The deal already cash-flows at list — no discount required.
- Meets the 1% rule at list price ($2k rent vs $159k).
- Recommended offer: $145k (9.0% below list) — sets the bar for market timing.
- Cap rate 10.5% vs local median 3.4% in Davie — top-decile yield for the area; either an underpriced asset or a hidden risk that comps aren't pricing in. Stress-test before assuming the spread holds.
Location & tenants
- Location reads 82/100 on livability (#68 in FL, #1,159 nationally) — a professional / high-income tenant draw. Strengths: schools A+, crime A+, housing A+; Watch: cost of living D, amenities D-.
- Broward (suburban): math 42% / reading 53% proficiency, ranked #46 of 73 in FL (top 63%) — families likely to look elsewhere, expect single-tenant / working-renter base with shorter leases.
- Market conditions: Rents rising (+1.2%/yr); 398 active listings in the ZIP; 40 comparable units currently listed for rent nearby; rentals at typical pace (median 16d on market — plan ~3-4 weeks tenant-placement turnaround); solid renter incomes; 2,111 units permitted in Broward County in 2024 (1,265 in 5+ unit buildings).
- This rent runs 30% of the median local income ($85k/yr) — at the standard rent-burdened threshold; future hikes will face affordability resistance.
Forward outlook
- Local home prices are declining (-3.0%/yr); year-one equity from $1k of loan paydown is wiped out by about $5k of value loss. Plan a longer hold.
- Broward County population projected at +34% by 2050 — long-run rental-demand tailwind backs the buy-and-hold thesis.
- At projected returns (-3.0% appreciation + 1.2% rent growth), your $45k cash investment doubles in ~10 years — after that, you're playing with house money.
Negotiation context
- It's been on market 99 days — a 9% lower offer ($145k) is reasonable based on typical stale-listing flexibility.
- 3 sale attempts; this cycle's ask is 8268% above the opening price — seller raised mid-cycle; expect resistance to lowballs.
- Current owner paid $128k; 24% above their basis — modest negotiation headroom, anchor on the comps not their cost.
Risks & watch-outs
- Climate carrying-cost: severe wind risk, 99% chance of damaging wind over 30y; extreme-heat days projected 7→26/yr by 2055 (HVAC capex compounding) — expect insurance premiums to compound above CPI over the hold.
Questions for the listing agent
- It's been on market 99 days. Have you received any prior offers? Is the seller open to a 9% concession, seller financing, or rate buy-down credit?
- Built in 1964 — when were the roof, HVAC, electrical panel, plumbing, and water heater last replaced?
- What does the HOA fee cover, when was the last increase, and are there any pending special assessments or reserve-fund shortfalls?
- Why hasn't it sold? Are there any deal-killer items the seller is aware of (foundation, flood, title, zoning, code violations)?
- Is there a deadline driving the sale (1031 exchange, divorce, estate, relocation)? That informs how much negotiation room exists.
- Schools are A-rated — typically a magnet for longer-tenancy family renters. What's the average tenant stay here, and is there a school-zone premium baked into asking?
- What's the average days-on-market for RENTAL listings here right now (not sales)? A rising rental-DOM trend means longer vacancies and softer asking-rent achievability than the comps imply.
- What's the recent tenant-quality profile in this submarket — average credit score on applications, eviction rate, late-payment / NSF rate, and stable-employment percentage? A property-management company in the area should have these aggregated.
- How much new for-sale + rental construction is in the pipeline within 1–3 miles? Heavy new supply typically softens prices + rents 12–24 months out; constrained supply supports both.
Investment metrics
- 1% rule
- 1.34% ✓
- Cap rate
- 10.50%
- Cash-on-cash
- 15.02%
- DSCR
- 1.67
- GRM
- 6.2
CMA / ARV
- ARV (on-the-fly)
- $150,230
- Comps found
- 3
Show comp detail 3 sales within ~0.75 mi
| Address | Dist | Beds/Ba | Sqft | Sold | Price | $/sf | Match |
|---|---|---|---|---|---|---|---|
| 8500 SW 21st St | 0.25mi | 2/1.5 | 799 (-4%) | 3mo | $165,000 | $207 | 78 |
| 8620 SW 22nd St | 0.11mi | 3/2.0 (+1) | 922 (+11%) | 1mo | $130,000 | $141 | 71 |
| 2041 SW 83rd Ave | 0.39mi | 2/2.0 | 885 (+7%) | 3mo | $160,000 | $181 | 68 |
Match score weights: distance 35% · size 25% · config 20% · recency 20%. Top-matched comps best support the ARV.
Projected returns pro-forma
-3.0% appreciation · 1.23% rent growth · sell at horizon
- IRR
- 3.6%
- Equity multiple
- 1.14×
- Total profit
- $6,034
- Equity at exit
- $23,707
- IRR
- 11.3%
- Equity multiple
- 1.82×
- Total profit
- $36,361
- Equity at exit
- $13,747
Cash invested: $44,520 (down + closing). Projections, not guarantees.
Landlord ↔ Tenant lean methodology
- Overall (STATE)
- 87 Strongly Landlord-Friendly
- State Florida
- 87 Strongly Landlord-Friendly · R+3
- County
- — inherits STATE
- City
- — inherits STATE
ZIP-level market 33324
- Home prices YoY
- -33.5%
- Rents YoY
- 1.2%
- Active inventory
- 398
- Price-to-rent
- 6.2×
Monthly cashflow live
- Estimated rent
- $2,134 high interval (Pro) →
- Mortgage (P&I)
- −$834
- Tax from tax record
- −$99 /mo · $1,183/yr
- Insurance
- −$66
- HOA
- −$130
- Vacancy / Maint / Mgmt
- −$448
- Net cashflow
- $557
Break-even live
Sensitivity live
| Price | -10% $647 | -5% $602 | +0% $557 | +5% $512 | +10% $467 |
|---|---|---|---|---|---|
| Rent | -10% $389 | -5% $473 | +0% $557 | +5% $641 | +10% $726 |
| Rate | -1.0pp $637 | -0.5pp $598 | base $557 | +0.5pp $516 | +1.0pp $474 |
UW: 25.0% down · 7.5% · 30yr · 1.5% tax · 5.0% vac · 8.0% maint · 8.0% mgmt
Financing live
Cash to close
- Down payment
- $39,750
- Closing costs
- $4,770
- Reserves months
- —
- Total cash needed
- —
Loan-product check · same deal, 3 products live
Conventional
25% down · 7.5% · 30yr
- Down + closing
- —
- Monthly P&I
- —
- Monthly cashflow
- —
- DSCR
- —
- Eligible?
- —
Personal DTI + credit; lowest rate.
DSCR
20% down · 8.5% · 30yr
- Down + closing
- —
- Monthly P&I
- —
- Monthly cashflow
- —
- DSCR
- —
- Eligible?
- —
No personal income docs; deal must DSCR.
Hard money
10% down · 12.0% · 12mo
- Down + closing
- —
- Monthly P&I
- —
- Monthly cashflow
- —
- DSCR
- —
- Eligible?
- —
Short-term bridge; refi at stabilization.
Rent comps 40 comps
| Address | Beds | Baths | Sqft | Rent | $/sqft | DOM | Units | Dist |
|---|---|---|---|---|---|---|---|---|
| 9230 Lagoon Pl #411 Davie, FL | 2.0 | 2.0 | 970 | $1,950 | $2.01 | 8d | 1 | 0.50mi |
| 9230 Lagoon Pl #411 Davie, FL | 2.0 | 2.0 | 970 | $1,950 | $2.01 | 24d | 1 | 0.50mi |
| 2461 SW 82nd Ave #103 Davie, FL | 2.0 | 2.0 | 871 | $1,900 | $2.18 | 24d | 1 | 0.50mi |
| 8141 SW 24th Ct #106 Davie, FL | 2.0 | 2.0 | 949 | $1,900 | $2.00 | 14d | 1 | 0.52mi |
| 8141 SW 24th Ct #106 Davie, FL | 2.0 | 2.0 | 949 | $1,900 | $2.00 | 15d | 1 | 0.52mi |
| 2471 SW 82nd Ave Davie, FL | 2.0 | 2.0 | 879 | $1,850 | $2.10 | 21d | 1 | 0.54mi |
| 2075 SW 82nd Ave #2075 Davie, FL | 2.0 | 2.0 | 907 | $3,200 | $3.53 | 4d | 1 | 0.54mi |
| 9340 Lagoon Pl Davie, FL | 1.0–2.0 | 1.5–2.0 | 955 | $2,200 | $2.30 | 8d | 2 | 0.55mi |
| 9235 Lagoon Pl #402 Davie, FL | 2.0 | 2.0 | 1100 | $2,050 | $1.86 | 17d | 1 | 0.55mi |
| 9235 Lagoon Pl #402 Davie, FL | 2.0 | 2.0 | 1100 | $2,050 | $1.86 | 5d | 1 | 0.55mi |
| 8101 SW 24th Ct Davie, FL | 1.0–2.0 | 1.5–2.0 | 881 | $2,300 | $2.61 | 15d | 4 | 0.56mi |
| 8101 SW 24th Ct Davie, FL | 2.0 | 2.0 | 985 | $2,250 | $2.28 | 19d | 3 | 0.56mi |
| 2495 SW 82nd Ave #304 Davie, FL | 1.0 | 1.5 | 727 | $1,600 | $2.20 | 8d | 1 | 0.59mi |
| 9420 Poinciana Pl #409 Davie, FL | 2.0 | 2.0 | 970 | $1,890 | $1.95 | 2d | 1 | 0.61mi |
| 2430 SW 81st Ave #305 Davie, FL | 1.0 | 1.5 | 741 | $1,700 | $2.29 | 24d | 1 | 0.62mi |
| 2430 SW 81st Ave #408 Davie, FL | 2.0 | 2.0 | 1021 | $2,100 | $2.06 | 3d | 1 | 0.62mi |
| 1680 SW 84th Ave Davie, FL | 2.0 | 2.0 | 798 | $2,100 | $2.63 | 4d | 1 | 0.62mi |
| 8508 SW 16th Ct Davie, FL | 3.0 | 2.0 | 613 | $1,700 | $2.77 | 14d | 1 | 0.63mi |
| 1920 Sabal Palm Dr #104 Davie, FL | 2.0 | 2.0 | 976 | $2,149 | $2.20 | 19d | 1 | 0.63mi |
| 9480 Poinciana Pl #407 Davie, FL | 2.0 | 2.0 | 1100 | $2,100 | $1.91 | 3d | 1 | 0.64mi |
| 9480 Poinciana Pl #407 Davie, FL | 2.0 | 2.0 | 1100 | $2,100 | $1.91 | 24d | 1 | 0.64mi |
| 8717 SW 16th Pl Davie, FL | 1.0 | 1.0 | 600 | $1,500 | $2.50 | 22d | 1 | 0.64mi |
| 8717 SW 16th Pl Davie, FL | 1.0 | 1.0 | 600 | $1,300 | $2.17 | 3d | 1 | 0.64mi |
| 9410 Poinciana Pl #206 Davie, FL | 2.0 | 2.0 | 1100 | $2,100 | $1.91 | 24d | 1 | 0.65mi |
| 2500 SW 81st Ave #401 Davie, FL | 2.0 | 2.0 | 1021 | $1,795 | $1.76 | 24d | 1 | 0.65mi |
| 8709 SW 15th St Unit na Davie, FL | 2.0 | 2.0 | 998 | $2,050 | $2.05 | 15d | 1 | 0.71mi |
| 3001 W Rolling Hills Cir Davie, FL | 1.0–2.0 | 1.5–2.0 | 1040 | $2,250 | $2.16 | 11d | 2 | 0.71mi |
| 3001 W Rolling Hills Cir Davie, FL | 1.0–2.0 | 1.5–2.0 | 1020 | $2,200 | $2.16 | 17d | 2 | 0.71mi |
| 9531 Seagrape Dr Davie, FL | 2.0–3.0 | 2.0 | 1065 | $2,200 | $2.06 | 3d | 3 | 0.71mi |
| 9531 Seagrape Dr Davie, FL | 3.0 | 2.0 | 1139 | $2,650 | $2.33 | 18d | 2 | 0.71mi |
| 1831 Sabal Palm Dr Davie, FL | 2.0–3.0 | 2.0 | 1139 | $2,150 | $1.89 | 19d | 2 | 0.73mi |
| 1811 Sabal Palm Dr Davie, FL | 2.0–3.0 | 2.0 | 1073 | $2,200 | $2.05 | 5d | 1 | 0.74mi |
| 9470 Poinciana Pl #303 Davie, FL | 2.0 | 2.0 | 970 | $2,050 | $2.11 | 24d | 1 | 0.74mi |
| 9440 Poinciana Pl Davie, FL | 1.0–2.0 | 1.0–2.0 | 985 | $2,220 | $2.25 | 24d | 2 | 0.77mi |
| 9440 Poinciana Pl #404 Davie, FL | 2.0 | 2.0 | 1100 | $2,220 | $2.02 | 15d | 1 | 0.77mi |
| 2571 SW 79th Ave Davie, FL | 1.0 | 1.0 | 609 | $1,771 | $2.91 | 2d | 4 | 0.79mi |
| 9470 Live Oak Pl #306 Davie, FL | 2.0 | 2.0 | 980 | $1,950 | $1.99 | 24d | 1 | 0.79mi |
| 9441 Live Oak Pl #307 Davie, FL | 1.0 | 1.0 | 654 | $1,700 | $2.60 | 24d | 1 | 0.79mi |
| 3100 W Rolling Hills Cir Davie, FL | 1.0–2.0 | 1.5–2.0 | 1040 | $2,300 | $2.21 | 22d | 3 | 0.83mi |
| 3100 W Rolling Hills Cir Davie, FL | 2.0 | 2.0 | 1125 | $2,250 | $2.00 | 3d | 2 | 0.83mi |
HOA detail
- Monthly dues
- $130 · $1,560/yr
- Likely covers
- electricpool
Listing history 24 events
-
2026-06-18days on market $159,000 Active 99 DOM
-
2026-06-17days on market $159,000 Active 98 DOM
-
2026-06-16days on market $159,000 Active 97 DOM
-
2026-06-15days on market $159,000 Active 96 DOM
-
2026-06-13days on market $159,000 Active 94 DOM
-
2026-06-09days on market $159,000 Active 90 DOM
-
2026-06-07days on market $159,000 Active 88 DOM
-
2026-06-04pricedays on market $159,000 Active 85 DOM
-
2026-06-03pricedays on market $155,000 Active 84 DOM
-
2026-06-02days on market $159,000 Active 83 DOM
-
2026-06-01days on market $159,000 Active 82 DOM
-
2026-05-31days on market $159,000 Active 81 DOM
-
2026-04-17$1,900
-
2026-04-17historical $1,850
-
2026-03-09price $1,850
-
2026-03-08price $1,900
-
2026-01-21$2,000
-
2025-11-24$159,000 Active
-
2025-03-17soldstatus $128,000
-
2025-02-25soldstatus $95,000
-
2019-05-08soldstatus $78,500
-
2002-04-22soldstatus $23,000
-
1987-09-03soldstatus $33,000
-
1982-04-01soldstatus $29,000
ⓘ Source: listings_history table (triggers on properties + properties_extension) + one-shot
backfill from property_details.listing_events for pre-trigger history.
Tax reassessment forecast FL · Resets to sale price
- Current annual tax
- $1,183 · $99/mo
- Projected year-2 tax
- $1,320 · $110/mo
- Expected delta
- +$137/yr (+$11/mo · 11.6%)
ⓘ Screening estimate from a state-policy table — verify with the county assessor before closing.
Climate risk First Street
- Flood 1/10 Low FEMA zone X (shaded) · 0% chance over 30 yrs
- Wildfire 1/10 Low
- Heat 10/10 Extreme 7 d/yr ≥105°F today · 26 d/yr by 30 yrs out
- Wind 10/10 Extreme 99% chance of damaging wind over 30 yrs
- Air quality 3/10 Moderate 2 unhealthy d/yr today · 3 by 30 yrs out
Nearby sold comps map
Loading sold comps map…
Walkable amenities ~0.75 mi
Loading nearby amenities…
Taxation est. · year 1
- Rental income
- $25,606
- − Mortgage interest
- −$8,906
- − Property taxes
- −$1,183
- − Insurance
- −$795
- − Repairs & maintenance
- −$2,049
- − Management
- −$2,049
- − HOA
- −$1,560
- − Depreciation
- −$4,625
- Taxable income
- $4,440
- Est. tax owed @ 24.0%
- −$1,065
- After-tax cash flow
- $5,620/yr
For passive investors: Depreciation is non-cash, so a rental often shows a tax loss while cash-flowing — sheltering income. Rental losses are passive: they offset passive income freely, and up to $25,000/yr can offset ordinary (W-2) income if you actively participate and your MAGI is under $100k (phasing out to $0 by $150k); unused losses carry forward. On sale, claimed depreciation is recaptured at up to 25%, and gains may owe capital-gains tax (a 1031 exchange can defer both). Figures are a year-1 estimate at your 24.0% rate — not tax advice; consult a CPA.
Schools (NCES district)
- District
- Broward
- NCES district ID
- 1200180
- Math proficiency
- 42% ▼ -18.00%
- Reading proficiency
- 53% ▼ -5.00%
- Median HH income
- $52,139
- Composite
- 40.88/100
- National rank
- #3621
- State rank
- #46 of 73 in FL
Livability — Davie
- Score
- 82/100
- State rank
- #68
- US rank
- #1159
Category grades
Schools grade is shown separately in the Schools card above.
Census & demographics
- Census place
- Davie, FL
- County
- Broward County · 1,963,430 people
- City population
- 92,317
- Metro
- Miami-Fort Lauderdale-Pompano Beach, FL
- Population (ZIP)
- 50,151
- Household income
- $85,000
- Rent vs Own
- Severe rent burden
- 2923.0
Population outlook (Broward County) Hauer SSP2
- Today (2025)
- 2,207,033 people
- By 2030
- 2,360,704 · +7.0%
- By 2040
- 2,661,208 · +20.6%
- By 2050
- 2,946,698 · +33.5%
- By 2075
- 3,602,273 · +63.2%
- By 2100
- 3,970,984 · +79.9%
Race, ethnicity, and origin ACS 2023
- Neighborhood character
- Diverse neighborhood (Simpson 0.69)
- Race & ethnicity
- White 42% Hispanic / Latino 31% Two or more races 20% Black 16% Asian 6%
- Hispanic origin (detail)
- Mexican 2% Puerto Rican 5% Cuban 4% Dominican 2%
- Common ancestry
- Romanian 3% Italian 3% Hispanic 3%
- Foreign-born
- 31% · Canada, Jamaica, China
- Languages at home
- 60% English-only · Spanish 26% Other Indo-European 4% French/Haitian/Cajun 3%
Political lean MEDSL · Broward
- 2024 margin
- D (+17.0) · D 58.0% · R 41.0%
- 2008→2024 swing
- -17.8pp toward R · 2008: 34.7pp · 2024: 17.0pp
- All cycles
- 2024: D+17.0 2020: D+29.8 2016: D+35.0 2012: D+34.9 2008: D+34.7
Not yet ingested
- Civics
- —
Market trends
- HPI YoY
- ▼ -160.16%
- Current HPI
- 317.8685
- Rent YoY
- ▲ 1.23%
- Metro
- Miami-Fort Lauderdale-Pompano Beach, FL
- State GDP YoY
- ▲ 3.28%
- F500 in state
- 36
Industry mix (Fortune 500 HQ in FL)
| Industry | F500 HQs | Revenue |
|---|---|---|
| Industrial Technology | 2 | $29B |
|
||
| Insurance | 2 | $17B |
|
||
| Retail | 1 | $60B |
|
||
| Technology Distribution | 1 | $58B |
|
||
| Homebuilding | 1 | $35B |
|
||
| Technology Manufacturing | 1 | $35B |
|
||
Price history
-93.4% since first listed12 events — show timeline
- 2026-04-17 Listed for Rent $1,900 RMLSFL
- 2026-04-17 Rental Removed $1,850 GFLMLS
- 2026-03-09 Price Changed $1,850 GFLMLS
- 2026-03-08 Price Changed $1,900 GFLMLS
- 2026-01-21 Listed for Rent $2,000 GFLMLS
- 2025-11-24 Listed $159,000 Beaches MLS
- 2025-03-17 Sold (Public Records) $128,000 Public Records
- 2025-02-25 Sold (Public Records) $95,000 Public Records
- 2019-05-08 Sold (Public Records) $78,500 Public Records
- 2002-04-22 Sold (Public Records) $23,000 Public Records
- 1987-09-03 Sold (Public Records) $33,000 Public Records
- 1982-04-01 Sold (Public Records) $29,000 Public Records
Property tax history
+17.1%/yrLatest (2025): $1,183 · +3.1% YoY. Source: county tax records.
Cash-flow waterfall
monthlySold comps — $/sqft
last 12 mo · ≤1 miLoading sold comps…