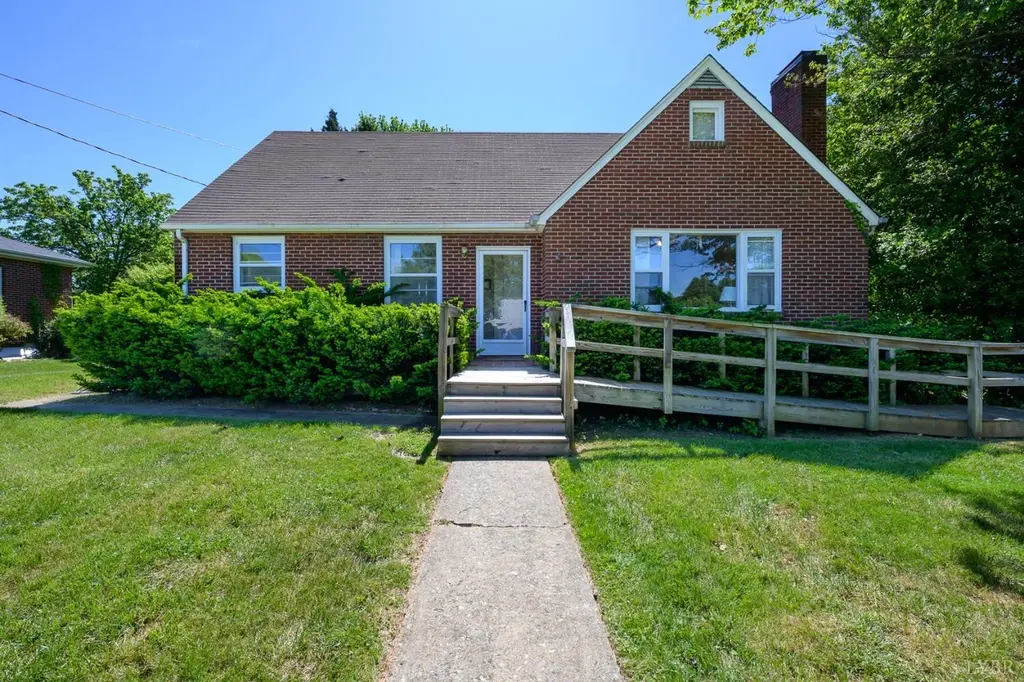
129 Forbes St · Madison Heights, VA
Flood risk No data
- FEMA flood zone
- —
- Chance of flooding over 30 yrs
- —
- Est. flood insurance / yr
- —
Fire risk No data
- Est. fire insurance / yr
- —
Heat risk No data
- Hot days now (above threshold)
- —
- Hot days in 30 yrs
- —
Wind risk No data
- Chance of severe wind over 30 yrs
- —
Air-quality risk No data
- Unhealthy air days now
- —
- Unhealthy air days in 30 yrs
- —
Risk factors via First Street. Map © Google.
Why this score? — see what drove the F grade
The composite is a weighted blend of 9 inputs, each scored 0–100. Each bar is that input's sub-score; the figure is the points it added to the 100-point composite (weight × sub-score).
- ARV discount +11.9/15.0
- Cash flow +7.0/30.0
- Schools +4.4/10.0
- Livability +3.7/5.0
- Rent growth +2.5/5.0
- Condition / age +2.5/5.0
- DSCR +1.2/10.0
- 1% rule +0.7/10.0
- Appreciation +0.0/10.0
$199,900
🖨 Deal sheet 📄 Offer letter ✓ Due diligence
Listing remarks MLS
Beautiful cape cod on great level fenced in lot at end of cul-de-sac. Long gravel driveway ideal for lots of parking. Three bedrooms and one full bath with upstairs walk up attic that can be finished for additional square footage in future. Septic pumped October 2021
Key facts
- Cape cod style home
- Arched doorways
- Dining area
Tags
Property features AI
Exterior
- Utilities: Septic tank
- Home design: Single family residence; One-story
- Construction: Brick construction; Shingle roof
- Exterior features: Garden; Patio; Storm door(s); Workshop (outbuilding)
Interior
- Kitchen: Electric range; Refrigerator
- Flooring: Hardwood; Vinyl; Wood
- Bathrooms: 1 full bathroom
- Heating & cooling: Forced air heating; Central air conditioning
- Interior features: Fireplace in the living room; Full basement
- Laundry & utility: Laundry in basement; Electric water heater
Neighborhood map
What this means for you Summary
Snapshot
- This is a 2-bed/1.0-bath single-family listed at $200k.
Deal economics
- At list price, monthly cash flow is $-294 ($-4k/yr) — negative.
- To cash-flow at today's rent, offer at most $148k (26.0% below list).
- To meet the 1% rule (rent ≥ 1% of price), the offer needs to be $113k (43.5% below list).
- Recommended offer: $113k (43.5% below list) — sets the bar for 1% rule.
- Cap rate 4.5% vs local median 3.4% in Madison Heights — top-decile yield for the area; either an underpriced asset or a hidden risk that comps aren't pricing in. Stress-test before assuming the spread holds.
Location & tenants
- Location reads 73/100 on livability (#166 in VA) — a middle-class / working-renter tenant base. Strengths: cost of living A+, housing A+, commute B; Watch: health & safety C-, employment D, amenities F.
- Amherst County Public School District (rural): math 40% / reading 64% proficiency, ranked #94 of 131 in VA (top 72%) — acceptable for families but not a draw, mixed tenant base, ~2y average lease.
- Zoned schools: Madison Heights Elementary (math 32% / reading 47%, grade F, #900 of 1,108 statewide, top 83%, 418 students, 77% FRL); Monelison Middle (math 25% / reading 59%, grade D-, #295 of 342 statewide, top 87%, 513 students, 77% FRL); Amherst County High (math 57% / reading 81%, grade B, #170 of 319 statewide, top 55%, 1,260 students, 75% FRL) — zoned schools average 76% FRL vs 42% district-wide (34 pts higher); higher-poverty schools than district average — tighter screening recommended.
- Market conditions: 114 active listings in the ZIP; 8 comparable units currently listed for rent nearby; rentals lingering (median 44d on market — plan ~5-8 weeks vacancy on turnover, expect pricing pressure); 50% of comp listings sitting > 30 days — soft ceiling on asking rent; 228 units permitted in Amherst County in 2024 (108 in 5+ unit buildings).
Forward outlook
- Local home prices are declining (-3.0%/yr); year-one equity from $1k of loan paydown is wiped out by about $6k of value loss. Plan a longer hold.
- Amherst County population projected at -28% by 2050 — secular population decline; favor cash flow + early exit over multi-decade hold.
Negotiation context
- It's been on market 38 days — a 3% lower offer ($194k) is reasonable based on typical stale-listing flexibility.
- 3 sale attempts since 9y ago with the ask held roughly flat each time — persistent listings suggest the price (not the market) is what's stuck; bring a comps-based counter.
- Current owner paid $160k; 25% above their basis — modest negotiation headroom, anchor on the comps not their cost.
Risks & watch-outs
- Watch-outs: built in 1951 — expect roof / HVAC / electrical / plumbing capex.
Questions for the listing agent
- What do current leases actually rent for vs. the listed asking? Can we see a recent rent roll and the last 12 months of T-12 income?
- It's been on market 38 days. Have you received any prior offers? Is the seller open to a 43% concession, seller financing, or rate buy-down credit?
- Built in 1951 — when were the roof, HVAC, electrical panel, plumbing, and water heater last replaced?
- Is there a deadline driving the sale (1031 exchange, divorce, estate, relocation)? That informs how much negotiation room exists.
- Schools are B-rated — typically a magnet for longer-tenancy family renters. What's the average tenant stay here, and is there a school-zone premium baked into asking?
- The area grade is low — what's the realistic commute time and amenity access for the typical tenant pool here? Any planned neighborhood developments (good or bad) we should know about?
- What's the average days-on-market for RENTAL listings here right now (not sales)? A rising rental-DOM trend means longer vacancies and softer asking-rent achievability than the comps imply.
- What's the recent tenant-quality profile in this submarket — average credit score on applications, eviction rate, late-payment / NSF rate, and stable-employment percentage? A property-management company in the area should have these aggregated.
- How much new for-sale + rental construction is in the pipeline within 1–3 miles? Heavy new supply typically softens prices + rents 12–24 months out; constrained supply supports both.
Investment metrics
- 1% rule
- 0.57% ✗
- Cap rate
- 4.53%
- Cash-on-cash
- -6.30%
- DSCR
- 0.72
- GRM
- 14.7
CMA / ARV
- ARV (median comp)
- $221,573
- List price
- $199,900
- Delta
- -9.78%
- Verdict
- FAIR
- Comps
- 20 within 1.0 mi
Show comp detail 12 sales within ~0.75 mi
| Address | Dist | Beds/Ba | Sqft | Sold | Price | $/sf | Match |
|---|---|---|---|---|---|---|---|
| 194 Triple Oak Cir | 0.43mi | 3/2.0 (+1) | 1,155 (+1%) | 2mo | $296,500 | $257 | 68 |
| 117 Wells Rd Rd | 0.31mi | 2/1.0 | 1,219 (+7%) | 10mo | $187,400 | $154 | 66 |
| 233 Mays St | 0.30mi | 2/1.0 | 1,263 (+10%) | 13mo | $220,000 | $174 | 58 |
| 171 Woodvue Dr | 0.47mi | 2/2.0 | 1,046 (-9%) | 6mo | $225,000 | $215 | 54 |
| 299 Seminole Dr | 0.56mi | 2/1.0 | 1,100 (-4%) | 17mo | $227,000 | $206 | 53 |
| 117 Woodys Ln | 0.60mi | 2/2.0 | 1,164 (+2%) | 15mo | $192,450 | $165 | 53 |
| 333 Lakeview Drive Dr | 0.65mi | 2/2.0 | 1,064 (-7%) | 3mo | $40,000 | $38 | 52 |
| 136 Long Pine Dr | 0.59mi | 2/1.0 | 1,196 (+4%) | 23mo | $235,000 | $196 | 46 |
| 157 Phelps Rd | 0.54mi | 3/2.0 (+1) | 1,248 (+9%) | 10mo | $200,000 | $160 | 42 |
| 5169 S Amherst Hwy | 0.59mi | 3/1.0 (+1) | 1,218 (+6%) | 20mo | $20,000 | $16 | 40 |
| 305 Lakeview Dr | 0.63mi | 3/2.0 (+1) | 1,232 (+8%) | 14mo | $255,000 | $207 | 38 |
| 138 Woodys Ln | 0.65mi | 3/1.0 (+1) | 981 (-14%) | 6mo | $189,500 | $193 | 36 |
Match score weights: distance 35% · size 25% · config 20% · recency 20%. Top-matched comps best support the ARV.
Projected returns pro-forma
-3.0% appreciation · 3.0% rent growth · sell at horizon
- IRR
- -27.2%
- Equity multiple
- 0.08×
- Total profit
- $-51,219
- Equity at exit
- $29,806
- IRR
- -25.5%
- Equity multiple
- -0.24×
- Total profit
- $-69,128
- Equity at exit
- $17,284
Cash invested: $55,972 (down + closing). Projections, not guarantees.
Landlord ↔ Tenant lean methodology
- Overall (STATE)
- 55 Moderately Landlord-Leaning
- State Virginia
- 55 Moderately Landlord-Leaning · D+2
- County
- — inherits STATE
- City
- — inherits STATE
ZIP-level market 24572
- Home prices YoY
- -22.0%
- Active inventory
- 114
- Price-to-rent
- 14.7×
Monthly cashflow live
- Estimated rent
- $1,130 high interval (Pro) →
- Mortgage (P&I)
- −$1,048
- Tax from tax record
- −$55 /mo · $665/yr
- Insurance
- −$83
- HOA
- −$0
- Vacancy / Maint / Mgmt
- −$237
- Net cashflow
- $-294
Break-even live
UW: 25.0% down · 7.5% · 30yr · 1.5% tax · 5.0% vac · 8.0% maint · 8.0% mgmt
Financing live
Cash to close
- Down payment
- $49,975
- Closing costs
- $5,997
- Reserves months
- —
- Total cash needed
- —
Loan-product check · same deal, 3 products live
Conventional
25% down · 7.5% · 30yr
- Down + closing
- —
- Monthly P&I
- —
- Monthly cashflow
- —
- DSCR
- —
- Eligible?
- —
Personal DTI + credit; lowest rate.
DSCR
20% down · 8.5% · 30yr
- Down + closing
- —
- Monthly P&I
- —
- Monthly cashflow
- —
- DSCR
- —
- Eligible?
- —
No personal income docs; deal must DSCR.
Hard money
10% down · 12.0% · 12mo
- Down + closing
- —
- Monthly P&I
- —
- Monthly cashflow
- —
- DSCR
- —
- Eligible?
- —
Short-term bridge; refi at stabilization.
Rent comps 8 comps
| Address | Beds | Baths | Sqft | Rent | $/sqft | DOM | Units | Dist |
|---|---|---|---|---|---|---|---|---|
| 156 Cedar Crest Dr Apt 302 Madison Heights, VA | 2.0 | 1.5 | 980 | $995 | $1.02 | 13d | 1 | 0.18mi |
| 4995 S Amherst Hwy Apt 224 Madison Heights, VA | 2.0 | 1.0 | 982 | $795 | $0.81 | 43d | 1 | 0.20mi |
| 115 Town Center Pkwy Apt 1206 Madison Heights, VA | 2.0 | 2.0 | 1234 | $1,500 | $1.22 | 13d | 1 | 0.66mi |
| 115 Town Center Pkwy Unit 1001 Madison Heights, VA | 3.0 | 2.0 | 1356 | $1,650 | $1.22 | 43d | 1 | 0.66mi |
| 131 Town Center Pkwy Unit 2104 Madison Heights, VA | 2.0 | 2.0 | 1332 | $1,600 | $1.20 | 20d | 1 | 0.70mi |
| 197 Hilltop Dr Madison Heights, VA | 3.0 | 1.0 | 1279 | $1,500 | $1.17 | 43d | 1 | 0.80mi |
| 155 Pomona Dr Unit 155 Madison Heights, VA | 2.0 | 1.0 | 700 | $785 | $1.12 | 13d | 1 | 0.96mi |
| 127 Country Village Ln Unit 127-104 Madison Heights, VA | 2.0 | 1.5 | 930 | $900 | $0.97 | 43d | 1 | 1.21mi |
Listing history 10 events
-
2026-06-01statusdays on market $199,900 Pending 38 DOM
-
2026-05-31days on market $199,900 Active 37 DOM
-
2026-05-30days on market $199,900 Active 36 DOM
-
2026-04-24$199,900 Active 825-char remark
-
2022-08-17soldstatus $160,000 Closed 267-char remark
Show marketing remark (267 chars)
Beautiful cape cod on great level fenced in lot at end of cul-de-sac. Long gravel driveway ideal for lots of parking. Three bedrooms and one full bath with upstairs walk up attic that can be finished for additional square footage in future. Septic pumped October 2021
-
2022-07-09status Pending 267-char remark
Show marketing remark (267 chars)
Beautiful cape cod on great level fenced in lot at end of cul-de-sac. Long gravel driveway ideal for lots of parking. Three bedrooms and one full bath with upstairs walk up attic that can be finished for additional square footage in future. Septic pumped October 2021
-
2022-07-06$149,990 Active 267-char remark
Show marketing remark (267 chars)
Beautiful cape cod on great level fenced in lot at end of cul-de-sac. Long gravel driveway ideal for lots of parking. Three bedrooms and one full bath with upstairs walk up attic that can be finished for additional square footage in future. Septic pumped October 2021
-
2017-11-28soldstatus $127,400
Show marketing remark (346 chars)
Home warranty just added! Handicapped accessible! Well cared for home with beautiful hardwood floors, arched doorways, updated kitchen and bath, formal dining room, living room with fireplace, patio just off kitchen, 2nd level potential for 2nd bath-has 4th bedroom with closet, rear fenced yard, off street parking, carport, workshop in basement
-
2017-11-28soldstatus $127,500
Show marketing remark (346 chars)
Home warranty just added! Handicapped accessible! Well cared for home with beautiful hardwood floors, arched doorways, updated kitchen and bath, formal dining room, living room with fireplace, patio just off kitchen, 2nd level potential for 2nd bath-has 4th bedroom with closet, rear fenced yard, off street parking, carport, workshop in basement
-
2017-05-10$124,900
Show marketing remark (346 chars)
Home warranty just added! Handicapped accessible! Well cared for home with beautiful hardwood floors, arched doorways, updated kitchen and bath, formal dining room, living room with fireplace, patio just off kitchen, 2nd level potential for 2nd bath-has 4th bedroom with closet, rear fenced yard, off street parking, carport, workshop in basement
ⓘ Source: listings_history table (triggers on properties + properties_extension) + one-shot
backfill from property_details.listing_events for pre-trigger history.
Tax reassessment forecast VA · Resets to sale price
- Current annual tax
- $665 · $55/mo
- Projected year-2 tax
- $1,639 · $137/mo
- Expected delta
- +$974/yr (+$81/mo · 146.5%)
ⓘ Screening estimate from a state-policy table — verify with the county assessor before closing.
Nearby sold comps map
Loading sold comps map…
Walkable amenities ~0.75 mi
Loading nearby amenities…
Taxation est. · year 1
- Rental income
- $13,565
- − Mortgage interest
- −$11,198
- − Property taxes
- −$665
- − Insurance
- −$1,000
- − Repairs & maintenance
- −$1,085
- − Management
- −$1,085
- − Depreciation
- −$5,815
- Taxable loss
- −$7,283
- Est. tax savings @ 24.0%
- +$1,748
- After-tax cash flow
- $-1,780/yr
For passive investors: Depreciation is non-cash, so a rental often shows a tax loss while cash-flowing — sheltering income. Rental losses are passive: they offset passive income freely, and up to $25,000/yr can offset ordinary (W-2) income if you actively participate and your MAGI is under $100k (phasing out to $0 by $150k); unused losses carry forward. On sale, claimed depreciation is recaptured at up to 25%, and gains may owe capital-gains tax (a 1031 exchange can defer both). Figures are a year-1 estimate at your 24.0% rate — not tax advice; consult a CPA.
Schools (NCES district)
- District
- Amherst County Public School District
- NCES district ID
- 5100210
- Math proficiency
- 40% ▼ -42.00%
- Reading proficiency
- 64% ▼ -14.00%
- Median HH income
- $45,945
- Composite
- 43.96/100
- National rank
- #2900
- State rank
- #94 of 131 in VA
Livability — Madison Heights
- Score
- 73/100
- State rank
- #166
- US rank
- #5166
Category grades
Schools grade is shown separately in the Schools card above.
Census & demographics
- Census place
- Madison Heights, VA
- County
- Amherst County · 15,744 people
- City population
- 15,744
- Metro
- Lynchburg, VA
- Population (ZIP)
- 15,744
- Household income
- $62,030
- Rent vs Own
- Severe rent burden
- 357.0
Population outlook (Amherst County) Hauer SSP2
- Today (2025)
- 29,790 people
- By 2030
- 28,332 · -4.9%
- By 2040
- 24,963 · -16.2%
- By 2050
- 21,468 · -27.9%
- By 2075
- 14,111 · -52.6%
- By 2100
- 9,344 · -68.6%
Race, ethnicity, and origin ACS 2023
- Neighborhood character
- Predominantly White (70%)
- Race & ethnicity
- White 70% Black 21% Two or more races 6% Hispanic / Latino 3% Asian 1%
- Common ancestry
- Slovak 2% Italian 1% Serbian 1%
- Foreign-born
- 1% · Canada, Jamaica
- Languages at home
- 97% English-only · Spanish 2%
Political lean MEDSL · Amherst
- 2024 margin
- Solid R (+36.5) · D 31.4% · R 67.9%
- 2008→2024 swing
- -20.3pp toward R · 2008: -16.2pp · 2024: -36.5pp
- All cycles
- 2024: R+36.5 2020: R+31.6 2016: R+30.7 2012: R+19.9 2008: R+16.2
Not yet ingested
- Civics
- —
Market trends
- HPI YoY
- ▼ -50.26%
- Current HPI
- 178.2917
- Rent YoY
- —
- Metro
- Lynchburg, VA
- State GDP YoY
- ▲ 2.40%
- F500 in state
- 50
Industry mix (Fortune 500 HQ in VA)
| Industry | F500 HQs | Revenue |
|---|---|---|
| Aerospace / Defense | 4 | $236B |
|
||
| Technology / Defense | 3 | $32B |
|
||
| Financial Services | 2 | $176B |
|
||
| Utilities | 2 | $27B |
|
||
| Insurance | 2 | $25B |
|
||
| Technology | 2 | $15B |
|
||
Price history
+60.0% since first listed8 events — show timeline
- 2026-06-01 Pending — LMLS
- 2026-04-24 Listed $199,900 LMLS
- 2022-08-17 Sold (MLS) $160,000 LMLS
- 2022-07-09 Pending — LMLS
- 2022-07-06 Listed $149,990 LMLS
- 2017-11-28 Sold (Public Records) $127,500 Public Records
- 2017-11-28 Sold (MLS) $127,400 LMLS
- 2017-05-10 Listed $124,900 LMLS
Property tax history
+1.3%/yrLatest (2025): $665 · +0.0% YoY. Source: county tax records.
Cash-flow waterfall
monthlySold comps — $/sqft
last 12 mo · ≤1 miLoading sold comps…