498 County Road 445 · Tula, MS
Flood risk 3/10 · Minor
- FEMA flood zone
- X (unshaded)
- Chance of flooding over 30 yrs
- 0.2%
- Est. flood insurance / yr
- $507 – $1,088
Fire risk 4/10 · Minor
- Est. fire insurance / yr
- $1,241 – $2,305
Heat risk 6/10 · Moderate
- Hot days now (above 108°F)
- 7 days/yr
- Hot days in 30 yrs
- 22 days/yr
Wind risk 6/10 · Moderate
- Chance of severe wind over 30 yrs
- 27.0%
Air-quality risk 1/10 · Minimal
- Unhealthy air days now
- 0 days/yr
- Unhealthy air days in 30 yrs
- 0 days/yr
Risk factors via First Street. Map © Google.
Why this score? — see what drove the C- grade
The composite is a weighted blend of 9 inputs, each scored 0–100. Each bar is that input's sub-score; the figure is the points it added to the 100-point composite (weight × sub-score).
- Cash flow +21.5/30.0
- ARV discount +7.5/15.0
- DSCR +6.9/10.0
- 1% rule +4.5/10.0
- Rent growth +3.7/5.0
- Schools +3.7/10.0
- Livability +2.5/5.0
- Condition / age +2.5/5.0
- Appreciation +0.0/10.0
$218,000
🖨 Deal sheet (PDF) 📄 Offer letter ✓ Due diligence
Listing remarks MLS
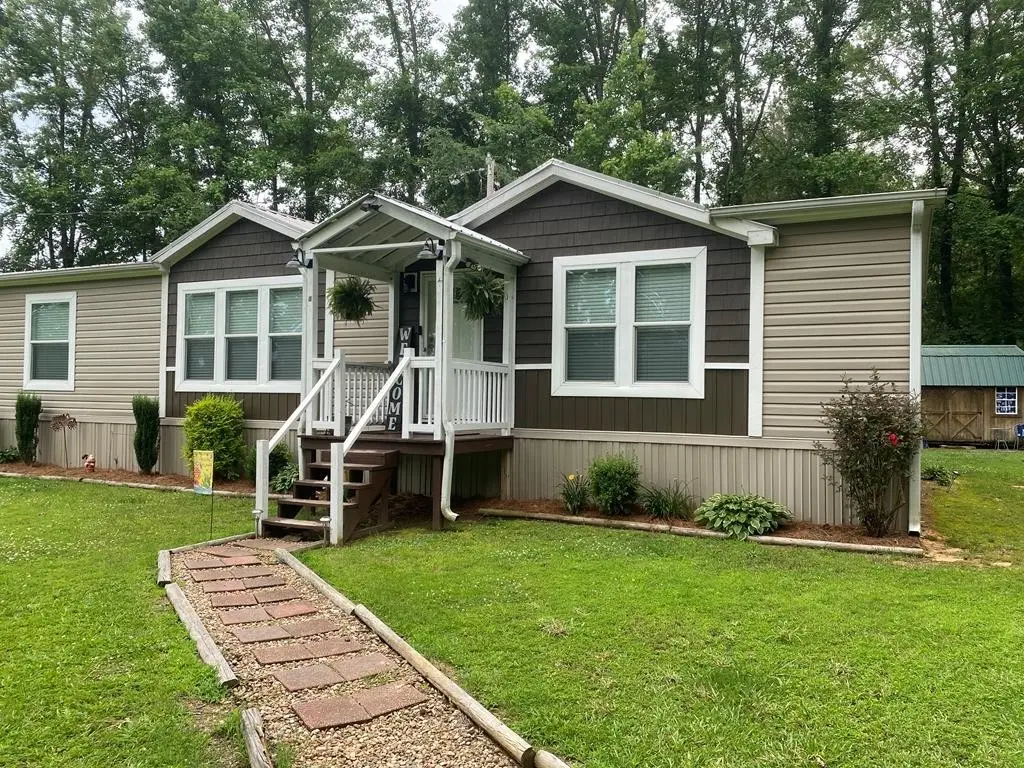
This property sits on almost a full acre with trees outlining the property line. There is also a creek that runs on to the property. The home has an open floorplan with an island in kitchen and built-ins in living room. The master bathroom is massive with both stand up shower and tub separate. Also on the property is a shed with lean to attached.
Key facts
- Creek on property
- Open floorplan
- Full acre
Tags
Property features AI
Finance
- Other: Lot size approximately 0.92 acres
- Financial info: Financial details not provided
- HOA & community: HOA information not provided
Exterior
- Parking: Gravel parking
- Security: Security details not provided
- Utilities: Septic tank
- Home design: Residential property; No zoning
- Construction: Vinyl siding; Composition roof
- Exterior features: Deck; Porch; Satellite dish; Workshop
Interior
- Kitchen: Microwave; Dishwasher; Electric range; Refrigerator
- Bedrooms: Bedrooms information not provided
- Flooring: Ceramic tile; Hardwood
- Bathrooms: 2 full bathrooms
- Heating & cooling: Central air
- Interior features: Pantry; Walk-in closets; Ceiling fans
- Laundry & utility: Washer; Dryer; Electric water heater
Neighborhood map
What this means for you Summary
Snapshot
- This is a 3-bed/2.0-bath manufactured listed at $218k.
Deal economics
- At list price, monthly cash flow is $326 ($4k/yr) — positive.
- The deal already cash-flows at list — no discount required.
- To meet the 1% rule (rent ≥ 1% of price), the offer needs to be $207k (5.2% below list).
- Recommended offer: $207k (5.2% below list) — sets the bar for 1% rule.
Location & tenants
- Location reads: area grade C — affects rentability + tenant quality, not the cash-flow math above.
- Lafayette County School District (town): math 47% / reading 40% proficiency, ranked #29 of 130 in MS (top 22%) — families likely to look elsewhere, expect single-tenant / working-renter base with shorter leases.
- Zoned schools: Lafayette Upper Elementary School (math 46% / reading 39%, grade F, #105 of 375 statewide, top 28%, 823 students, 100% FRL); Lafayette Middle School (math 45% / reading 42%, grade D, #46 of 179 statewide, top 25%, 447 students, 99% FRL); Lafayette High School (math 53% / reading 42%, grade D, #28 of 197 statewide, top 14%, 868 students, 100% FRL) — zoned schools average 100% FRL vs 49% district-wide (50 pts higher); higher-poverty schools than district average — tighter screening recommended.
- Market conditions: Rents rising fast (+4.8%/yr); 857 active listings in the ZIP; 503 units permitted in Lafayette County in 2024 (0 in 5+ unit buildings).
- This rent runs 36% of the median local income ($68k/yr) — at the standard rent-burdened threshold; future hikes will face affordability resistance.
Forward outlook
- Local home prices are declining (-3.0%/yr); year-one equity from $2k of loan paydown is wiped out by about $7k of value loss. Plan a longer hold.
- Lafayette County population projected at +61% by 2050 — long-run rental-demand tailwind backs the buy-and-hold thesis.
Negotiation context
- It's been on market 18 days — a 2% lower offer ($215k) is reasonable based on typical stale-listing flexibility.
- 2 sale attempts since 2y ago with the ask held roughly flat each time — persistent listings suggest the price (not the market) is what's stuck; bring a comps-based counter.
Risks & watch-outs
- Climate carrying-cost: major wind risk, 27% chance of damaging wind over 30y; extreme-heat days projected 7→22/yr by 2055 (HVAC capex compounding) — expect insurance premiums to compound above CPI over the hold.
Questions for the listing agent
- Is there a deadline driving the sale (1031 exchange, divorce, estate, relocation)? That informs how much negotiation room exists.
- What's the average days-on-market for RENTAL listings here right now (not sales)? A rising rental-DOM trend means longer vacancies and softer asking-rent achievability than the comps imply.
- What's the recent tenant-quality profile in this submarket — average credit score on applications, eviction rate, late-payment / NSF rate, and stable-employment percentage? A property-management company in the area should have these aggregated.
- How much new for-sale + rental construction is in the pipeline within 1–3 miles? Heavy new supply typically softens prices + rents 12–24 months out; constrained supply supports both.
Investment metrics
- 1% rule
- 0.95% ✗
- Cap rate
- 8.09%
- Cash-on-cash
- 6.42%
- DSCR
- 1.29
- GRM
- 8.8
CMA / ARV
No comps found within radius.
Projected returns pro-forma
-3.0% appreciation · 4.85% rent growth · sell at horizon
- IRR
- -4.6%
- Equity multiple
- 0.82×
- Total profit
- $-10,712
- Equity at exit
- $32,505
- IRR
- 6.9%
- Equity multiple
- 1.55×
- Total profit
- $33,765
- Equity at exit
- $18,849
Cash invested: $61,040 (down + closing). Projections, not guarantees.
Landlord ↔ Tenant lean methodology
- Overall (STATE)
- 90 Strongly Landlord-Friendly
- State Mississippi
- 90 Strongly Landlord-Friendly · R+11
- County
- — inherits STATE
- City
- — inherits STATE
ZIP-level market 38655
- Rents YoY
- 4.8%
- Active inventory
- 857
- Price-to-rent
- 8.8×
Monthly cashflow live
- Estimated rent
- $2,067 medium interval (Pro) →
- Mortgage (P&I)
- −$1,143
- Tax from tax record
- −$72 /mo · $870/yr
- Insurance
- −$91
- HOA
- −$0
- Vacancy / Maint / Mgmt
- −$434
- Net cashflow
- $326
Break-even live
Sensitivity live
| Price | -10% $450 | -5% $388 | +0% $326 | +5% $265 | +10% $203 |
|---|---|---|---|---|---|
| Rent | -10% $163 | -5% $245 | +0% $326 | +5% $408 | +10% $490 |
| Rate | -1.0pp $436 | -0.5pp $382 | base $326 | +0.5pp $270 | +1.0pp $212 |
UW: 25.0% down · 7.5% · 30yr · 1.5% tax · 5.0% vac · 8.0% maint · 8.0% mgmt
Financing live
Cash to close
- Down payment
- $54,500
- Closing costs
- $6,540
- Reserves months
- —
- Total cash needed
- —
Loan-product check · same deal, 3 products live
Conventional
25% down · 7.5% · 30yr
- Down + closing
- —
- Monthly P&I
- —
- Monthly cashflow
- —
- DSCR
- —
- Eligible?
- —
Personal DTI + credit; lowest rate.
DSCR
20% down · 8.5% · 30yr
- Down + closing
- —
- Monthly P&I
- —
- Monthly cashflow
- —
- DSCR
- —
- Eligible?
- —
No personal income docs; deal must DSCR.
Hard money
10% down · 12.0% · 12mo
- Down + closing
- —
- Monthly P&I
- —
- Monthly cashflow
- —
- DSCR
- —
- Eligible?
- —
Short-term bridge; refi at stabilization.
Listing history 12 events
-
2026-06-22days on market $218,000 Active 18 DOM
-
2026-06-19days on market $218,000 Active 15 DOM
-
2026-06-18days on market $218,000 Active 14 DOM
-
2026-06-17days on market $218,000 Active 13 DOM
-
2026-06-16days on market $218,000 Active 12 DOM
-
2026-06-15days on market $218,000 Active 11 DOM
-
2026-06-14days on market $218,000 Active 9 DOM
-
2026-06-12days on market $218,000 Active 8 DOM
-
2026-06-09days on market $218,000 Active 5 DOM
-
2026-06-08days on market $218,000 Active 4 DOM
-
2026-06-07remarks 386-char remark
-
2026-06-07$218,000 Active 3 DOM
ⓘ Source: listings_history table (triggers on properties + properties_extension) + one-shot
backfill from property_details.listing_events for pre-trigger history.
Tax reassessment forecast MS · Resets to sale price
- Current annual tax
- $870 · $72/mo
- Projected year-2 tax
- $1,722 · $144/mo
- Expected delta
- +$852/yr (+$71/mo · 98.0%)
ⓘ Screening estimate from a state-policy table — verify with the county assessor before closing.
Climate risk First Street
- Flood 3/10 Moderate FEMA zone X (unshaded) · 20% chance over 30 yrs
- Wildfire 4/10 Moderate
- Heat 6/10 Major 7 d/yr ≥108°F today · 22 d/yr by 30 yrs out
- Wind 6/10 Major 27% chance of damaging wind over 30 yrs
- Air quality 1/10 Low 0 unhealthy d/yr today · 0 by 30 yrs out
Nearby sold comps map
Loading sold comps map…
Walkable amenities ~0.75 mi
Loading nearby amenities…
Taxation est. · year 1
- Rental income
- $24,804
- − Mortgage interest
- −$12,211
- − Property taxes
- −$870
- − Insurance
- −$1,090
- − Repairs & maintenance
- −$1,984
- − Management
- −$1,984
- − Depreciation
- −$6,342
- Taxable income
- $322
- Est. tax owed @ 24.0%
- −$77
- After-tax cash flow
- $3,839/yr
For passive investors: Depreciation is non-cash, so a rental often shows a tax loss while cash-flowing — sheltering income. Rental losses are passive: they offset passive income freely, and up to $25,000/yr can offset ordinary (W-2) income if you actively participate and your MAGI is under $100k (phasing out to $0 by $150k); unused losses carry forward. On sale, claimed depreciation is recaptured at up to 25%, and gains may owe capital-gains tax (a 1031 exchange can defer both). Figures are a year-1 estimate at your 24.0% rate — not tax advice; consult a CPA.
Schools (NCES district)
- District
- Lafayette County School District
- NCES district ID
- 2802370
- Math proficiency
- 47% ▼ -16.00%
- Reading proficiency
- 40% ▼ -12.00%
- Median HH income
- $46,476
- Composite
- 37.09/100
- National rank
- #4498
- State rank
- #29 of 130 in MS
Livability — Tula
No livability data for this city. (Only ~50 U.S. cities are tracked.)
Census & demographics
- County
- Lafayette County · 46,156 people
- Metro
- Oxford, MS
- Population (ZIP)
- 46,156
- Household income
- $68,235
- Rent vs Own
- Severe rent burden
- 1892.0
Population outlook (Lafayette County) Hauer SSP2
- Today (2025)
- 66,984 people
- By 2030
- 74,726 · +11.6%
- By 2040
- 90,806 · +35.6%
- By 2050
- 108,114 · +61.4%
- By 2075
- 151,215 · +125.7%
- By 2100
- 187,997 · +180.7%
Race, ethnicity, and origin ACS 2023
- Neighborhood character
- Predominantly White (68%)
- Race & ethnicity
- White 68% Black 24% Hispanic / Latino 4% Asian 2% Two or more races 2%
- Common ancestry
- Slovak 3% Serbian 2% Lithuanian 1%
- Foreign-born
- 4% · Canada, China, Vietnam
- Languages at home
- 95% English-only · Spanish 2% Other Indo-European 1% Vietnamese 1%
Political lean MEDSL · Lafayette
- 2024 margin
- Strong R (+21.8) · D 38.3% · R 60.0% · Other 1.7%
- 2008→2024 swing
- -9.4pp toward R · 2008: -12.4pp · 2024: -21.8pp
- All cycles
- 2024: R+21.8 2020: R+12.3 2016: R+14.8 2012: R+15.6 2008: R+12.4
Not yet ingested
- Civics
- —
Market trends
- HPI YoY
- ▼ -204.86%
- Current HPI
- 211.5486
- Rent YoY
- ▲ 4.85%
- Metro
- Oxford, MS
- State GDP YoY
- —
- F500 in state
- 0
Price history
+16.3% since first listed5 events — show timeline
- 2026-06-04 Listed $218,000 NCMBR
- 2024-03-21 Sold (Public Records) — Public Records
- 2024-03-20 Sold (MLS) — NCMBR
- 2024-02-19 Pending — NCMBR
- 2024-02-12 Listed $187,500 NCMBR
Property tax history
+25.6%/yrLatest (2025): $870 · +121.8% YoY. Source: county tax records.
Cash-flow waterfall
monthlySold comps — $/sqft
last 12 mo · ≤1 miLoading sold comps…