19911 State Route 165 E · Carbonado, WA
Flood risk 1/10 · Minimal
- FEMA flood zone
- X (unshaded)
- Chance of flooding over 30 yrs
- 0.0%
- Est. flood insurance / yr
- $507 – $1,088
Fire risk 3/10 · Minor
- Est. fire insurance / yr
- $604 – $1,122
Heat risk 1/10 · Minimal
- Hot days now (above 83°F)
- 7 days/yr
- Hot days in 30 yrs
- 15 days/yr
Wind risk 1/10 · Minimal
- Chance of severe wind over 30 yrs
- —
Air-quality risk 7/10 · Major
- Unhealthy air days now
- 11 days/yr
- Unhealthy air days in 30 yrs
- 13 days/yr
Risk factors via First Street. Map © Google.
Why this score? — see what drove the D grade
The composite is a weighted blend of 9 inputs, each scored 0–100. Each bar is that input's sub-score; the figure is the points it added to the 100-point composite (weight × sub-score).
- ARV discount +15.0/15.0
- Appreciation +10.0/10.0
- Schools +6.6/10.0
- Livability +3.2/5.0
- Rent growth +2.5/5.0
- Condition / age +2.5/5.0
- Cash flow +1.8/30.0
- 1% rule +0.0/10.0
- DSCR +0.0/10.0
$565,000
🖨 Deal sheet (PDF) 📄 Offer letter ✓ Due diligence
Listing remarks
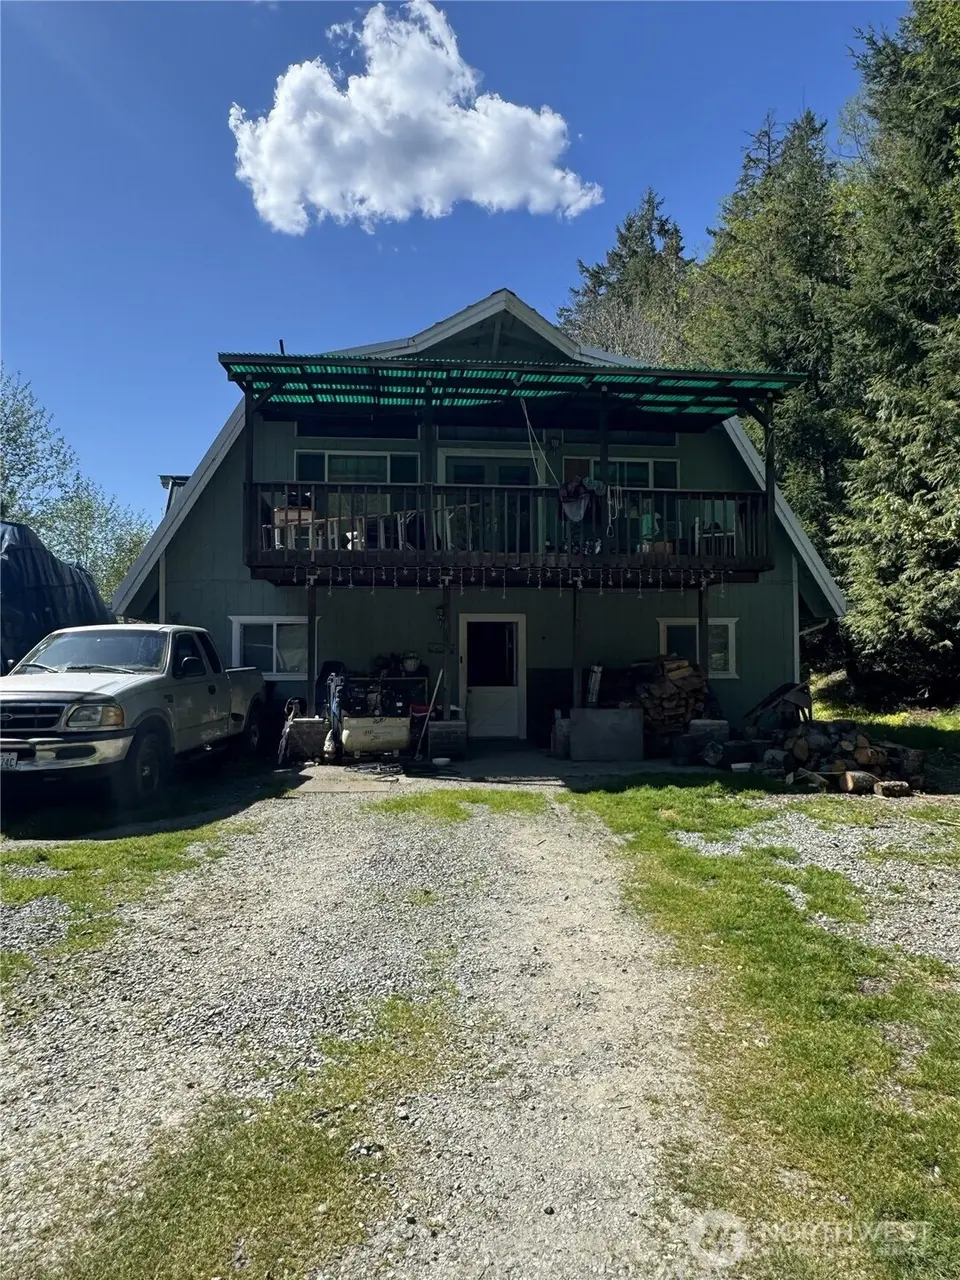
13+ acre wooded hillside property with strong value-add potential. Private setting with expansive land offers opportunities for renovation, expansion, or long-term hold. Existing home features radiant heat and a large deck, providing a solid starting point for improvements. Ideal for investors seeking acreage, privacy, and upside through light-to-moderate rehab.
Key facts
- Large deck
- Expansive land
- Radiant heat
Tags
Property features AI
Finance
- Other: Lot size approximately 13.88 acres
- Financial info: Listing terms: Cash
Exterior
- Parking: Off-street parking
- Utilities: Propane energy source; Water catchment system (see remarks); Septic tank
- Home design: Detached single-family residence; Two-story style; Main-level entry
- Construction: Built in 2003 (effective year); Wood construction; Metal roof; House structure
- Exterior features: Wood exterior
Interior
- Kitchen: Kitchen on second level (no eating area specified)
- Bedrooms: 4 total bedrooms — 3 on main level, 1 on upper level
- Flooring: Concrete; Stone; Carpet
- Bathrooms: 2 full bathrooms — 1 on main level, 1 on upper level
- Heating & cooling: Radiant heating; No central cooling
- Interior features: Fireplace; French doors; Walk-in closets
- Laundry & utility: Utility room on main level
Neighborhood map
What this means for you Summary
Snapshot
- This is a 4-bed/2.0-bath single-family listed at $565k.
Deal economics
- At list price, monthly cash flow is $-2k ($-26k/yr) — negative.
- To cash-flow at today's rent, offer at most $188k (66.7% below list).
- To meet the 1% rule (rent ≥ 1% of price), the offer needs to be $203k (64.1% below list).
- Recommended offer: $188k (66.7% below list) — sets the bar for cash-flow.
Location & tenants
- Location reads 63/100 on livability (#400 in WA) — a middle-class / working-renter tenant base. Strengths: employment A+, housing A+; Watch: crime C-, amenities F, commute F.
- Carbonado School District (rural): math 70% / reading 80% proficiency, ranked #11 of 291 in WA (top 4%) — strong family-tenant draw, lease renewals of 3-5y typical.
- Zoned schools: Carbonado Historical School 19 (180 students, 30% FRL).
- Market conditions: 8 active listings in the ZIP; 3,209 units permitted in Pierce County in 2024 (1,269 in 5+ unit buildings).
Forward outlook
- In year one you build about $60k of equity ($4k loan paydown + $56k appreciation (10.0% local appreciation)).
- Pierce County population projected at +26% by 2050 — long-run rental-demand tailwind backs the buy-and-hold thesis.
- By year 2, paydown + projected appreciation supports a ~$97k cash-out refi (75% LTV) — recoverable capital for the next deal without selling this one.
Negotiation context
- It's been on market 37 days — a 3% lower offer ($548k) is reasonable based on typical stale-listing flexibility.
- 3 sale attempts since 25y ago; this cycle's ask has dropped $34k (6%) from the opening price — seller is motivated, your offer sets the floor, not the list.
- Current owner paid $162k; list at $565k implies a 248% gain — meaningful room to come down on a strong offer.
Questions for the listing agent
- What do current leases actually rent for vs. the listed asking? Can we see a recent rent roll and the last 12 months of T-12 income?
- It's been on market 37 days. Have you received any prior offers? Is the seller open to a 67% concession, seller financing, or rate buy-down credit?
- Is there a deadline driving the sale (1031 exchange, divorce, estate, relocation)? That informs how much negotiation room exists.
- Schools are B-rated — typically a magnet for longer-tenancy family renters. What's the average tenant stay here, and is there a school-zone premium baked into asking?
- The area grade is low — what's the realistic commute time and amenity access for the typical tenant pool here? Any planned neighborhood developments (good or bad) we should know about?
- What's the average days-on-market for RENTAL listings here right now (not sales)? A rising rental-DOM trend means longer vacancies and softer asking-rent achievability than the comps imply.
- What's the recent tenant-quality profile in this submarket — average credit score on applications, eviction rate, late-payment / NSF rate, and stable-employment percentage? A property-management company in the area should have these aggregated.
- How much new for-sale + rental construction is in the pipeline within 1–3 miles? Heavy new supply typically softens prices + rents 12–24 months out; constrained supply supports both.
Investment metrics
- 1% rule
- 0.36% ✗
- Cap rate
- 1.76%
- Cash-on-cash
- -16.18%
- DSCR
- 0.28
- GRM
- 23.2
CMA / ARV
- ARV (median comp)
- $710,628
- List price
- $565,000
- Delta
- -20.49%
- Verdict
- UNDERPRICED
- Comps
- 11 within 1.0 mi
Show comp detail 3 sales within ~0.75 mi
| Address | Dist | Beds/Ba | Sqft | Sold | Price | $/sf | Match |
|---|---|---|---|---|---|---|---|
| 381 Coal Ave | 0.62mi | 4/2.5 | 2,482 (+7%) | 8mo | $715,000 | $288 | 51 |
| 320 Coal Ave | 0.67mi | 3/1.5 (-1) | 2,048 (-12%) | 0mo | $515,000 | $251 | 42 |
| 240 Pershing Ave | 0.71mi | 3/2.0 (-1) | 2,000 (-14%) | 8mo | $360,000 | $180 | 32 |
Match score weights: distance 35% · size 25% · config 20% · recency 20%. Top-matched comps best support the ARV.
Projected returns pro-forma
10.0% appreciation · 3.0% rent growth · sell at horizon
- IRR
- 13.1%
- Equity multiple
- 2.09×
- Total profit
- $171,821
- Equity at exit
- $508,997
- IRR
- 13.4%
- Equity multiple
- 4.87×
- Total profit
- $612,646
- Equity at exit
- $1,097,671
Cash invested: $158,200 (down + closing). Projections, not guarantees.
Landlord ↔ Tenant lean methodology
- Overall (STATE)
- 28 Tenant-Leaning
- State Washington
- 28 Tenant-Leaning · D+8
- County
- — inherits STATE
- City
- — inherits STATE
ZIP-level market 98323
- Home prices YoY
- 31.4%
- Active inventory
- 8
- Price-to-rent
- 23.2×
Monthly cashflow live
- Estimated rent
- $2,029 medium interval (Pro) →
- Mortgage (P&I)
- −$2,963
- Tax from tax record
- −$537 /mo · $6,445/yr
- Insurance
- −$235
- HOA
- −$0
- Vacancy / Maint / Mgmt
- −$426
- Net cashflow
- $-2,132
Break-even live
Sensitivity live
| Price | -10% $-1,813 | -5% $-1,973 | +0% $-2,132 | +5% $-2,292 | +10% $-2,452 |
|---|---|---|---|---|---|
| Rent | -10% $-2,293 | -5% $-2,213 | +0% $-2,132 | +5% $-2,052 | +10% $-1,972 |
| Rate | -1.0pp $-1,848 | -0.5pp $-1,989 | base $-2,132 | +0.5pp $-2,279 | +1.0pp $-2,428 |
UW: 25.0% down · 7.5% · 30yr · 1.5% tax · 5.0% vac · 8.0% maint · 8.0% mgmt
Financing live
Cash to close
- Down payment
- $141,250
- Closing costs
- $16,950
- Reserves months
- —
- Total cash needed
- —
Loan-product check · same deal, 3 products live
Conventional
25% down · 7.5% · 30yr
- Down + closing
- —
- Monthly P&I
- —
- Monthly cashflow
- —
- DSCR
- —
- Eligible?
- —
Personal DTI + credit; lowest rate.
DSCR
20% down · 8.5% · 30yr
- Down + closing
- —
- Monthly P&I
- —
- Monthly cashflow
- —
- DSCR
- —
- Eligible?
- —
No personal income docs; deal must DSCR.
Hard money
10% down · 12.0% · 12mo
- Down + closing
- —
- Monthly P&I
- —
- Monthly cashflow
- —
- DSCR
- —
- Eligible?
- —
Short-term bridge; refi at stabilization.
Listing history 14 events
-
2026-06-07statusdays on market $565,000 Pending 37 DOM
-
2026-06-04days on market $565,000 Active 35 DOM
-
2026-06-03days on market $565,000 Active 34 DOM
-
2026-06-02days on market $565,000 Active 33 DOM
-
2026-06-01days on market $565,000 Active 32 DOM
-
2026-05-31days on market $565,000 Active 31 DOM
-
2026-05-18price $565,000
-
2026-04-30$599,000 Active
-
2014-12-05soldstatus $162,500 Sold
-
2014-11-20status Pending
-
2014-11-18$179,900 Active
-
2001-03-15soldstatus $186,500
-
2001-02-07$192,500
-
1995-08-21soldstatus $72,500
ⓘ Source: listings_history table (triggers on properties + properties_extension) + one-shot
backfill from property_details.listing_events for pre-trigger history.
Tax reassessment forecast WA · Resets to sale price
- Current annual tax
- $6,445 · $537/mo
- Projected year-2 tax
- $6,445 · $537/mo
- Expected delta
- $0/yr ($0/mo · 0.0%)
ⓘ Screening estimate from a state-policy table — verify with the county assessor before closing.
Climate risk First Street
- Flood 1/10 Low FEMA zone X (unshaded) · 0% chance over 30 yrs
- Wildfire 3/10 Moderate
- Heat 1/10 Low 7 d/yr ≥83°F today · 15 d/yr by 30 yrs out
- Wind 1/10 Low
- Air quality 7/10 Severe 11 unhealthy d/yr today · 13 by 30 yrs out
Nearby sold comps map
Loading sold comps map…
Walkable amenities ~0.75 mi
Loading nearby amenities…
Taxation est. · year 1
- Rental income
- $24,349
- − Mortgage interest
- −$31,649
- − Property taxes
- −$6,445
- − Insurance
- −$2,825
- − Repairs & maintenance
- −$1,948
- − Management
- −$1,948
- − Depreciation
- −$16,436
- Taxable loss
- −$36,903
- Est. tax savings @ 24.0%
- +$8,857
- After-tax cash flow
- $-16,733/yr
For passive investors: Depreciation is non-cash, so a rental often shows a tax loss while cash-flowing — sheltering income. Rental losses are passive: they offset passive income freely, and up to $25,000/yr can offset ordinary (W-2) income if you actively participate and your MAGI is under $100k (phasing out to $0 by $150k); unused losses carry forward. On sale, claimed depreciation is recaptured at up to 25%, and gains may owe capital-gains tax (a 1031 exchange can defer both). Figures are a year-1 estimate at your 24.0% rate — not tax advice; consult a CPA.
Schools (NCES district)
- District
- Carbonado School District
- NCES district ID
- 5300870
- Math proficiency
- 70% ▲ 5.00%
- Reading proficiency
- 80% ▲ 5.00%
- Median HH income
- $66,489
- Composite
- 66.06/100
- National rank
- #964
- State rank
- #11 of 291 in WA
Livability — Carbonado
- Score
- 63/100
- State rank
- #400
- US rank
- #15975
Category grades
Schools grade is shown separately in the Schools card above.
Census & demographics
- Population (ZIP)
- 712
Population outlook (Pierce County) Hauer SSP2
- Today (2025)
- 956,648 people
- By 2030
- 1,010,862 · +5.7%
- By 2040
- 1,113,170 · +16.4%
- By 2050
- 1,206,524 · +26.1%
- By 2075
- 1,436,425 · +50.2%
- By 2100
- 1,563,654 · +63.5%
Race, ethnicity, and origin ACS 2023
- Neighborhood character
- Predominantly White (93%)
- Race & ethnicity
- White 93% Two or more races 7% Hispanic / Latino 4%
- Common ancestry
- Slovak 14% Romanian 4% Italian 4%
- Foreign-born
- 4%
- Languages at home
- 99% English-only · Spanish 1%
Political lean MEDSL · Pierce
- 2024 margin
- D (+10.8) · D 53.9% · R 43.1% · Other 3.0%
- 2008→2024 swing
- -1.4pp toward R · 2008: 12.2pp · 2024: 10.8pp
- All cycles
- 2024: D+10.8 2020: D+11.2 2016: D+7.5 2012: D+11.0 2008: D+12.2
Not yet ingested
- Civics
- —
Market trends
- HPI YoY
- ▲ 77.84%
- Current HPI
- 325.81
- Rent YoY
- —
- Metro
- —
- State GDP YoY
- ▲ 4.65%
- F500 in state
- 22
Industry mix (Fortune 500 HQ in WA)
| Industry | F500 HQs | Revenue |
|---|---|---|
| Retail | 2 | $269B |
|
||
| Technology / Retail | 1 | $638B |
|
||
| Technology | 1 | $245B |
|
||
| Telecommunications | 1 | $38B |
|
||
| Food / Beverage | 1 | $36B |
|
||
| Automotive / Trucks | 1 | $34B |
|
||
Price history
+679.3% since first listed9 events — show timeline
- 2026-06-07 Pending — NWMLS as Distributed by MLS Grid
- 2026-05-18 Price Changed $565,000 NWMLS as Distributed by MLS Grid
- 2026-04-30 Listed $599,000 NWMLS as Distributed by MLS Grid
- 2014-12-05 Sold (MLS) $162,500 NWMLS as Distributed by MLS Grid
- 2014-11-20 Pending — NWMLS as Distributed by MLS Grid
- 2014-11-18 Listed $179,900 NWMLS as Distributed by MLS Grid
- 2001-03-15 Sold (MLS) $186,500 NWMLS as Distributed by MLS Grid
- 2001-02-07 Listed $192,500 NWMLS as Distributed by MLS Grid
- 1995-08-21 Sold (Public Records) $72,500 Public Records
Property tax history
+1.6%/yrLatest (2026): $6,445 · +0.1% YoY. Source: county tax records.
Cash-flow waterfall
monthlySold comps — $/sqft
last 12 mo · ≤1 miLoading sold comps…