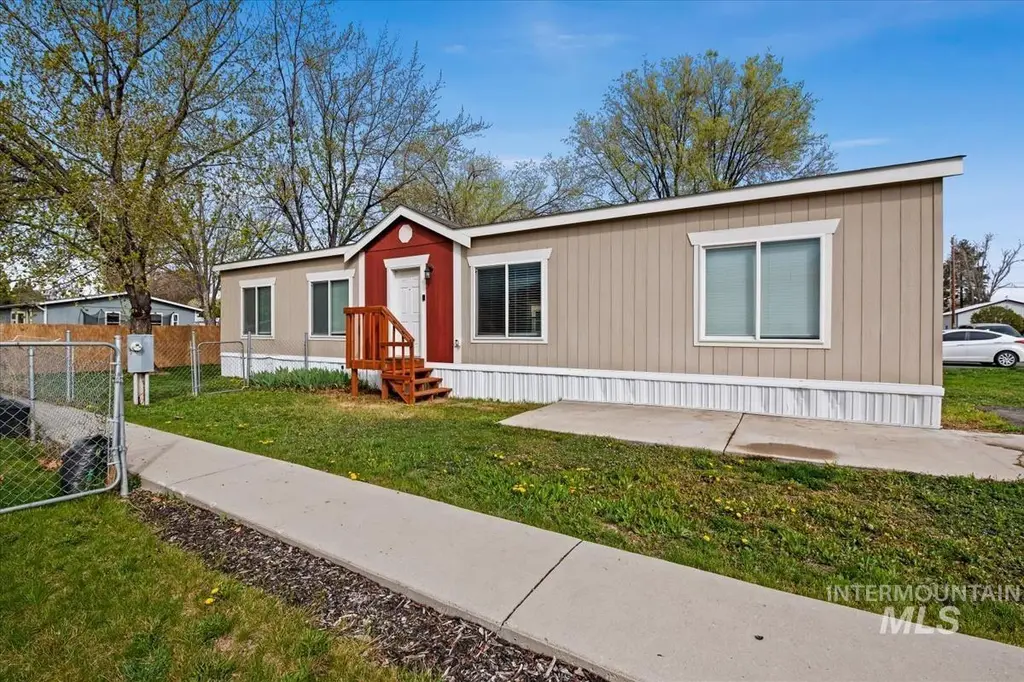
951 W Avalon St #16 · Kuna, ID
Flood risk 1/10 · Minimal
- FEMA flood zone
- X (unshaded)
- Chance of flooding over 30 yrs
- 0.0%
- Est. flood insurance / yr
- $507 – $1,088
Fire risk 6/10 · Moderate
- Est. fire insurance / yr
- $584 – $1,086
Heat risk 5/10 · Moderate
- Hot days now (above 96°F)
- 7 days/yr
- Hot days in 30 yrs
- 19 days/yr
Wind risk 1/10 · Minimal
- Chance of severe wind over 30 yrs
- —
Air-quality risk 7/10 · Major
- Unhealthy air days now
- 12 days/yr
- Unhealthy air days in 30 yrs
- 16 days/yr
Risk factors via First Street. Map © Google.
Why this score? — see what drove the B- grade
The composite is a weighted blend of 9 inputs, each scored 0–100. Each bar is that input's sub-score; the figure is the points it added to the 100-point composite (weight × sub-score).
- Cash flow +29.9/30.0
- DSCR +10.0/10.0
- 1% rule +8.4/10.0
- ARV discount +7.5/15.0
- Rent growth +4.1/5.0
- Livability +3.8/5.0
- Schools +3.2/10.0
- Condition / age +2.5/5.0
- Appreciation +0.0/10.0
$167,500
🖨 Deal sheet 📄 Offer letter ✓ Due diligence
Listing remarks
6 months of lot rent covered by seller with accepted offer! Don't miss this opportunity for affordable living on a spacious lot! This well maintained Fleetwood comes with plenty of updates and move in ready! The large lot provides ample parking, a storage shed, fully fenced yard and room to spread out. Conveniently located near downtown and recreational activities, this home offers both value and location.
Key facts
- Ample parking
- Spacious lot
- Storage shed
Tags
Property features AI
Finance
- Other:
- Financial info:
- HOA & community: Monthly association fee
Exterior
- Parking:
- Security:
- Utilities: City water service; Sewer connected
- Home design: Mobile/manufactured home on a rented lot; Built in 2017
- Construction: Composition roof
- Exterior features: Full metal fencing; Manual sprinkler system; Storage shed
Interior
- Kitchen: Dishwasher; Breakfast bar
- Bedrooms: 3 bedrooms, all on the main level
- Flooring: Carpet
- Bathrooms: 2 bathrooms
- Heating & cooling: Forced air heating; Central air conditioning
- Interior features: Split bedroom layout; Family room; Walk-in closet(s); Breakfast bar
- Laundry & utility: Washer; Dryer; Electric water heater; Owned water softener
Neighborhood map
What this means for you Summary
Snapshot
- This is a 3-bed/2.0-bath manufactured listed at $168k.
Deal economics
- At list price, monthly cash flow is $620 ($7k/yr) — positive.
- The deal already cash-flows at list — no discount required.
- Meets the 1% rule at list price ($2k rent vs $168k).
- Recommended offer: $157k (6.0% below list) — sets the bar for market timing.
- Cap rate 10.7% vs local median 2.8% in Kuna — top-decile yield for the area; either an underpriced asset or a hidden risk that comps aren't pricing in. Stress-test before assuming the spread holds.
Location & tenants
- Location reads 75/100 on livability (#28 in ID, #3,954 nationally) — a middle-class / working-renter tenant base. Strengths: housing A+, health & safety A+, crime A; Watch: amenities F, commute F.
- Kuna Joint District (town): math 28% / reading 44% proficiency, ranked #71 of 92 in ID (top 77%) — families likely to look elsewhere, expect single-tenant / working-renter base with shorter leases.
- Zoned schools: Kuna High School (math 22% / reading 51%, grade F, #105 of 169 statewide, top 63%, 1,736 students, 18% FRL).
- Market conditions: Rents rising fast (+6.2%/yr); 797 active listings in the ZIP; 6 comparable units currently listed for rent nearby; rentals leasing fast (median 11d on market — plan ~1-2 weeks tenant-placement turnaround); solid renter incomes; 5,129 units permitted in Ada County in 2024 (414 in 5+ unit buildings).
Forward outlook
- Local home prices are declining (-3.0%/yr); year-one equity from $1k of loan paydown is wiped out by about $5k of value loss. Plan a longer hold.
- Ada County population projected at +45% by 2050 — long-run rental-demand tailwind backs the buy-and-hold thesis.
- At projected returns (-3.0% appreciation + 6.2% rent growth), your $47k cash investment doubles in ~7 years — after that, you're playing with house money.
Negotiation context
- It's been on market 69 days — a 6% lower offer ($157k) is reasonable based on typical stale-listing flexibility.
- 4 sale attempts since 10y ago; this cycle's ask has dropped $12k (6%) from the opening price — seller is motivated, your offer sets the floor, not the list.
Risks & watch-outs
- Climate carrying-cost: major wildfire risk; extreme-heat days projected 7→19/yr by 2055 (HVAC capex compounding) — expect insurance premiums to compound above CPI over the hold.
Questions for the listing agent
- It's been on market 69 days. Have you received any prior offers? Is the seller open to a 6% concession, seller financing, or rate buy-down credit?
- Why hasn't it sold? Are there any deal-killer items the seller is aware of (foundation, flood, title, zoning, code violations)?
- Is there a deadline driving the sale (1031 exchange, divorce, estate, relocation)? That informs how much negotiation room exists.
- What's the average days-on-market for RENTAL listings here right now (not sales)? A rising rental-DOM trend means longer vacancies and softer asking-rent achievability than the comps imply.
- What's the recent tenant-quality profile in this submarket — average credit score on applications, eviction rate, late-payment / NSF rate, and stable-employment percentage? A property-management company in the area should have these aggregated.
- How much new for-sale + rental construction is in the pipeline within 1–3 miles? Heavy new supply typically softens prices + rents 12–24 months out; constrained supply supports both.
Investment metrics
- 1% rule
- 1.34% ✓
- Cap rate
- 10.73%
- Cash-on-cash
- 15.86%
- DSCR
- 1.71
- GRM
- 6.2
CMA / ARV
- ARV (on-the-fly)
- $367,740
- Comps found
- 1
Show comp detail 1 sale within ~0.75 mi
| Address | Dist | Beds/Ba | Sqft | Sold | Price | $/sf | Match |
|---|---|---|---|---|---|---|---|
| 1238 W Owyhee St | 0.23mi | 3/2.0 | 1,575 (-3%) | 13mo | $357,000 | $227 | 74 |
Match score weights: distance 35% · size 25% · config 20% · recency 20%. Top-matched comps best support the ARV.
Projected returns pro-forma
-3.0% appreciation · 6.23% rent growth · sell at horizon
- IRR
- 10.4%
- Equity multiple
- 1.42×
- Total profit
- $19,909
- Equity at exit
- $24,975
- IRR
- 21.9%
- Equity multiple
- 3.16×
- Total profit
- $101,397
- Equity at exit
- $14,482
Cash invested: $46,900 (down + closing). Projections, not guarantees.
Landlord ↔ Tenant lean methodology
- Overall (STATE)
- 91 Strongly Landlord-Friendly
- State Idaho
- 91 Strongly Landlord-Friendly · R+18
- County
- — inherits STATE
- City
- — inherits STATE
ZIP-level market 83634
- Home prices YoY
- -28.8%
- Rents YoY
- 6.2%
- Active inventory
- 797
- Price-to-rent
- 6.2×
Monthly cashflow live
- Estimated rent
- $2,250 high interval (Pro) →
- Mortgage (P&I)
- −$878
- Tax est. 1.5%
- −$209 /mo · $2,512/yr
- Insurance
- −$70
- HOA
- −$0
- Vacancy / Maint / Mgmt
- −$472
- Net cashflow
- $620
Break-even live
UW: 25.0% down · 7.5% · 30yr · 1.5% tax · 5.0% vac · 8.0% maint · 8.0% mgmt
Financing live
Cash to close
- Down payment
- $41,875
- Closing costs
- $5,025
- Reserves months
- —
- Total cash needed
- —
Loan-product check · same deal, 3 products live
Conventional
25% down · 7.5% · 30yr
- Down + closing
- —
- Monthly P&I
- —
- Monthly cashflow
- —
- DSCR
- —
- Eligible?
- —
Personal DTI + credit; lowest rate.
DSCR
20% down · 8.5% · 30yr
- Down + closing
- —
- Monthly P&I
- —
- Monthly cashflow
- —
- DSCR
- —
- Eligible?
- —
No personal income docs; deal must DSCR.
Hard money
10% down · 12.0% · 12mo
- Down + closing
- —
- Monthly P&I
- —
- Monthly cashflow
- —
- DSCR
- —
- Eligible?
- —
Short-term bridge; refi at stabilization.
Rent comps 6 comps
| Address | Beds | Baths | Sqft | Rent | $/sqft | DOM | Units | Dist |
|---|---|---|---|---|---|---|---|---|
| 1463 W Ryegrass Ct Kuna, ID | 3.0 | 2.0 | 1290 | $2,095 | $1.62 | 23d | 1 | 0.47mi |
| 765 W Backpack Ln Apt 102 Kuna, ID | 3.0 | 2.0 | 1206 | $1,685 | $1.40 | 3d | 1 | 0.54mi |
| 1832 N Madderlake Pl Kuna, ID | 2.0–3.0 | 2.0 | 1130 | $1,779 | $1.57 | 2d | 6 | 1.28mi |
| 1320 N Sailer Ave Kuna, ID | 1.0–3.0 | 1.0–2.0 | 1050 | $2,000 | $1.90 | 2d | 1 | 1.33mi |
| 2662 W Balboa Dr Kuna, ID | 4.0 | 2.0 | 2025 | $2,400 | $1.19 | 11d | 1 | 1.49mi |
| 2711 W Balboa Dr Kuna, ID | 3.0 | 2.5 | 1851 | $2,146 | $1.16 | 14d | 1 | 1.50mi |
Listing history 24 events
-
2026-06-19remarks 409-char remark
-
2026-06-18days on market $167,500 Active 69 DOM
-
2026-06-17days on market $167,500 Active 68 DOM
-
2026-06-16days on market $167,500 Active 67 DOM
-
2026-06-15days on market $167,500 Active 66 DOM
-
2026-06-13days on market $167,500 Active 64 DOM
-
2026-06-13days on market $167,500 Active 63 DOM
-
2026-06-10days on market $167,500 Active 61 DOM
-
2026-06-09days on market $167,500 Active 60 DOM
-
2026-06-08days on market $167,500 Active 59 DOM
-
2026-06-07days on market $167,500 Active 58 DOM
-
2026-06-05days on market $167,500 Active 55 DOM
-
2026-06-03days on market $167,500 Active 54 DOM
-
2026-06-03days on market $167,500 Active 53 DOM
-
2026-06-01days on market $167,500 Active 52 DOM
-
2026-05-31days on market $167,500 Active 51 DOM
-
2026-04-28price $167,500
-
2026-04-15status Active
-
2026-04-09status Pending
-
2026-04-03$179,000 Active
-
2019-04-26soldstatus Sold
-
2019-03-26status Pending
-
2019-02-22$89,900 Active
-
2016-02-08$25,000
ⓘ Source: listings_history table (triggers on properties + properties_extension) + one-shot
backfill from property_details.listing_events for pre-trigger history.
Climate risk First Street
- Flood 1/10 Low FEMA zone X (unshaded) · 0% chance over 30 yrs
- Wildfire 6/10 Major
- Heat 5/10 Major 7 d/yr ≥96°F today · 19 d/yr by 30 yrs out
- Wind 1/10 Low
- Air quality 7/10 Severe 12 unhealthy d/yr today · 16 by 30 yrs out
Nearby sold comps map
Loading sold comps map…
Walkable amenities ~0.75 mi
Loading nearby amenities…
Taxation est. · year 1
- Rental income
- $26,996
- − Mortgage interest
- −$9,383
- − Property taxes
- −$2,512
- − Insurance
- −$838
- − Repairs & maintenance
- −$2,160
- − Management
- −$2,160
- − Depreciation
- −$4,873
- Taxable income
- $5,072
- Est. tax owed @ 24.0%
- −$1,217
- After-tax cash flow
- $6,219/yr
For passive investors: Depreciation is non-cash, so a rental often shows a tax loss while cash-flowing — sheltering income. Rental losses are passive: they offset passive income freely, and up to $25,000/yr can offset ordinary (W-2) income if you actively participate and your MAGI is under $100k (phasing out to $0 by $150k); unused losses carry forward. On sale, claimed depreciation is recaptured at up to 25%, and gains may owe capital-gains tax (a 1031 exchange can defer both). Figures are a year-1 estimate at your 24.0% rate — not tax advice; consult a CPA.
Schools (NCES district)
- District
- Kuna Joint District
- NCES district ID
- 1601770
- Math proficiency
- 28% ▼ -7.00%
- Reading proficiency
- 44% ▬ 0.00%
- Median HH income
- $61,786
- Composite
- 32.25/100
- National rank
- #5765
- State rank
- #71 of 92 in ID
Livability — Kuna
- Score
- 75/100
- State rank
- #28
- US rank
- #3954
Category grades
Schools grade is shown separately in the Schools card above.
Census & demographics
- Census place
- Kuna, ID
- County
- Ada County · 522,161 people
- City population
- 36,286
- Metro
- Boise City, ID
- Population (ZIP)
- 36,286
- Household income
- $97,171
- Rent vs Own
- Severe rent burden
- 150.0
Population outlook (Ada County) Hauer SSP2
- Today (2025)
- 535,818 people
- By 2030
- 585,751 · +9.3%
- By 2040
- 682,435 · +27.4%
- By 2050
- 775,818 · +44.8%
- By 2075
- 994,458 · +85.6%
- By 2100
- 1,148,884 · +114.4%
Race, ethnicity, and origin ACS 2023
- Neighborhood character
- Predominantly White (82%)
- Race & ethnicity
- White 82% Hispanic / Latino 11% Two or more races 7% Native American 1%
- Hispanic origin (detail)
- Mexican 8%
- Common ancestry
- Slovak 4% Italian 3% Iranian 2%
- Foreign-born
- 5% · Canada
- Languages at home
- 91% English-only · Spanish 7% Other Asian/Pacific 1%
Political lean MEDSL · Ada
- 2024 margin
- R (+10.3) · D 43.4% · R 53.8% · Other 2.8%
- 2008→2024 swing
- -4.2pp toward R · 2008: -6.2pp · 2024: -10.3pp
- All cycles
- 2024: R+10.3 2020: R+3.9 2016: R+9.2 2012: R+11.3 2008: R+6.2
Not yet ingested
- Civics
- —
Market trends
- HPI YoY
- ▼ -138.50%
- Current HPI
- 341.9896
- Rent YoY
- ▲ 6.23%
- Metro
- Boise City, ID
- State GDP YoY
- ▲ 4.51%
- F500 in state
- 6
Industry mix (Fortune 500 HQ in ID)
| Industry | F500 HQs | Revenue |
|---|---|---|
| Retail | 1 | $79B |
|
||
| Technology | 1 | $25B |
|
||
| Food / Agriculture | 1 | $6B |
|
||
Price history
+570.0% since first listed8 events — show timeline
- 2026-04-28 Price Changed $167,500 IMLS
- 2026-04-15 Relisted — IMLS
- 2026-04-09 Pending — IMLS
- 2026-04-03 Listed $179,000 IMLS
- 2019-04-26 Sold (MLS) — IMLS
- 2019-03-26 Pending — IMLS
- 2019-02-22 Listed $89,900 IMLS
- 2016-02-08 Listed $25,000 IMLS
Cash-flow waterfall
monthlySold comps — $/sqft
last 12 mo · ≤1 miLoading sold comps…