12727 W Glendale Ave #106 · Glendale, AZ
Flood risk 1/10 · Minimal
- FEMA flood zone
- X (shaded)
- Chance of flooding over 30 yrs
- 0.0%
- Est. flood insurance / yr
- $507 – $1,088
Fire risk 4/10 · Minor
- Est. fire insurance / yr
- $610 – $1,132
Heat risk 9/10 · Severe
- Hot days now (above 113°F)
- 7 days/yr
- Hot days in 30 yrs
- 19 days/yr
Wind risk 1/10 · Minimal
- Chance of severe wind over 30 yrs
- —
Air-quality risk 1/10 · Minimal
- Unhealthy air days now
- 0 days/yr
- Unhealthy air days in 30 yrs
- 0 days/yr
Risk factors via First Street. Map © Google.
Why this score? — see what drove the B- grade
The composite is a weighted blend of 9 inputs, each scored 0–100. Each bar is that input's sub-score; the figure is the points it added to the 100-point composite (weight × sub-score).
- Cash flow +30.0/30.0
- 1% rule +10.0/10.0
- DSCR +10.0/10.0
- ARV discount +7.5/15.0
- Livability +3.8/5.0
- Schools +2.8/10.0
- Condition / age +2.5/5.0
- Rent growth +1.9/5.0
- Appreciation +0.0/10.0
$64,200
🖨 Deal sheet 📄 Offer letter ✓ Due diligence
Listing remarks
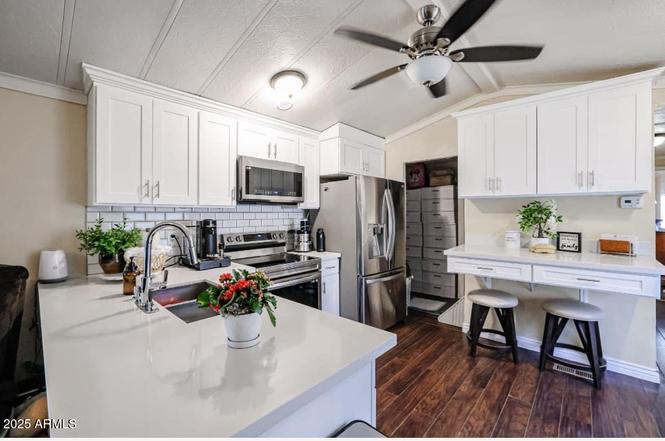
WOW. This beautifully updated 2-bedroom, 2-bathroom manufactured home offers modern comfort and style at an incredible value. Step inside to a stunning kitchen with brand-new appliances, sleek finishes, and updated flooring that flows seamlessly throughout. The spacious living room is designed for both relaxation and entertaining. Located in a desirable area, this home is move-in ready and waiting for you! Plus, with FINANCING AVAILABLE and low, affordable lot rent, it's the perfect opportunity to own your dream home without stretching your budget. MUST SEE!!!
Key facts
- 4 parking spots
- Community pool
- Built 1983
Property features AI
Finance
- HOA & community: Land lease: $755 monthly; No association fees included; Community pool; Community playground
Exterior
- Parking: 4 covered parking spaces; 4 carport spaces
- Utilities: City water; Public sewer
- Home design: Manufactured/mobile home; Leasehold ownership
- Construction: Wood frame construction; Owner-provided building area information
- Exterior features: Chain-link fencing; Metal roof
Interior
- Kitchen: Dishwasher
- Bedrooms: 2 possible bedrooms
- Flooring: Laminate flooring
- Bathrooms: 2 full bathrooms
- Heating & cooling: Electric heating; Central air conditioning
- Interior features: Breakfast bar; Dual-pane windows
Neighborhood map
What this means for you Summary
Snapshot
- This is a 2-bed/2.0-bath manufactured listed at $64k.
Deal economics
- At list price, monthly cash flow is $713 ($9k/yr) — positive.
- The deal already cash-flows at list — no discount required.
- Meets the 1% rule at list price ($1k rent vs $64k).
- Recommended offer: $56k (12.0% below list) — sets the bar for market timing.
- Cap rate 19.6% vs local median 3.5% in Glendale — top-decile yield for the area; either an underpriced asset or a hidden risk that comps aren't pricing in. Stress-test before assuming the spread holds.
Location & tenants
- Location reads 76/100 on livability (#12 in AZ, #3,235 nationally) — a middle-class / working-renter tenant base. Strengths: commute A+, housing A+, amenities B; Watch: health & safety D+, crime F.
- Agua Fria Union High School District (4289) (suburban): math 24% / reading 37% proficiency, ranked #99 of 249 in AZ (top 40%) — families likely to look elsewhere, expect single-tenant / working-renter base with shorter leases.
- Zoned schools: Agua Fria High School (math 15% / reading 26%, grade F, #222 of 381 statewide, top 59%, 1,652 students, 62% FRL).
- Market conditions: Rents soft (-2.3%/yr); 60 active listings in the ZIP; 3 comparable units currently listed for rent nearby; rentals leasing fast (median 1d on market — plan ~1-2 weeks tenant-placement turnaround); solid renter incomes; 36,011 units permitted in Maricopa County in 2024 (12,801 in 5+ unit buildings).
Forward outlook
- Local home prices are declining (-3.0%/yr); year-one equity from $444 of loan paydown is wiped out by about $2k of value loss. Plan a longer hold.
- Maricopa County population projected at +38% by 2050 — long-run rental-demand tailwind backs the buy-and-hold thesis.
- At projected returns (-3.0% appreciation + 0.0% rent growth), your $18k cash investment doubles in ~3 years — after that, you're playing with house money.
Negotiation context
- It's been on market 287 days — a 12% lower offer ($56k) is reasonable based on typical stale-listing flexibility.
- 9 sale attempts since 3y ago; this cycle's ask has dropped $15k (19%) from the opening price — seller is motivated, your offer sets the floor, not the list.
Risks & watch-outs
- Climate carrying-cost: extreme-heat days projected 7→19/yr by 2055 (HVAC capex compounding) — expect insurance premiums to compound above CPI over the hold.
Questions for the listing agent
- It's been on market 287 days. Have you received any prior offers? Is the seller open to a 12% concession, seller financing, or rate buy-down credit?
- Why hasn't it sold? Are there any deal-killer items the seller is aware of (foundation, flood, title, zoning, code violations)?
- Is there a deadline driving the sale (1031 exchange, divorce, estate, relocation)? That informs how much negotiation room exists.
- Crime grade is F in this area — have there been break-ins, vandalism, or insurance claims at this property in the last 3 years? What carrier currently insures it and at what premium?
- What's the average days-on-market for RENTAL listings here right now (not sales)? A rising rental-DOM trend means longer vacancies and softer asking-rent achievability than the comps imply.
- What's the recent tenant-quality profile in this submarket — average credit score on applications, eviction rate, late-payment / NSF rate, and stable-employment percentage? A property-management company in the area should have these aggregated.
- How much new for-sale + rental construction is in the pipeline within 1–3 miles? Heavy new supply typically softens prices + rents 12–24 months out; constrained supply supports both.
Investment metrics
- 1% rule
- 2.28% ✓
- Cap rate
- 19.61%
- Cash-on-cash
- 47.57%
- DSCR
- 3.12
- GRM
- 3.7
CMA / ARV
No comps found within radius.
Projected returns pro-forma
-3.0% appreciation · 0.0% rent growth · sell at horizon
- IRR
- 41.5%
- Equity multiple
- 2.71×
- Total profit
- $30,719
- Equity at exit
- $9,572
- IRR
- 46.3%
- Equity multiple
- 4.82×
- Total profit
- $68,709
- Equity at exit
- $5,551
Cash invested: $17,976 (down + closing). Projections, not guarantees.
Landlord ↔ Tenant lean methodology
- Overall (STATE)
- 87 Strongly Landlord-Friendly
- State Arizona
- 87 Strongly Landlord-Friendly · R+3
- County
- — inherits STATE
- City
- — inherits STATE
ZIP-level market 85307
- Home prices YoY
- -15.7%
- Rents YoY
- -2.3%
- Active inventory
- 60
- Price-to-rent
- 3.7×
Monthly cashflow live
- Estimated rent
- $1,464 medium interval (Pro) →
- Mortgage (P&I)
- −$337
- Tax est. 1.5%
- −$80 /mo · $963/yr
- Insurance
- −$27
- HOA
- −$0
- Vacancy / Maint / Mgmt
- −$307
- Net cashflow
- $713
Break-even live
UW: 25.0% down · 7.5% · 30yr · 1.5% tax · 5.0% vac · 8.0% maint · 8.0% mgmt
Financing live
Cash to close
- Down payment
- $16,050
- Closing costs
- $1,926
- Reserves months
- —
- Total cash needed
- —
Loan-product check · same deal, 3 products live
Conventional
25% down · 7.5% · 30yr
- Down + closing
- —
- Monthly P&I
- —
- Monthly cashflow
- —
- DSCR
- —
- Eligible?
- —
Personal DTI + credit; lowest rate.
DSCR
20% down · 8.5% · 30yr
- Down + closing
- —
- Monthly P&I
- —
- Monthly cashflow
- —
- DSCR
- —
- Eligible?
- —
No personal income docs; deal must DSCR.
Hard money
10% down · 12.0% · 12mo
- Down + closing
- —
- Monthly P&I
- —
- Monthly cashflow
- —
- DSCR
- —
- Eligible?
- —
Short-term bridge; refi at stabilization.
Rent comps 3 comps
| Address | Beds | Baths | Sqft | Rent | $/sqft | DOM | Units | Dist |
|---|---|---|---|---|---|---|---|---|
| 6706 N Dysart Rd Glendale, AZ | 1.0–2.0 | 1.0–2.0 | 727 | $1,439 | $1.98 | 1d | 42 | 0.50mi |
| 12303 W Vista Ave Glendale, AZ | 1.0 | 1.0 | 700 | $1,600 | $2.29 | 43d | 1 | 0.88mi |
| 13621 W Glendale Ave Glendale, AZ | 2.0–3.0 | 1.0–2.0 | 1279 | $1,195 | $0.93 | 1d | 13 | 1.04mi |
Listing history 40 events
-
2026-06-18days on market $64,200 Active 287 DOM
-
2026-06-17days on market $64,200 Active 286 DOM
-
2026-06-16days on market $64,200 Active 285 DOM
-
2026-06-15days on market $64,200 Active 284 DOM
-
2026-06-13pricedays on market $64,200 Active 282 DOM
-
2026-06-09days on market $69,050 Active 278 DOM
-
2026-06-08days on market $69,050 Active 277 DOM
-
2026-06-07days on market $69,050 Active 276 DOM
-
2026-06-04days on market $69,050 Active 273 DOM
-
2026-06-03days on market $69,050 Active 272 DOM
-
2026-06-02days on market $69,050 Active 271 DOM
-
2026-06-01days on market $69,050 Active 270 DOM
-
2026-05-31days on market $69,050 Active 269 DOM
-
2026-04-25price $69,100
-
2026-04-01price $69,200
-
2026-03-02price $69,500
-
2025-12-30price $74,200
-
2025-11-13price $79,100
-
2025-10-31price $79,200
-
2025-09-04$79,500 Active
-
2025-06-06historical
-
2025-01-13$85,000 Active
-
2024-12-16historical
-
2024-09-25price $74,900
-
2024-08-14$75,000 Active
-
2024-05-28status Active
-
2024-05-17status Pending
-
2024-05-17historical
-
2024-05-06price $85,000
-
2024-02-19$65,000 Active
-
2023-11-20status Active
-
2023-11-10status Pending
-
2023-11-10historical
-
2023-11-04price $55,000
-
2023-09-12$56,000 Active
-
2023-07-06status Active
-
2023-07-03status Pending
-
2023-07-03historical
-
2023-06-26price $65,000
-
2023-03-03$66,000 Active
ⓘ Source: listings_history table (triggers on properties + properties_extension) + one-shot
backfill from property_details.listing_events for pre-trigger history.
Climate risk First Street
- Flood 1/10 Low FEMA zone X (shaded) · 0% chance over 30 yrs
- Wildfire 4/10 Moderate
- Heat 9/10 Extreme 7 d/yr ≥113°F today · 19 d/yr by 30 yrs out
- Wind 1/10 Low
- Air quality 1/10 Low 0 unhealthy d/yr today · 0 by 30 yrs out
Nearby sold comps map
Loading sold comps map…
Walkable amenities ~0.75 mi
Loading nearby amenities…
Taxation est. · year 1
- Rental income
- $17,565
- − Mortgage interest
- −$3,596
- − Property taxes
- −$963
- − Insurance
- −$321
- − Repairs & maintenance
- −$1,405
- − Management
- −$1,405
- − Depreciation
- −$1,868
- Taxable income
- $8,006
- Est. tax owed @ 24.0%
- −$1,922
- After-tax cash flow
- $6,630/yr
For passive investors: Depreciation is non-cash, so a rental often shows a tax loss while cash-flowing — sheltering income. Rental losses are passive: they offset passive income freely, and up to $25,000/yr can offset ordinary (W-2) income if you actively participate and your MAGI is under $100k (phasing out to $0 by $150k); unused losses carry forward. On sale, claimed depreciation is recaptured at up to 25%, and gains may owe capital-gains tax (a 1031 exchange can defer both). Figures are a year-1 estimate at your 24.0% rate — not tax advice; consult a CPA.
Schools (NCES district)
- District
- Agua Fria Union High School District (4289)
- NCES district ID
- 0400450
- Math proficiency
- 24% ▼ -32.00%
- Reading proficiency
- 37% ▼ -12.00%
- Median HH income
- $64,107
- Composite
- 27.92/100
- National rank
- #6865
- State rank
- #99 of 249 in AZ
Livability — Glendale
- Score
- 76/100
- State rank
- #12
- US rank
- #3235
Category grades
Schools grade is shown separately in the Schools card above.
Census & demographics
- County
- Maricopa County · 4,537,380 people
- City population
- 294,586
- Metro
- Phoenix-Mesa-Chandler, AZ
- Population (ZIP)
- 14,223
- Household income
- $82,888
- Rent vs Own
- Severe rent burden
- 637.0
Population outlook (Maricopa County) Hauer SSP2
- Today (2025)
- 4,979,203 people
- By 2030
- 5,378,229 · +8.0%
- By 2040
- 6,156,598 · +23.6%
- By 2050
- 6,872,376 · +38.0%
- By 2075
- 8,401,270 · +68.7%
- By 2100
- 9,247,439 · +85.7%
Race, ethnicity, and origin ACS 2023
- Neighborhood character
- Diverse neighborhood (Simpson 0.66)
- Race & ethnicity
- White 41% Hispanic / Latino 39% Two or more races 18% Black 12% Asian 3% Native American 2%
- Hispanic origin (detail)
- Mexican 37%
- Common ancestry
- Portuguese 2% Italian 1% Lithuanian 1%
- Foreign-born
- 15% · Canada, Vietnam
- Languages at home
- 73% English-only · Spanish 21% Other Asian/Pacific 1% Tagalog/Filipino 1%
Political lean MEDSL · Maricopa
- 2024 margin
- Toss-up / Even · D 47.7% · R 51.2% · Other 1.1%
- 2008→2024 swing
- +7.1pp toward D · 2008: -10.6pp · 2024: -3.5pp
- All cycles
- 2024: R+3.5 2020: D+2.2 2016: R+3.5 2012: R+12.0 2008: R+10.6
Not yet ingested
- Civics
- —
Market trends
- HPI YoY
- ▼ -59.55%
- Current HPI
- 320.364
- Rent YoY
- ▼ -2.33%
- Metro
- Phoenix-Mesa-Chandler, AZ
- State GDP YoY
- ▲ 4.54%
- F500 in state
- 20
Industry mix (Fortune 500 HQ in AZ)
| Industry | F500 HQs | Revenue |
|---|---|---|
| Technology | 2 | $13B |
|
||
| Mining / Metals | 1 | $23B |
|
||
| Environmental Services | 1 | $16B |
|
||
| Metals / Steel | 1 | $14B |
|
||
| Technology Distribution | 1 | $9B |
|
||
| Homebuilding | 1 | $8B |
|
||
Price history
+4.7% since first listed27 events — show timeline
- 2026-04-25 Price Changed $69,100 ARMLS
- 2026-04-01 Price Changed $69,200 ARMLS
- 2026-03-02 Price Changed $69,500 ARMLS
- 2025-12-30 Price Changed $74,200 ARMLS
- 2025-11-13 Price Changed $79,100 ARMLS
- 2025-10-31 Price Changed $79,200 ARMLS
- 2025-09-04 Listed $79,500 ARMLS
- 2025-06-06 Listing Removed — ARMLS
- 2025-01-13 Listed $85,000 ARMLS
- 2024-12-16 Listing Removed — ARMLS
- 2024-09-25 Price Changed $74,900 ARMLS
- 2024-08-14 Listed $75,000 ARMLS
- 2024-05-28 Relisted — ARMLS
- 2024-05-17 Pending — ARMLS
- 2024-05-17 Listing Removed — ARMLS
- 2024-05-06 Price Changed $85,000 ARMLS
- 2024-02-19 Listed $65,000 ARMLS
- 2023-11-20 Relisted — ARMLS
- 2023-11-10 Pending — ARMLS
- 2023-11-10 Listing Removed — ARMLS
- 2023-11-04 Price Changed $55,000 ARMLS
- 2023-09-12 Listed $56,000 ARMLS
- 2023-07-06 Relisted — ARMLS
- 2023-07-03 Pending — ARMLS
- 2023-07-03 Listing Removed — ARMLS
- 2023-06-26 Price Changed $65,000 ARMLS
- 2023-03-03 Listed $66,000 ARMLS
Cash-flow waterfall
monthlySold comps — $/sqft
last 12 mo · ≤1 miLoading sold comps…