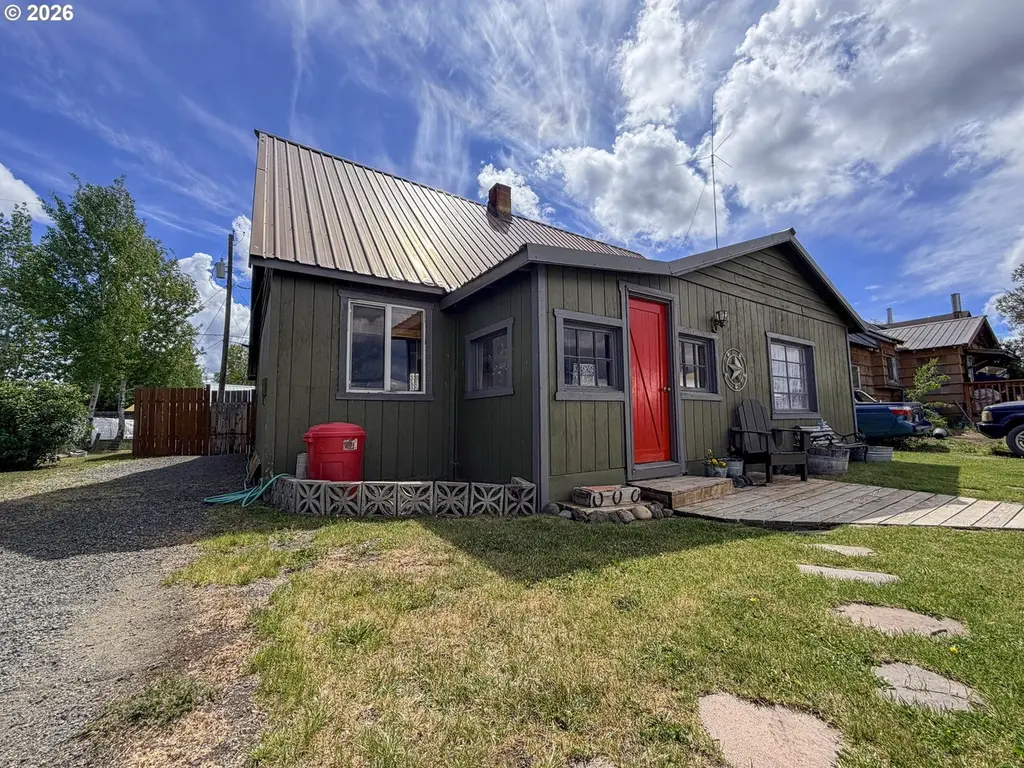
312 Park Ave · Seneca, OR
Flood risk 7/10 · Major
- FEMA flood zone
- X (unshaded)
- Chance of flooding over 30 yrs
- 0.78%
- Est. flood insurance / yr
- $507 – $1,088
Fire risk 8/10 · Major
- Est. fire insurance / yr
- $498 – $926
Heat risk 2/10 · Minimal
- Hot days now (above 88°F)
- 7 days/yr
- Hot days in 30 yrs
- 17 days/yr
Wind risk 1/10 · Minimal
- Chance of severe wind over 30 yrs
- —
Air-quality risk 6/10 · Moderate
- Unhealthy air days now
- 7 days/yr
- Unhealthy air days in 30 yrs
- 9 days/yr
Risk factors via First Street. Map © Google.
Why this score? — see what drove the D+ grade
The composite is a weighted blend of 9 inputs, each scored 0–100. Each bar is that input's sub-score; the figure is the points it added to the 100-point composite (weight × sub-score).
- Cash flow +14.7/30.0
- ARV discount +7.5/15.0
- Appreciation +5.0/10.0
- DSCR +4.5/10.0
- Schools +3.4/10.0
- Livability +3.2/5.0
- 1% rule +2.8/10.0
- Rent growth +2.5/5.0
- Condition / age +2.5/5.0
$149,000
🖨 Deal sheet (PDF) 📄 Offer letter ✓ Due diligence
Listing remarks MLS
Looking for a getaway property or hunting cabin? Located in Seneca, Oregon, just minutes from National Forest access, this property is an ideal basecamp for hunting, fishing, ATV riding, and outdoor recreation. The seller is including most furnishings and personal property shown in the photos, making it easy to start enjoying right away. The home offers 1,284 sq ft with 3 bedrooms, a non-conforming 4th bedroom, and 1 bathroom. The main level is 822 sq ft with an additional 462 sq ft upstairs. Features include an oil monitor stove, wood stove, wood cabinetry, laminate countertops, included kitchen appliances, wood and vinyl flooring, and a metal roof. Enclosed front and back porches provide excellent storage for gear and firewood. Situated on a 0.11-acre lot with a fenced backyard, fenced rear parking, and additional on- and off-street parking. Come make memories in Seneca.
Key facts
- Affordable basecamp
- Getaway property
- Hunting cabin
Tags
Property features AI
Finance
- Other: Lot in the 3,000 to 4,999 sq ft range (level parcel)
Exterior
- Parking: Driveway parking; RV parking available
- Utilities: Public water; Public sewer; Fiber optic internet available; Fuel: oil and wood burning
- Home design: Single-family residence; Residential property; Not attached to another unit; Resale property; Main and upper levels (split across two levels); Entry faces unspecified
- Construction: Pillar/post/pier and stem wall foundation; Building area recorded as 1,284 (assessor)
- Exterior features: Metal roof; T-111 siding; Tool shed and workshop; Yard; Level lot; Paved road access; Mountain views
Interior
- Kitchen: Free-standing range; Free-standing refrigerator
- Bedrooms: Primary bedroom on main level; Second bedroom on main level; Third bedroom on upper level; Bonus room on upper level
- Flooring: Vinyl floors; Wood floors
- Bathrooms: One full bathroom (main level)
- Heating & cooling: Oil-fired stove and wood stove heating; No central air conditioning
- Interior features: Ceiling fans; Vinyl and wood flooring; One wood-burning stove fireplace; Vinyl and wood window frames; Crawl space foundation access
- Laundry & utility: Electric hot water
Neighborhood map
What this means for you Summary
Snapshot
- This is a 3-bed/1.0-bath single-family listed at $149k.
Deal economics
- At list price, monthly cash flow is $-29 ($-349/yr) — negative.
- To cash-flow at today's rent, offer at most $144k (3.4% below list).
- To meet the 1% rule (rent ≥ 1% of price), the offer needs to be $116k (22.5% below list).
- Recommended offer: $116k (22.5% below list) — sets the bar for 1% rule.
Location & tenants
- Location reads 63/100 on livability (#237 in OR) — a middle-class / working-renter tenant base. Strengths: cost of living A+, housing A+; Watch: employment C-, health & safety C-, crime F.
- John Day SD 3 (rural): math 31% / reading 50% proficiency, ranked #16 of 58 in OR (top 28%) — families likely to look elsewhere, expect single-tenant / working-renter base with shorter leases.
- Zoned schools: Seneca Elementary School (math 24% / reading 24%, 12 students, 33% FRL); Grant Union Junior/Senior High School (math 22% / reading 52%, grade F, #85 of 143 statewide, top 61%, 216 students, 40% FRL) — zoned schools at 37% FRL track the district average.
- Market conditions: 10 active listings in the ZIP; 9 units permitted in Grant County in 2024 (0 in 5+ unit buildings).
Forward outlook
- In year one you build about $6k of equity ($1k loan paydown + $4k appreciation (3.0% local appreciation)).
- Grant County population projected at -29% by 2050 — secular population decline; favor cash flow + early exit over multi-decade hold.
- At projected returns (3.0% appreciation + 3.0% rent growth), your $42k cash investment doubles in ~7 years — after that, you're playing with house money.
- By year 7, paydown + projected appreciation supports a ~$35k cash-out refi (75% LTV) — recoverable capital for the next deal without selling this one.
Negotiation context
- It's been on market 15 days — a 2% lower offer ($147k) is reasonable based on typical stale-listing flexibility.
- 2 sale attempts with the ask held roughly flat each time — persistent listings suggest the price (not the market) is what's stuck; bring a comps-based counter.
Risks & watch-outs
- Watch-outs: flood insurance adds $66/mo.
- Climate carrying-cost: major flood risk; severe wildfire risk — expect insurance premiums to compound above CPI over the hold.
Questions for the listing agent
- What do current leases actually rent for vs. the listed asking? Can we see a recent rent roll and the last 12 months of T-12 income?
- What's the actual annual flood-insurance premium (NFIP or private), and is the property in a SFHA with mandatory coverage?
- Is there a deadline driving the sale (1031 exchange, divorce, estate, relocation)? That informs how much negotiation room exists.
- Schools are D-rated, which usually means shorter tenancies and higher turnover. Who's the typical renter profile here, and what's been the actual vacancy rate?
- Crime grade is F in this area — have there been break-ins, vandalism, or insurance claims at this property in the last 3 years? What carrier currently insures it and at what premium?
- The area grade is low — what's the realistic commute time and amenity access for the typical tenant pool here? Any planned neighborhood developments (good or bad) we should know about?
- What's the average days-on-market for RENTAL listings here right now (not sales)? A rising rental-DOM trend means longer vacancies and softer asking-rent achievability than the comps imply.
- What's the recent tenant-quality profile in this submarket — average credit score on applications, eviction rate, late-payment / NSF rate, and stable-employment percentage? A property-management company in the area should have these aggregated.
- How much new for-sale + rental construction is in the pipeline within 1–3 miles? Heavy new supply typically softens prices + rents 12–24 months out; constrained supply supports both.
Investment metrics
- 1% rule
- 0.78% ✗
- Cap rate
- 6.59%
- Cash-on-cash
- 1.08%
- DSCR
- 1.05
- GRM
- 10.7
CMA / ARV
- ARV (on-the-fly)
- $347,964
- Comps found
- 2
Show comp detail 2 sales within ~0.75 mi
| Address | Dist | Beds/Ba | Sqft | Sold | Price | $/sf | Match |
|---|---|---|---|---|---|---|---|
| 104 Park Ave | 0.18mi | 2/1.0 (-1) | 1,252 (-2%) | 8mo | $339,000 | $271 | 76 |
| 108/110 Park Ave | 0.16mi | 2/2.0 (-1) | 1,464 (+14%) | 1mo | $270,000 | $184 | 59 |
Match score weights: distance 35% · size 25% · config 20% · recency 20%. Top-matched comps best support the ARV.
Projected returns pro-forma
3.0% appreciation · 3.0% rent growth · sell at horizon
- IRR
- 6.7%
- Equity multiple
- 1.38×
- Total profit
- $16,061
- Equity at exit
- $66,997
- IRR
- 9.5%
- Equity multiple
- 2.43×
- Total profit
- $59,745
- Equity at exit
- $103,250
Cash invested: $41,720 (down + closing). Projections, not guarantees.
Landlord ↔ Tenant lean methodology
- Overall (STATE)
- 28 Tenant-Leaning
- State Oregon
- 28 Tenant-Leaning · D+6
- County
- — inherits STATE
- City
- — inherits STATE
ZIP-level market 97873
- Active inventory
- 10
- Price-to-rent
- 10.7×
Monthly cashflow live
- Estimated rent
- $1,155 medium interval (Pro) →
- Mortgage (P&I)
- −$781
- Tax from tax record
- −$32 /mo · $383/yr
- Insurance
- −$62
- Flood insurance flood zone
- −$66 /mo · $798/yr
- HOA
- −$0
- Vacancy / Maint / Mgmt
- −$243
- Net cashflow
- $-29
Break-even live
Sensitivity live
| Price | -10% $55 | -5% $13 | +0% $-29 | +5% $-71 | +10% $-113 |
|---|---|---|---|---|---|
| Rent | -10% $-120 | -5% $-75 | +0% $-29 | +5% $17 | +10% $62 |
| Rate | -1.0pp $46 | -0.5pp $9 | base $-29 | +0.5pp $-68 | +1.0pp $-107 |
UW: 25.0% down · 7.5% · 30yr · 1.5% tax · 5.0% vac · 8.0% maint · 8.0% mgmt
Financing live
Cash to close
- Down payment
- $37,250
- Closing costs
- $4,470
- Reserves months
- —
- Total cash needed
- —
Loan-product check · same deal, 3 products live
Conventional
25% down · 7.5% · 30yr
- Down + closing
- —
- Monthly P&I
- —
- Monthly cashflow
- —
- DSCR
- —
- Eligible?
- —
Personal DTI + credit; lowest rate.
DSCR
20% down · 8.5% · 30yr
- Down + closing
- —
- Monthly P&I
- —
- Monthly cashflow
- —
- DSCR
- —
- Eligible?
- —
No personal income docs; deal must DSCR.
Hard money
10% down · 12.0% · 12mo
- Down + closing
- —
- Monthly P&I
- —
- Monthly cashflow
- —
- DSCR
- —
- Eligible?
- —
Short-term bridge; refi at stabilization.
Listing history 13 events
-
2026-06-21days on market $149,000 Active 15 DOM
-
2026-06-21days on market $149,000 Active 14 DOM
-
2026-06-18days on market $149,000 Active 12 DOM
-
2026-06-17days on market $149,000 Active 11 DOM
-
2026-06-16days on market $149,000 Active 10 DOM
-
2026-06-15days on market $149,000 Active 9 DOM
-
2026-06-13days on market $149,000 Active 7 DOM
-
2026-06-12statusdays on market $149,000 Active 6 DOM
-
2026-06-04statusdays on market $149,000 Pending 4 DOM
-
2026-06-02days on market $149,000 Active 3 DOM
-
2026-06-01days on market $149,000 Active 2 DOM
-
2026-05-31remarks 699-char remark
-
2026-05-31$149,000 Active 1 DOM
ⓘ Source: listings_history table (triggers on properties + properties_extension) + one-shot
backfill from property_details.listing_events for pre-trigger history.
Tax reassessment forecast OR · Resets to sale price
- Current annual tax
- $383 · $32/mo
- Projected year-2 tax
- $1,445 · $120/mo
- Expected delta
- +$1,062/yr (+$89/mo · 277.3%)
ⓘ Screening estimate from a state-policy table — verify with the county assessor before closing.
Climate risk First Street
- Flood 7/10 Severe FEMA zone X (unshaded) · 78% chance over 30 yrs
- Wildfire 8/10 Severe
- Heat 2/10 Low 7 d/yr ≥88°F today · 17 d/yr by 30 yrs out
- Wind 1/10 Low
- Air quality 6/10 Major 7 unhealthy d/yr today · 9 by 30 yrs out
Nearby sold comps map
Loading sold comps map…
Walkable amenities ~0.75 mi
Loading nearby amenities…
Taxation est. · year 1
- Rental income
- $13,865
- − Mortgage interest
- −$8,346
- − Property taxes
- −$383
- − Insurance
- −$1,542
- − Repairs & maintenance
- −$1,109
- − Management
- −$1,109
- − Depreciation
- −$4,335
- Taxable loss
- −$2,960
- Est. tax savings @ 24.0%
- +$710
- After-tax cash flow
- $362/yr
For passive investors: Depreciation is non-cash, so a rental often shows a tax loss while cash-flowing — sheltering income. Rental losses are passive: they offset passive income freely, and up to $25,000/yr can offset ordinary (W-2) income if you actively participate and your MAGI is under $100k (phasing out to $0 by $150k); unused losses carry forward. On sale, claimed depreciation is recaptured at up to 25%, and gains may owe capital-gains tax (a 1031 exchange can defer both). Figures are a year-1 estimate at your 24.0% rate — not tax advice; consult a CPA.
Schools (NCES district)
- District
- John Day SD 3
- NCES district ID
- 4106780
- Math proficiency
- 31% ▼ -2.00%
- Reading proficiency
- 50% ▼ -8.00%
- Median HH income
- $39,007
- Composite
- 33.78/100
- National rank
- #5366
- State rank
- #16 of 58 in OR
Livability — Seneca
- Score
- 63/100
- State rank
- #237
- US rank
- #16089
Category grades
Schools grade is shown separately in the Schools card above.
Census & demographics
- Census place
- Seneca, OR
- Population (ZIP)
- 119
Population outlook (Grant County) Hauer SSP2
- Today (2025)
- 6,485 people
- By 2030
- 6,060 · -6.6%
- By 2040
- 5,222 · -19.5%
- By 2050
- 4,581 · -29.4%
- By 2075
- 3,578 · -44.8%
- By 2100
- 2,756 · -57.5%
Race, ethnicity, and origin ACS 2023
- Neighborhood character
- Predominantly White (82%)
- Race & ethnicity
- White 82% Two or more races 15% Hispanic / Latino 7% Native American 3%
- Hispanic origin (detail)
- Mexican 7%
- Common ancestry
- Serbian 9% Slovak 8% Iranian 6%
Political lean MEDSL · Grant
- 2024 margin
- Solid R (+60.4) · D 18.4% · R 78.8% · Other 2.8%
- 2008→2024 swing
- -14.9pp toward R · 2008: -45.5pp · 2024: -60.4pp
- All cycles
- 2024: R+60.4 2020: R+56.9 2016: R+58.9 2012: R+53.3 2008: R+45.5
Not yet ingested
- Civics
- —
Market trends
- HPI YoY
- —
- Current HPI
- —
- Rent YoY
- —
- Metro
- —
- State GDP YoY
- ▲ 2.05%
- F500 in state
- 2
Industry mix (Fortune 500 HQ in OR)
| Industry | F500 HQs | Revenue |
|---|---|---|
| Consumer Goods | 1 | $51B |
|
||
Price history
+0.0% since first listed2 events — show timeline
- 2026-05-30 Listed $149,000 MLSCO
- 2026-05-30 Listed $149,000 RMLS
Property tax history
+2.7%/yrLatest (2025): $383 · +3.0% YoY. Source: county tax records.
Cash-flow waterfall
monthlySold comps — $/sqft
last 12 mo · ≤1 miLoading sold comps…