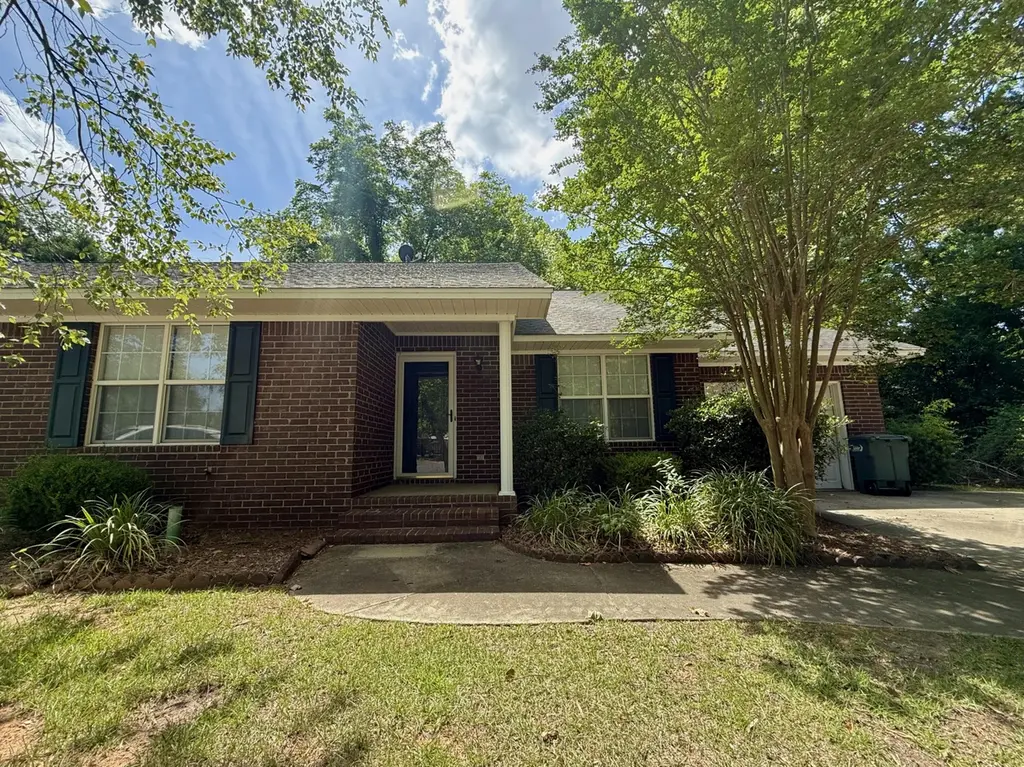
1961 Essex Dr · Sumter, SC
Flood risk No data
- FEMA flood zone
- —
- Chance of flooding over 30 yrs
- —
- Est. flood insurance / yr
- —
Fire risk No data
- Est. fire insurance / yr
- —
Heat risk No data
- Hot days now (above threshold)
- —
- Hot days in 30 yrs
- —
Wind risk No data
- Chance of severe wind over 30 yrs
- —
Air-quality risk No data
- Unhealthy air days now
- —
- Unhealthy air days in 30 yrs
- —
Risk factors via First Street. Map © Google.
Why this score? — see what drove the D grade
The composite is a weighted blend of 9 inputs, each scored 0–100. Each bar is that input's sub-score; the figure is the points it added to the 100-point composite (weight × sub-score).
- ARV discount +15.0/15.0
- Cash flow +9.2/30.0
- Rent growth +3.5/5.0
- Livability +3.0/5.0
- DSCR +2.6/10.0
- Condition / age +2.5/5.0
- 1% rule +2.4/10.0
- Schools +1.9/10.0
- Appreciation +0.0/10.0
$179,900
🖨 Deal sheet (PDF) 📄 Offer letter ✓ Due diligence
Listing remarks MLS
Two-2 BR/2 Baths w/ LR/DR/Deck One w/ sun room (One w/ o both have decks on the back-One w/ garage, one w/ o. 1961 has 1131 ft 1965 has 1501 ft.
Key facts
- Low maintenance yard
- Flex space
- Backyard deck
Tags
Property features AI
Exterior
- Parking: Detached or attached garage not specified — 1 garage space
- Utilities: Public water; Public sewer
- Home design: Duplex; One level
- Construction: Brick construction; Shingle roof; Slab foundation; Built as a residential single-family residence
- Exterior features: Deck; No additional exterior features listed; No fencing
Interior
- Kitchen: Dishwasher; Range
- Flooring: Carpet; Vinyl
- Bathrooms: 2 full bathrooms
- Heating & cooling: Central air; Heat pump heating and cooling; Electric heating
- Interior features: Pantry
- Laundry & utility: Washer hookup; Electric dryer hookup
Neighborhood map
What this means for you Summary
Snapshot
- This is a 2-bed/2.0-bath single-family listed at $180k.
Deal economics
- At list price, monthly cash flow is $-136 ($-2k/yr) — negative.
- To cash-flow at today's rent, offer at most $156k (13.4% below list).
- To meet the 1% rule (rent ≥ 1% of price), the offer needs to be $134k (25.7% below list).
- Recommended offer: $134k (25.7% below list) — sets the bar for 1% rule.
- Cap rate 5.4% vs local median 3.4% in Sumter — top-decile yield for the area; either an underpriced asset or a hidden risk that comps aren't pricing in. Stress-test before assuming the spread holds.
Location & tenants
- Location reads 59/100 on livability (#235 in SC) — a working-class tenant base; expect higher turnover. Strengths: cost of living A+, health & safety A+, housing A-; Watch: crime F, amenities F, commute F.
- Sumter 01 (urban): math 18% / reading 28% proficiency, ranked #64 of 80 in SC (top 80%) — low school quality limits family demand, transient renter base, plan for 1-2y turnover; 64% free/reduced lunch — lower-income household profile, screen leases tightly.
- Zoned schools: Millwood Elementary (math 41% / reading 41%, grade F, #276 of 597 statewide, top 48%, 682 students, 100% FRL); Bates Middle (math 9% / reading 21%, grade F, #202 of 229 statewide, top 89%, 569 students, 100% FRL); Sumter High School (math 22% / reading 67%, grade F, #166 of 196 statewide, top 87%, 2,289 students, 100% FRL) — zoned schools average 100% FRL vs 64% district-wide (36 pts higher); higher-poverty schools than district average — tighter screening recommended.
- Market conditions: Rents rising fast (+4.2%/yr); 238 active listings in the ZIP; 386 units permitted in Sumter County in 2024 (0 in 5+ unit buildings).
Forward outlook
- Local home prices are declining (-3.0%/yr); year-one equity from $1k of loan paydown is wiped out by about $5k of value loss. Plan a longer hold.
- Sumter County population projected at -14% by 2050 — secular population decline; favor cash flow + early exit over multi-decade hold.
Negotiation context
- Only 7 days on market — expect competitive offers; lowballing is unlikely to land.
- 2 sale attempts with the ask held roughly flat each time — persistent listings suggest the price (not the market) is what's stuck; bring a comps-based counter.
- Current owner paid $93k; list at $180k implies a 93% gain — meaningful room to come down on a strong offer.
Questions for the listing agent
- What do current leases actually rent for vs. the listed asking? Can we see a recent rent roll and the last 12 months of T-12 income?
- Is there a deadline driving the sale (1031 exchange, divorce, estate, relocation)? That informs how much negotiation room exists.
- Schools are D-rated, which usually means shorter tenancies and higher turnover. Who's the typical renter profile here, and what's been the actual vacancy rate?
- Crime grade is F in this area — have there been break-ins, vandalism, or insurance claims at this property in the last 3 years? What carrier currently insures it and at what premium?
- The area grade is low — what's the realistic commute time and amenity access for the typical tenant pool here? Any planned neighborhood developments (good or bad) we should know about?
- What's the average days-on-market for RENTAL listings here right now (not sales)? A rising rental-DOM trend means longer vacancies and softer asking-rent achievability than the comps imply.
- What's the recent tenant-quality profile in this submarket — average credit score on applications, eviction rate, late-payment / NSF rate, and stable-employment percentage? A property-management company in the area should have these aggregated.
- How much new for-sale + rental construction is in the pipeline within 1–3 miles? Heavy new supply typically softens prices + rents 12–24 months out; constrained supply supports both.
Investment metrics
- 1% rule
- 0.74% ✗
- Cap rate
- 5.38%
- Cash-on-cash
- -3.25%
- DSCR
- 0.86
- GRM
- 11.2
CMA / ARV
- ARV (on-the-fly)
- $232,655
- Comps found
- 12
Show comp detail 12 sales within ~0.75 mi
| Address | Dist | Beds/Ba | Sqft | Sold | Price | $/sf | Match |
|---|---|---|---|---|---|---|---|
| 176 Curtiswood Ave | 0.38mi | 3/2.0 (+1) | 1,486 (-1%) | 3mo | $185,000 | $124 | 73 |
| 80 Abbey Hall Ct | 0.42mi | 3/2.0 (+1) | 1,511 (+1%) | 4mo | $210,000 | $139 | 71 |
| 342 Acorn St | 0.36mi | 3/3.0 (+1) | 1,515 (+1%) | 5mo | $235,000 | $155 | 68 |
| 360 Acorn St | 0.35mi | 3/3.0 (+1) | 1,515 (+1%) | 6mo | $254,900 | $168 | 68 |
| 2125 Stillpointe Dr Dr | 0.40mi | 3/3.0 (+1) | 1,515 (+1%) | 4mo | $230,000 | $152 | 67 |
| 118 Henrietta St | 0.26mi | 3/2.0 (+1) | 1,675 (+12%) | 4mo | $150,000 | $90 | 60 |
| 375 Conifer St | 0.42mi | 3/2.0 (+1) | 1,367 (-9%) | 2mo | $211,000 | $154 | 59 |
| 1807 Millwood Rd | 0.62mi | 3/2.0 (+1) | 1,426 (-5%) | 0mo | $185,000 | $130 | 58 |
| 2115 Stillpointe Dr | 0.40mi | 3/2.0 (+1) | 1,299 (-14%) | 2mo | $225,000 | $173 | 53 |
| 372 Acorn St | 0.33mi | 3/2.0 (+1) | 1,299 (-14%) | 6mo | $210,000 | $162 | 52 |
| 370 Acorn St | 0.34mi | 3/2.0 (+1) | 1,299 (-14%) | 6mo | $210,000 | $162 | 52 |
| 352 Conifer St | 0.45mi | 3/2.0 (+1) | 1,299 (-14%) | 2mo | $212,000 | $163 | 50 |
Match score weights: distance 35% · size 25% · config 20% · recency 20%. Top-matched comps best support the ARV.
Projected returns pro-forma
-3.0% appreciation · 4.19% rent growth · sell at horizon
- IRR
- -20.5%
- Equity multiple
- 0.28×
- Total profit
- $-36,230
- Equity at exit
- $26,824
- IRR
- -11.4%
- Equity multiple
- 0.29×
- Total profit
- $-35,969
- Equity at exit
- $15,554
Cash invested: $50,372 (down + closing). Projections, not guarantees.
Landlord ↔ Tenant lean methodology
- Overall (STATE)
- 90 Strongly Landlord-Friendly
- State South Carolina
- 90 Strongly Landlord-Friendly · R+6
- County
- — inherits STATE
- City
- — inherits STATE
ZIP-level market 29154
- Home prices YoY
- -32.7%
- Rents YoY
- 4.2%
- Active inventory
- 238
- Price-to-rent
- 11.2×
Monthly cashflow live
- Estimated rent
- $1,337 medium interval (Pro) →
- Mortgage (P&I)
- −$943
- Tax from tax record
- −$174 /mo · $2,090/yr
- Insurance
- −$75
- HOA
- −$0
- Vacancy / Maint / Mgmt
- −$281
- Net cashflow
- $-136
Break-even live
Sensitivity live
| Price | -10% $-35 | -5% $-85 | +0% $-136 | +5% $-187 | +10% $-238 |
|---|---|---|---|---|---|
| Rent | -10% $-242 | -5% $-189 | +0% $-136 | +5% $-84 | +10% $-31 |
| Rate | -1.0pp $-46 | -0.5pp $-91 | base $-136 | +0.5pp $-183 | +1.0pp $-230 |
UW: 25.0% down · 7.5% · 30yr · 1.5% tax · 5.0% vac · 8.0% maint · 8.0% mgmt
Financing live
Cash to close
- Down payment
- $44,975
- Closing costs
- $5,397
- Reserves months
- —
- Total cash needed
- —
Loan-product check · same deal, 3 products live
Conventional
25% down · 7.5% · 30yr
- Down + closing
- —
- Monthly P&I
- —
- Monthly cashflow
- —
- DSCR
- —
- Eligible?
- —
Personal DTI + credit; lowest rate.
DSCR
20% down · 8.5% · 30yr
- Down + closing
- —
- Monthly P&I
- —
- Monthly cashflow
- —
- DSCR
- —
- Eligible?
- —
No personal income docs; deal must DSCR.
Hard money
10% down · 12.0% · 12mo
- Down + closing
- —
- Monthly P&I
- —
- Monthly cashflow
- —
- DSCR
- —
- Eligible?
- —
Short-term bridge; refi at stabilization.
Listing history 10 events
-
2026-06-03status $179,900 Pending 7 DOM
-
2026-06-02days on market $179,900 Active 7 DOM
-
2026-06-01days on market $179,900 Active 6 DOM
-
2026-05-31days on market $179,900 Active 5 DOM
-
2026-05-30days on market $179,900 Active 4 DOM
-
2026-05-26$179,900 Active
-
2025-05-22historical $1,395
-
2025-05-14price $1,395
-
2025-05-09$1,450
-
2021-05-05soldstatus $93,000 144-char remark
Show marketing remark (144 chars)
Two-2 BR/2 Baths w/ LR/DR/Deck One w/ sun room (One w/ o both have decks on the back-One w/ garage, one w/ o. 1961 has 1131 ft 1965 has 1501 ft.
ⓘ Source: listings_history table (triggers on properties + properties_extension) + one-shot
backfill from property_details.listing_events for pre-trigger history.
Tax reassessment forecast SC · Resets to sale price
- Current annual tax
- $2,090 · $174/mo
- Projected year-2 tax
- $2,090 · $174/mo
- Expected delta
- $0/yr ($0/mo · 0.0%)
ⓘ Screening estimate from a state-policy table — verify with the county assessor before closing.
Nearby sold comps map
Loading sold comps map…
Walkable amenities ~0.75 mi
Loading nearby amenities…
Taxation est. · year 1
- Rental income
- $16,043
- − Mortgage interest
- −$10,077
- − Property taxes
- −$2,090
- − Insurance
- −$900
- − Repairs & maintenance
- −$1,283
- − Management
- −$1,283
- − Depreciation
- −$5,233
- Taxable loss
- −$4,824
- Est. tax savings @ 24.0%
- +$1,158
- After-tax cash flow
- $-479/yr
For passive investors: Depreciation is non-cash, so a rental often shows a tax loss while cash-flowing — sheltering income. Rental losses are passive: they offset passive income freely, and up to $25,000/yr can offset ordinary (W-2) income if you actively participate and your MAGI is under $100k (phasing out to $0 by $150k); unused losses carry forward. On sale, claimed depreciation is recaptured at up to 25%, and gains may owe capital-gains tax (a 1031 exchange can defer both). Figures are a year-1 estimate at your 24.0% rate — not tax advice; consult a CPA.
Schools (NCES district)
- District
- Sumter 01
- NCES district ID
- 4503902
- Math proficiency
- 18% ▼ -13.00%
- Reading proficiency
- 28% ▼ -6.00%
- Median HH income
- $40,423
- Composite
- 19.45/100
- National rank
- #8775
- State rank
- #64 of 80 in SC
Livability — Sumter
- Score
- 59/100
- State rank
- #235
- US rank
- #19754
Category grades
Schools grade is shown separately in the Schools card above.
Census & demographics
- Census place
- Sumter, SC
- County
- Sumter County · 76,912 people
- City population
- 67,992
- Metro
- Sumter, SC
- Population (ZIP)
- 29,454
- Household income
- $62,772
- Rent vs Own
- Severe rent burden
- 338.0
Population outlook (Sumter County) Hauer SSP2
- Today (2025)
- 104,585 people
- By 2030
- 102,282 · -2.2%
- By 2040
- 96,258 · -8.0%
- By 2050
- 89,592 · -14.3%
- By 2075
- 74,715 · -28.6%
- By 2100
- 60,235 · -42.4%
Race, ethnicity, and origin ACS 2023
- Neighborhood character
- Diverse neighborhood (Simpson 0.59)
- Race & ethnicity
- White 53% Black 36% Two or more races 8% Hispanic / Latino 4% Asian 1%
- Common ancestry
- Italian 2% Serbian 2% Slovak 2%
- Foreign-born
- 2% · Canada
- Languages at home
- 96% English-only · Spanish 2% Tagalog/Filipino 1%
Political lean MEDSL · Sumter
- 2024 margin
- Toss-up / Even · D 51.9% · R 47.0% · Other 1.2%
- 2008→2024 swing
- -10.6pp toward R · 2008: 15.4pp · 2024: 4.9pp
- All cycles
- 2024: D+4.9 2020: D+13.0 2016: D+12.0 2012: D+17.5 2008: D+15.4
Not yet ingested
- Civics
- —
Market trends
- HPI YoY
- ▼ -76.65%
- Current HPI
- 157.8545
- Rent YoY
- ▲ 4.19%
- Metro
- Sumter, SC
- State GDP YoY
- ▲ 4.51%
- F500 in state
- 2
Industry mix (Fortune 500 HQ in SC)
| Industry | F500 HQs | Revenue |
|---|---|---|
| Packaging | 1 | $7B |
|
||
Price history
+93.4% since first listed5 events — show timeline
- 2026-05-26 Listed $179,900 SBOR
- 2025-05-22 Rental Removed $1,395 SBOR
- 2025-05-14 Price Changed $1,395 SBOR
- 2025-05-09 Listed for Rent $1,450 SBOR
- 2021-05-05 Sold (MLS) $93,000 SBOR
Property tax history
+0.3%/yrLatest (2019): $2,090 · -0.5% YoY. Source: county tax records.
Cash-flow waterfall
monthlySold comps — $/sqft
last 12 mo · ≤1 miLoading sold comps…