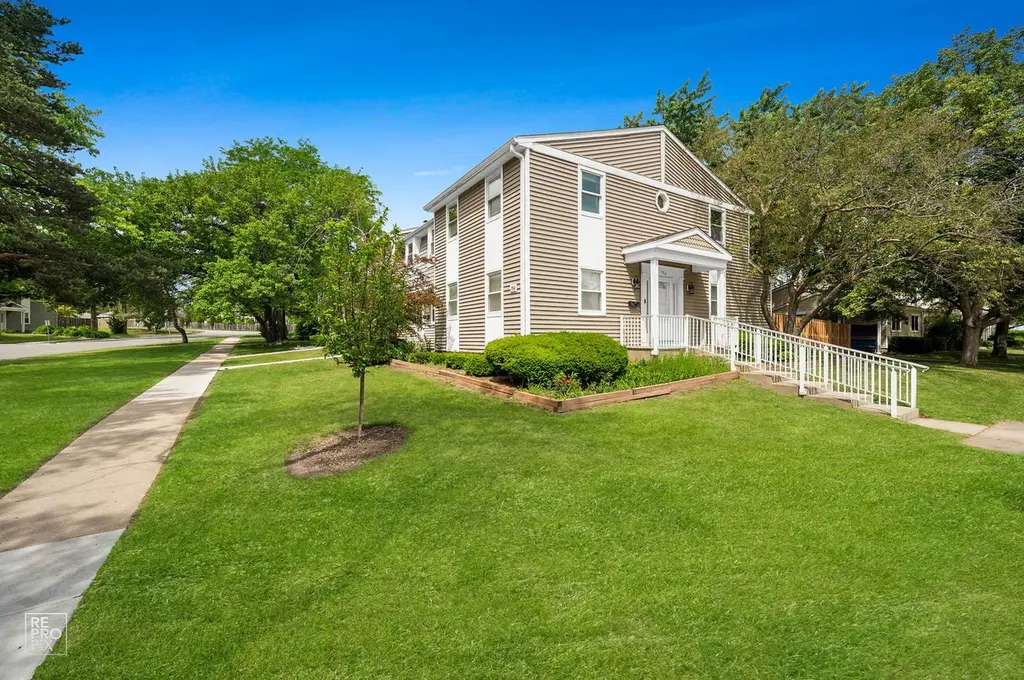
1914 Flintshire Dr #1914 · Schaumburg, IL
Flood risk 1/10 · Minimal
- FEMA flood zone
- X (unshaded)
- Chance of flooding over 30 yrs
- 0.0%
- Est. flood insurance / yr
- $473 – $860
Fire risk 1/10 · Minimal
- Est. fire insurance / yr
- $804 – $1,492
Heat risk 3/10 · Minor
- Hot days now (above 101°F)
- 7 days/yr
- Hot days in 30 yrs
- 14 days/yr
Wind risk 2/10 · Minimal
- Chance of severe wind over 30 yrs
- 0.0%
Air-quality risk 3/10 · Minor
- Unhealthy air days now
- 3 days/yr
- Unhealthy air days in 30 yrs
- 3 days/yr
Risk factors via First Street. Map © Google.
Why this score? — see what drove the D+ grade
The composite is a weighted blend of 9 inputs, each scored 0–100. Each bar is that input's sub-score; the figure is the points it added to the 100-point composite (weight × sub-score).
- ARV discount +14.4/15.0
- Cash flow +12.2/30.0
- Rent growth +4.9/5.0
- 1% rule +4.2/10.0
- Schools +4.0/10.0
- Livability +4.0/5.0
- DSCR +3.6/10.0
- Condition / age +2.5/5.0
- Appreciation +0.0/10.0
$349,900
🖨 Deal sheet (PDF) 📄 Offer letter ✓ Due diligence
Listing remarks MLS
This 3 bedroom 2.1 bath two story unit is in move in condition and features an open layout, assigned parking, fenced backyard, full basement partially finished, new carpet and has been freshly painted throughout. Just minutes from public transportation, expressways and shopping.
Key facts
- Open floor plan
- Spacious cabinetry
- Mudroom with laundry
Tags
Property features AI
Finance
- Other: Part of a 6-unit building; Ownership: Fee simple with homeowners association
- HOA & community: Monthly association fee of $200; HOA covers parking, insurance, pool, exterior maintenance, lawn care, and snow removal; Pets allowed (cats and dogs)
Exterior
- Parking: Assigned parking for 2 vehicles
- Utilities: Water source: Lake Michigan; Public sewer
- Home design: Attached single property; Townhouse — 2 story; Entry level: 1
- Construction: Built 51–60 years ago; Asphalt roof; Not rebuilt or rehabbed
- Exterior features: Aluminum and vinyl siding; Lot dimensions provided
Interior
- Kitchen: Range; Dishwasher; Refrigerator; Stainless steel appliances
- Bedrooms: 3 bedrooms (plus a possible 4th bedroom); 1 bedroom located in the basement; Master bedroom on the second floor
- Flooring: Luxury vinyl flooring in most living areas and bedrooms; Ceramic tile in kitchen and laundry
- Bathrooms: 2 full bathrooms; 1 half bathroom
- Heating & cooling: Natural gas heating; Central air conditioning
- Interior features: Finished full basement; Separate dining room; Some photos virtually staged
- Laundry & utility: In-unit laundry with gas dryer hookup; Utility room in the basement (22 x 8)
Neighborhood map
What this means for you Summary
Snapshot
- This is a 4-bed/2.5-bath townhouse listed at $350k.
Deal economics
- At list price, monthly cash flow is $-70 ($-840/yr) — negative.
- To cash-flow at today's rent, offer at most $340k (2.9% below list).
- To meet the 1% rule (rent ≥ 1% of price), the offer needs to be $323k (7.8% below list).
- Recommended offer: $323k (7.8% below list) — sets the bar for 1% rule.
- Cap rate 6.1% vs local median 3.7% in Schaumburg — top-decile yield for the area; either an underpriced asset or a hidden risk that comps aren't pricing in. Stress-test before assuming the spread holds.
Location & tenants
- Location reads 79/100 on livability (#124 in IL, #2,162 nationally) — a middle-class / working-renter tenant base. Strengths: employment A+, housing A+, crime B+; Watch: health & safety C-, amenities D+, commute F.
- Township Hsd 211 (urban): math 45% / reading 43% proficiency, ranked #89 of 620 in IL (top 14%) — families likely to look elsewhere, expect single-tenant / working-renter base with shorter leases.
- Zoned schools: Neil Armstrong Elem School (math 27% / reading 37%, grade F, #586 of 2,056 statewide, top 31%, 497 students, 0% FRL); Dwight D Eisenhower Jhs (math 36% / reading 51%, grade D, #101 of 665 statewide, top 16%, 617 students, 0% FRL); Hoffman Estates High School (math 39% / reading 36%, grade F, #104 of 693 statewide, top 15%, 2,067 students, 0% FRL).
- Market conditions: Rents rising fast (+9.5%/yr); 33 active listings in the ZIP; 11 comparable units currently listed for rent nearby; rentals leasing fast (median 3d on market — plan ~1-2 weeks tenant-placement turnaround); solid renter incomes; 6,272 units permitted in Cook County in 2024 (4,658 in 5+ unit buildings).
- This rent runs 39% of the median local income ($98k/yr) — at the standard rent-burdened threshold; future hikes will face affordability resistance.
Forward outlook
- Local home prices are declining (-3.0%/yr); year-one equity from $2k of loan paydown is wiped out by about $10k of value loss. Plan a longer hold.
Negotiation context
- It's been on market 16 days — a 2% lower offer ($345k) is reasonable based on typical stale-listing flexibility.
- 3 sale attempts since 10y ago with the ask held roughly flat each time — persistent listings suggest the price (not the market) is what's stuck; bring a comps-based counter.
- Current owner paid $163k; list at $350k implies a 115% gain — meaningful room to come down on a strong offer.
Questions for the listing agent
- What do current leases actually rent for vs. the listed asking? Can we see a recent rent roll and the last 12 months of T-12 income?
- Built in 1972 — when were the roof, HVAC, electrical panel, plumbing, and water heater last replaced?
- What does the HOA fee cover, when was the last increase, and are there any pending special assessments or reserve-fund shortfalls?
- Is there a deadline driving the sale (1031 exchange, divorce, estate, relocation)? That informs how much negotiation room exists.
- Schools are A-rated — typically a magnet for longer-tenancy family renters. What's the average tenant stay here, and is there a school-zone premium baked into asking?
- The area grade is low — what's the realistic commute time and amenity access for the typical tenant pool here? Any planned neighborhood developments (good or bad) we should know about?
- What's the average days-on-market for RENTAL listings here right now (not sales)? A rising rental-DOM trend means longer vacancies and softer asking-rent achievability than the comps imply.
- What's the recent tenant-quality profile in this submarket — average credit score on applications, eviction rate, late-payment / NSF rate, and stable-employment percentage? A property-management company in the area should have these aggregated.
- How much new for-sale + rental construction is in the pipeline within 1–3 miles? Heavy new supply typically softens prices + rents 12–24 months out; constrained supply supports both.
Investment metrics
- 1% rule
- 0.92% ✗
- Cap rate
- 6.05%
- Cash-on-cash
- -0.86%
- DSCR
- 0.96
- GRM
- 9.0
CMA / ARV
- ARV (on-the-fly)
- $413,515
- Comps found
- 11
Show comp detail 11 sales within ~0.75 mi
| Address | Dist | Beds/Ba | Sqft | Sold | Price | $/sf | Match |
|---|---|---|---|---|---|---|---|
| 1766 Pebble Beach Dr | 0.54mi | 3/3.0 (-1) | 2,250 (+4%) | 0mo | $429,000 | $191 | 61 |
| 1719 Westbridge Ct | 0.36mi | 3/1.5 (-1) | 1,969 (-9%) | 10mo | $385,000 | $196 | 50 |
| 1709 Pebble Beach Ct | 0.62mi | 3/3.5 (-1) | 2,250 (+4%) | 10mo | $435,000 | $193 | 47 |
| 1698 Pebble Beach Dr | 0.64mi | 4/3.0 | 2,376 (+10%) | 7mo | $451,500 | $190 | 46 |
| 1121 Southbridge Ln | 0.45mi | 3/2.0 (-1) | 1,851 (-14%) | 7mo | $380,000 | $205 | 42 |
| 1691 Pebble Beach Dr #1691 | 0.68mi | 3/2.5 (-1) | 2,250 (+4%) | 20mo | $382,500 | $170 | 40 |
| 1721 Dumont Ln | 0.29mi | 3/2.0 (-1) | 1,851 (-14%) | 22mo | $431,000 | $233 | 37 |
| 1675 Pebble Beach Dr | 0.73mi | 3/3.0 (-1) | 2,250 (+4%) | 22mo | $373,000 | $166 | 34 |
| 2315 Hamilton Pl | 0.55mi | 3/2.5 (-1) | 1,884 (-13%) | 21mo | $380,000 | $202 | 30 |
| 2187 Seaver Ln | 0.72mi | 3/3.5 (-1) | 2,388 (+10%) | 14mo | $440,000 | $184 | 29 |
| 1654 Pebble Beach Dr | 0.70mi | 4/3.0 | 2,430 (+12%) | 24mo | $425,050 | $175 | 25 |
Match score weights: distance 35% · size 25% · config 20% · recency 20%. Top-matched comps best support the ARV.
Projected returns pro-forma
-3.0% appreciation · 8.0% rent growth · sell at horizon
- IRR
- -11.8%
- Equity multiple
- 0.55×
- Total profit
- $-43,943
- Equity at exit
- $52,171
- IRR
- 3.9%
- Equity multiple
- 1.35×
- Total profit
- $34,269
- Equity at exit
- $30,253
Cash invested: $97,972 (down + closing). Projections, not guarantees.
Landlord ↔ Tenant lean methodology
- Overall (STATE)
- 43 Moderately Tenant-Leaning
- State Illinois
- 43 Moderately Tenant-Leaning · D+7
- County
- — inherits STATE
- City
- — inherits STATE
ZIP-level market 60194
- Rents YoY
- 9.5%
- Active inventory
- 33
- Price-to-rent
- 9.0×
Monthly cashflow live
- Estimated rent
- $3,225 high interval (Pro) →
- Mortgage (P&I)
- −$1,835
- Tax est. 1.5%
- −$437 /mo · $5,248/yr
- Insurance
- −$146
- HOA
- −$200
- Vacancy / Maint / Mgmt
- −$677
- Net cashflow
- $-70
Break-even live
Sensitivity live
| Price | -10% $172 | -5% $51 | +0% $-70 | +5% $-191 | +10% $-312 |
|---|---|---|---|---|---|
| Rent | -10% $-325 | -5% $-197 | +0% $-70 | +5% $57 | +10% $185 |
| Rate | -1.0pp $106 | -0.5pp $19 | base $-70 | +0.5pp $-161 | +1.0pp $-253 |
UW: 25.0% down · 7.5% · 30yr · 1.5% tax · 5.0% vac · 8.0% maint · 8.0% mgmt
Financing live
Cash to close
- Down payment
- $87,475
- Closing costs
- $10,497
- Reserves months
- —
- Total cash needed
- —
Loan-product check · same deal, 3 products live
Conventional
25% down · 7.5% · 30yr
- Down + closing
- —
- Monthly P&I
- —
- Monthly cashflow
- —
- DSCR
- —
- Eligible?
- —
Personal DTI + credit; lowest rate.
DSCR
20% down · 8.5% · 30yr
- Down + closing
- —
- Monthly P&I
- —
- Monthly cashflow
- —
- DSCR
- —
- Eligible?
- —
No personal income docs; deal must DSCR.
Hard money
10% down · 12.0% · 12mo
- Down + closing
- —
- Monthly P&I
- —
- Monthly cashflow
- —
- DSCR
- —
- Eligible?
- —
Short-term bridge; refi at stabilization.
Rent comps 11 comps
| Address | Beds | Baths | Sqft | Rent | $/sqft | DOM | Units | Dist |
|---|---|---|---|---|---|---|---|---|
| 1817 Altoona Ct Schaumburg, IL | 3.0 | 2.0 | 2146 | $3,000 | $1.40 | 26d | 1 | 0.12mi |
| 1964 Crescent Ln Hoffman Estates, IL | 3.0 | 2.0 | 1532 | $3,500 | $2.28 | 3d | 1 | 0.74mi |
| 1829 Quaker Hollow Ln #1829 Streamwood, IL | 3.0 | 2.0 | 1427 | $2,550 | $1.79 | 0d | 1 | 0.80mi |
| 2164 Seaver Ln Unit 2164 Hoffman Estates, IL | 3.0 | 3.5 | 1862 | $2,950 | $1.58 | 0d | 1 | 0.80mi |
| 276 Continental Ln Schaumburg, IL | 4.0 | 2.5 | 2000 | $3,500 | $1.75 | 12d | 1 | 0.81mi |
| 2350 County Farm Ln Schaumburg, IL | 3.0 | 2.5 | 1600 | $3,890 | $2.43 | 24d | 1 | 0.89mi |
| 1355 Blair Ln Hoffman Estates, IL | 3.0 | 2.0 | 1680 | $3,250 | $1.93 | 26d | 1 | 0.92mi |
| 1800 Autumn Dr Hoffman Estates, IL | 3.0 | 1.0–2.0 | 1029 | $3,535 | $3.43 | 0d | 31 | 1.05mi |
| 1540 Edgefield Ln Hoffman Estates, IL | 4.0 | 2.0 | 2000 | $2,995 | $1.50 | 0d | 1 | 1.08mi |
| 110 Thistle Ct Schaumburg, IL | 3.0 | 2.5 | 1628 | $3,500 | $2.15 | 4d | 1 | 1.14mi |
| 2404 Kenmore Ct Schaumburg, IL | 3.0 | 2.5 | 1763 | $3,800 | $2.16 | 0d | 1 | 1.34mi |
HOA detail
- Monthly dues
- $200 · $2,400/yr
- Likely covers
- parking
Listing history 12 events
-
2026-06-21days on market $349,900 Active 16 DOM
-
2026-06-18days on market $349,900 Active 13 DOM
-
2026-06-17days on market $349,900 Active 12 DOM
-
2026-06-16days on market $349,900 Active 11 DOM
-
2026-06-15days on market $349,900 Active 10 DOM
-
2026-06-13days on market $349,900 Active 8 DOM
-
2026-06-13remarks 683-char remark
-
2026-06-13days on market $349,900 Active 7 DOM
-
2026-06-09days on market $349,900 Active 4 DOM
-
2026-06-08days on market $349,900 Active 3 DOM
-
2026-06-07remarks 620-char remark
-
2026-06-07$349,900 Active 2 DOM
ⓘ Source: listings_history table (triggers on properties + properties_extension) + one-shot
backfill from property_details.listing_events for pre-trigger history.
Climate risk First Street
- Flood 1/10 Low FEMA zone X (unshaded) · 0% chance over 30 yrs
- Wildfire 1/10 Low
- Heat 3/10 Moderate 7 d/yr ≥101°F today · 14 d/yr by 30 yrs out
- Wind 2/10 Low 0% chance of damaging wind over 30 yrs
- Air quality 3/10 Moderate 3 unhealthy d/yr today · 3 by 30 yrs out
Nearby sold comps map
Loading sold comps map…
Walkable amenities ~0.75 mi
Loading nearby amenities…
Taxation est. · year 1
- Rental income
- $38,704
- − Mortgage interest
- −$19,600
- − Property taxes
- −$5,248
- − Insurance
- −$1,750
- − Repairs & maintenance
- −$3,096
- − Management
- −$3,096
- − HOA
- −$2,400
- − Depreciation
- −$10,179
- Taxable loss
- −$6,665
- Est. tax savings @ 24.0%
- +$1,600
- After-tax cash flow
- $759/yr
For passive investors: Depreciation is non-cash, so a rental often shows a tax loss while cash-flowing — sheltering income. Rental losses are passive: they offset passive income freely, and up to $25,000/yr can offset ordinary (W-2) income if you actively participate and your MAGI is under $100k (phasing out to $0 by $150k); unused losses carry forward. On sale, claimed depreciation is recaptured at up to 25%, and gains may owe capital-gains tax (a 1031 exchange can defer both). Figures are a year-1 estimate at your 24.0% rate — not tax advice; consult a CPA.
Schools (NCES district)
- District
- Township Hsd 211
- NCES district ID
- 1730450
- Math proficiency
- 45% ▼ -8.00%
- Reading proficiency
- 43% ▼ -4.00%
- Median HH income
- $72,942
- Composite
- 40.02/100
- National rank
- #3824
- State rank
- #89 of 620 in IL
Livability — Schaumburg
- Score
- 79/100
- State rank
- #124
- US rank
- #2162
Category grades
Schools grade is shown separately in the Schools card above.
Census & demographics
- Census place
- Schaumburg, IL
- County
- Cook County · 4,486,803 people
- City population
- 77,949
- Metro
- Chicago-Naperville-Elgin, IL-IN-WI
- Population (ZIP)
- 19,756
- Household income
- $97,994
- Rent vs Own
- Severe rent burden
- 475.0
Population outlook (Cook County) Hauer SSP2
- Today (2025)
- 5,347,519 people
- By 2030
- 5,357,703 · +0.2%
- By 2040
- 5,324,924 · -0.4%
- By 2050
- 5,230,762 · -2.2%
- By 2075
- 4,785,735 · -10.5%
- By 2100
- 4,188,836 · -21.7%
Race, ethnicity, and origin ACS 2023
- Neighborhood character
- Diverse neighborhood (Simpson 0.65)
- Race & ethnicity
- White 51% Asian 26% Hispanic / Latino 11% Black 8% Two or more races 8%
- Hispanic origin (detail)
- Mexican 8% Puerto Rican 1%
- Common ancestry
- Romanian 9% Slovak 2% Iranian 2%
- Foreign-born
- 32% · Canada, South Korea, China
- Languages at home
- 60% English-only · Other Indo-European 13% Spanish 9% Russian/Polish/Slavic 6%
Political lean MEDSL · Cook
- 2024 margin
- Solid D (+42.0) · D 70.4% · R 28.4% · Other 1.2%
- 2008→2024 swing
- -11.4pp toward R · 2008: 53.4pp · 2024: 42.0pp
- All cycles
- 2024: D+42.0 2020: D+50.3 2016: D+53.0 2012: D+49.4 2008: D+53.4
Not yet ingested
- Civics
- —
Market trends
- HPI YoY
- ▼ -262.90%
- Current HPI
- 210.9605
- Rent YoY
- ▲ 9.50%
- Metro
- Chicago-Naperville-Elgin, IL-IN-WI
- State GDP YoY
- ▲ 1.59%
- F500 in state
- 60
Industry mix (Fortune 500 HQ in IL)
| Industry | F500 HQs | Revenue |
|---|---|---|
| Insurance | 4 | $201B |
|
||
| Consumer Goods | 4 | $87B |
|
||
| Industrial Machinery | 3 | $64B |
|
||
| Healthcare | 2 | $55B |
|
||
| Retail / Pharmacy | 1 | $148B |
|
||
| Agriculture / Food | 1 | $86B |
|
||
Price history
+94.5% since first listed7 events — show timeline
- 2026-06-05 Listed $349,900 MRED as Distributed by MLS Grid
- 2017-01-23 Sold (MLS) $163,000 MRED as Distributed by MLS Grid
- 2016-12-07 Pending — MRED as Distributed by MLS Grid
- 2016-11-21 Price Changed $164,000 MRED as Distributed by MLS Grid
- 2016-11-08 Relisted — MRED as Distributed by MLS Grid
- 2016-09-26 Pending — MRED as Distributed by MLS Grid
- 2016-08-26 Listed $179,900 MRED as Distributed by MLS Grid
Cash-flow waterfall
monthlySold comps — $/sqft
last 12 mo · ≤1 miLoading sold comps…