273 Revere · Newport Beach, CA
Flood risk 1/10 · Minimal
- FEMA flood zone
- X (unshaded)
- Chance of flooding over 30 yrs
- 0.0%
- Est. flood insurance / yr
- $507 – $1,088
Fire risk 1/10 · Minimal
- Est. fire insurance / yr
- $659 – $1,223
Heat risk 5/10 · Moderate
- Hot days now (above 82°F)
- 7 days/yr
- Hot days in 30 yrs
- 23 days/yr
Wind risk 1/10 · Minimal
- Chance of severe wind over 30 yrs
- —
Air-quality risk 4/10 · Minor
- Unhealthy air days now
- 6 days/yr
- Unhealthy air days in 30 yrs
- 6 days/yr
Risk factors via First Street. Map © Google.
Why this score? — see what drove the D+ grade
The composite is a weighted blend of 9 inputs, each scored 0–100. Each bar is that input's sub-score; the figure is the points it added to the 100-point composite (weight × sub-score).
- Cash flow +13.9/30.0
- Appreciation +10.0/10.0
- Schools +4.8/10.0
- DSCR +4.2/10.0
- 1% rule +3.9/10.0
- Livability +3.8/5.0
- Rent growth +3.5/5.0
- Condition / age +2.5/5.0
- ARV discount +0.0/15.0
$595,000
🖨 Deal sheet 📄 Offer letter ✓ Due diligence
Listing remarks
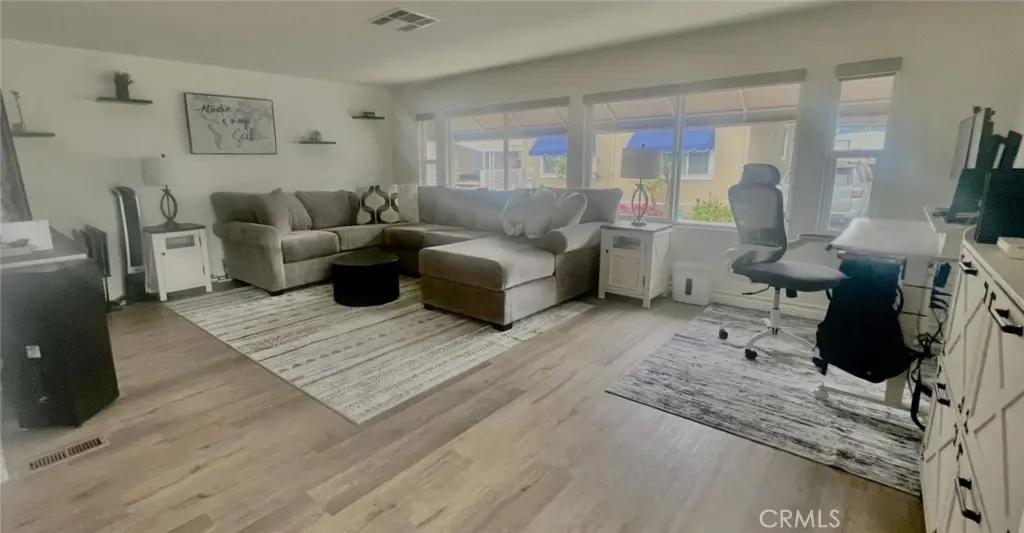
Great unique corner location with an updated and remodeled home in Bayside Village near Back Bay in the heart of Newport Beach. The home sits on a very special corner lot which allows for a large patio deck plus a yard area with artificial grass and easy maintenance and 2 car parking with rear and carport side vinyl fencing. The carport has a custom made metal sliding gate to close off the carport as well as a sliding gate to close off the yard and extra parking area if needed. Inside is a light and bright great room with remodeled kitchen and a dining area. The great room windows have a large custom canopy on the exterior. Down the hall is a large master suite with remodeled bathroom and a
Key facts
- Corner location
- Remodeled kitchen
- Artificial grass
Tags
Property features AI
Finance
- Other: Association provides trash and sewer services
- Financial info: Land lease (current): $3,300 monthly; Rent includes trash, water and sewer
- HOA & community: Community amenities: pool, spa, clubhouse, gym/exercise room, sport court, dock, picnic area, outdoor cooking / barbecue area, fire pit, banquet facilities, meeting/banquet/card rooms, billiard room; Community features include watersports, biking, street lighting and park; Park name: Bayside Village; Manager approval required; Pets allowed: dogs and cats (breed restrictions)
Exterior
- Parking: Attached carport (1 space); Additional parking space (1 total)
- Security: Smoke detector; Resident manager
- Utilities: 220V electric throughout; Natural gas available; Public / district water; Public sewer (sewer paid); Cable available; Electricity connected; Water connected; Sewer connected
- Home design: Single-story; Entry on side; Faces west; Updated / remodeled; Mobile home remains (20' x 52'); Has view; Marina in community; Corner lot, level with street, landscaped
- Construction: Wood, glass and drywall construction; Pier jacks foundation
- Exterior features: Covered and open patio; Rain gutters; Exterior lighting; Patio; In-ground fenced community pool with lap lanes; heated; Wood skirt
Interior
- Kitchen: Remodeled kitchen; Gas cooktop; Built-in range; Dishwasher; Garbage disposal; Pots & pan drawers; Gas water heater
- Bedrooms: Primary suite
- Flooring: Laminated flooring
- Bathrooms: 2 full bathrooms; Remodeled bathrooms; Stone counters; Linen closet / storage; Shower
- Heating & cooling: Central furnace
- Interior features: Built-ins; High ceilings (9+ feet); Track lighting; Ceiling fan; Living room deck attached; Recessed lighting; Open floor plan; Storage space; Stone counters / granite counters; Sliding glass door(s); Double pane windows; Skylights; Blinds; Custom window coverings; No interior steps; Smoke detector; Resident manager; In-ground community heated spa
- Laundry & utility: Washer hookup; Gas dryer hookup
Neighborhood map
What this means for you Summary
Snapshot
- This is a 2-bed/2.0-bath manufactured listed at $595k.
Deal economics
- At list price, monthly cash flow is $65 ($777/yr) — positive.
- The deal already cash-flows at list — no discount required.
- To meet the 1% rule (rent ≥ 1% of price), the offer needs to be $529k (11.1% below list).
- Recommended offer: $529k (11.1% below list) — sets the bar for 1% rule.
- Cap rate 6.4% vs local median 0.6% in Newport Beach — top-decile yield for the area; either an underpriced asset or a hidden risk that comps aren't pricing in. Stress-test before assuming the spread holds.
Location & tenants
- Location reads 76/100 on livability (#101 in CA, #3,645 nationally) — a middle-class / working-renter tenant base. Strengths: amenities A+, employment A+, commute A; Watch: health & safety C-, cost of living F.
- Newport-Mesa Unified (urban): math 46% / reading 58% proficiency, ranked #106 of 517 in CA (top 20%) — acceptable for families but not a draw, mixed tenant base, ~2y average lease.
- Zoned schools: Corona Del Mar High (math 55% / reading 63%, grade C+, #221 of 1,170 statewide, top 19%, 2,059 students, 20% FRL) — zoned schools average 20% FRL vs 40% district-wide (20 pts lower); this property's tenant base skews higher-income than the district average.
- Market conditions: Rents rising fast (+4.1%/yr); 154 active listings in the ZIP; 40 comparable units currently listed for rent nearby; rentals lingering (median 44d on market — plan ~5-8 weeks vacancy on turnover, expect pricing pressure); 52% of comp listings sitting > 30 days — soft ceiling on asking rent; high-income renter base; 6,974 units permitted in Orange County in 2024 (3,839 in 5+ unit buildings).
- This rent runs 40% of the median local income ($160k/yr) — at the standard rent-burdened threshold; future hikes will face affordability resistance.
Forward outlook
- In year one you build about $64k of equity ($4k loan paydown + $60k appreciation (10.0% local appreciation)).
- Orange County population projected at +14% by 2050 — modest demand growth; plan on rents tracking national, not racing it.
- At projected returns (10.0% appreciation + 4.1% rent growth), your $167k cash investment doubles in ~3 years — after that, you're playing with house money.
- By year 2, paydown + projected appreciation supports a ~$102k cash-out refi (75% LTV) — recoverable capital for the next deal without selling this one.
Negotiation context
- It's been on market 33 days — a 3% lower offer ($577k) is reasonable based on typical stale-listing flexibility.
Risks & watch-outs
- Climate carrying-cost: extreme-heat days projected 7→23/yr by 2055 (HVAC capex compounding) — expect insurance premiums to compound above CPI over the hold.
Questions for the listing agent
- It's been on market 33 days. Have you received any prior offers? Is the seller open to a 11% concession, seller financing, or rate buy-down credit?
- Built in 1965 — when were the roof, HVAC, electrical panel, plumbing, and water heater last replaced?
- Is there a deadline driving the sale (1031 exchange, divorce, estate, relocation)? That informs how much negotiation room exists.
- Schools are A-rated — typically a magnet for longer-tenancy family renters. What's the average tenant stay here, and is there a school-zone premium baked into asking?
- The area grade is low — what's the realistic commute time and amenity access for the typical tenant pool here? Any planned neighborhood developments (good or bad) we should know about?
- What's the average days-on-market for RENTAL listings here right now (not sales)? A rising rental-DOM trend means longer vacancies and softer asking-rent achievability than the comps imply.
- What's the recent tenant-quality profile in this submarket — average credit score on applications, eviction rate, late-payment / NSF rate, and stable-employment percentage? A property-management company in the area should have these aggregated.
- How much new for-sale + rental construction is in the pipeline within 1–3 miles? Heavy new supply typically softens prices + rents 12–24 months out; constrained supply supports both.
Investment metrics
- 1% rule
- 0.89% ✗
- Cap rate
- 6.42%
- Cash-on-cash
- 0.47%
- DSCR
- 1.02
- GRM
- 9.4
CMA / ARV
- ARV (on-the-fly)
- $464,880
- Comps found
- 12
Show comp detail 12 sales within ~0.75 mi
| Address | Dist | Beds/Ba | Sqft | Sold | Price | $/sf | Match |
|---|---|---|---|---|---|---|---|
| 265 Mayflower | 0.05mi | 2/2.0 | 1,100 (+6%) | 0mo | $370,000 | $336 | 88 |
| 208 Tremont Dr | 0.11mi | 2/2.0 | 1,040 (0%) | 16mo | $465,000 | $447 | 82 |
| 312 Concord Ln | 0.03mi | 2/2.0 | 1,000 (-4%) | 14mo | $350,000 | $350 | 80 |
| 205 Tremont Dr | 0.11mi | 3/2.0 (+1) | 1,078 (+4%) | 6mo | $649,000 | $602 | 78 |
| 237 Plymouth Ave | 0.04mi | 3/2.0 (+1) | 1,152 (+11%) | 1mo | $630,000 | $547 | 74 |
| 24 Saratoga #24 | 0.20mi | 2/2.0 | 1,100 (+6%) | 9mo | $850,000 | $773 | 74 |
| 129 Liberty | 0.14mi | 2/2.0 | 1,140 (+10%) | 12mo | $539,000 | $473 | 67 |
| 292 Mayflower Dr | 0.07mi | 2/2.0 | 1,152 (+11%) | 15mo | $415,000 | $360 | 67 |
| 77 Yorktown | 0.17mi | 2/1.0 | 1,150 (+11%) | 5mo | $369,999 | $322 | 66 |
| 122 Yorktown Dr | 0.12mi | 2/2.0 | 1,150 (+11%) | 16mo | $475,000 | $413 | 64 |
| 238 Plymouth Ave | 0.05mi | 3/2.0 (+1) | 1,152 (+11%) | 17mo | $400,000 | $347 | 60 |
| 275 Revere Way | 0.02mi | 3/2.0 (+1) | 1,176 (+13%) | 18mo | $560,000 | $476 | 57 |
Match score weights: distance 35% · size 25% · config 20% · recency 20%. Top-matched comps best support the ARV.
Projected returns pro-forma
10.0% appreciation · 4.11% rent growth · sell at horizon
- IRR
- 25.0%
- Equity multiple
- 3.01×
- Total profit
- $334,228
- Equity at exit
- $536,023
- IRR
- 22.3%
- Equity multiple
- 6.97×
- Total profit
- $993,837
- Equity at exit
- $1,155,954
Cash invested: $166,600 (down + closing). Projections, not guarantees.
Landlord ↔ Tenant lean methodology
- Overall (STATE)
- 18 Strongly Tenant-Friendly
- State California
- 18 Strongly Tenant-Friendly · D+13
- County
- — inherits STATE
- City
- — inherits STATE
ZIP-level market 92660
- Home prices YoY
- 3.4%
- Rents YoY
- 4.1%
- Active inventory
- 154
- Price-to-rent
- 9.4×
Monthly cashflow live
- Estimated rent
- $5,287 high interval (Pro) →
- Mortgage (P&I)
- −$3,120
- Tax est. 1.5%
- −$744 /mo · $8,925/yr
- Insurance
- −$248
- HOA
- −$0
- Vacancy / Maint / Mgmt
- −$1,110
- Net cashflow
- $65
Break-even live
UW: 25.0% down · 7.5% · 30yr · 1.5% tax · 5.0% vac · 8.0% maint · 8.0% mgmt
Financing live
Cash to close
- Down payment
- $148,750
- Closing costs
- $17,850
- Reserves months
- —
- Total cash needed
- —
Loan-product check · same deal, 3 products live
Conventional
25% down · 7.5% · 30yr
- Down + closing
- —
- Monthly P&I
- —
- Monthly cashflow
- —
- DSCR
- —
- Eligible?
- —
Personal DTI + credit; lowest rate.
DSCR
20% down · 8.5% · 30yr
- Down + closing
- —
- Monthly P&I
- —
- Monthly cashflow
- —
- DSCR
- —
- Eligible?
- —
No personal income docs; deal must DSCR.
Hard money
10% down · 12.0% · 12mo
- Down + closing
- —
- Monthly P&I
- —
- Monthly cashflow
- —
- DSCR
- —
- Eligible?
- —
Short-term bridge; refi at stabilization.
Rent comps 40 comps
| Address | Beds | Baths | Sqft | Rent | $/sqft | DOM | Units | Dist |
|---|---|---|---|---|---|---|---|---|
| 94 Yorktown Newport Beach, CA | 2.0 | 2.0 | 1029 | $4,250 | $4.13 | 13d | 1 | 0.16mi |
| 200 Promontory Dr W Newport Beach, CA | 1.0–2.0 | 1.0–2.0 | 1187 | $5,385 | $4.54 | 1d | 25 | 0.27mi |
| 212 Garnet Ave Newport Beach, CA | 2.0 | 2.0 | 791 | $5,900 | $7.46 | 43d | 1 | 0.57mi |
| 113 Emerald Ave Newport Beach, CA | 3.0 | 2.0 | 1200 | $8,000 | $6.67 | 43d | 1 | 0.58mi |
| 120 Garnet Ave Newport Beach, CA | 2.0 | 1.0 | 850 | $5,150 | $6.06 | 43d | 1 | 0.61mi |
| 26 Villa Point Dr Newport Beach, CA | 2.0 | 2.0 | 1410 | $5,000 | $3.55 | 43d | 1 | 0.62mi |
| 216 Agate Ave Unit 1/2 Newport Beach, CA | 1.0 | 1.0 | 767 | $4,000 | $5.22 | 43d | 1 | 0.62mi |
| 314 Ruby Ave Newport Beach, CA | 3.0 | 2.0 | 1500 | $8,000 | $5.33 | 43d | 1 | 0.63mi |
| 320 Sapphire Ave Newport Beach, CA | 2.0 | 2.0 | 1000 | $4,200 | $4.20 | 2d | 1 | 0.65mi |
| 1009 N Bay Front Newport Beach, CA | 3.0 | 2.0 | 1200 | $12,000 | $10.00 | 24d | 1 | 0.65mi |
| 216 Collins Ave Newport Beach, CA | 3.0 | 2.0 | 1200 | $8,000 | $6.67 | 43d | 1 | 0.69mi |
| 308 Coral Ave Newport Beach, CA | 3.0 | 2.0 | 1390 | $12,000 | $8.63 | 43d | 1 | 0.70mi |
| 122 Opal Ave Unit 2 Newport Beach, CA | 2.0 | 1.0 | 700 | $4,750 | $6.79 | 18d | 1 | 0.72mi |
| 1063 Dover Dr Newport Beach, CA | 2.0 | 2.5 | 1152 | $4,900 | $4.25 | 43d | 1 | 0.78mi |
| 208 Villa Point Dr Newport Beach, CA | 1.0 | 1.0 | 774 | $3,490 | $4.51 | 43d | 1 | 0.78mi |
| 232 Villa Point Dr Newport Beach, CA | 1.0 | 1.0 | 851 | $4,350 | $5.11 | 24d | 1 | 0.78mi |
| 320 Villa Point Dr Newport Beach, CA | 2.0 | 2.0 | 1307 | $6,500 | $4.97 | 43d | 1 | 0.78mi |
| 207 E Edgewater Ave Newport Beach, CA | 2.0 | 2.0 | 950 | $9,000 | $9.47 | 20d | 1 | 0.78mi |
| 310 Fernando St #105 Newport Beach, CA | 2.0 | 2.0 | 1325 | $4,700 | $3.55 | 2d | 1 | 0.81mi |
| 310 Fernando St Newport Beach, OS | 2.0 | 2.0 | 1331 | $5,198 | $3.90 | 43d | 3 | 0.81mi |
| 203 Amethyst Ave Newport Beach, CA | 3.0 | 3.0 | 1186 | $6,500 | $5.48 | 43d | 1 | 0.82mi |
| 222 Marine Ave Unit C Newport Beach, CA | 2.0 | 2.0 | 1300 | $5,800 | $4.46 | 43d | 1 | 0.84mi |
| 1510 Abalone Pl Newport Beach, CA | 1.0 | 1.0 | 750 | $3,500 | $4.67 | 43d | 1 | 0.84mi |
| 307 Anade Ave Newport Beach, CA | 2.0 | 2.0 | 1100 | $4,750 | $4.32 | 43d | 1 | 0.86mi |
| 312 Saint Andrews Rd Unit B Newport Beach, CA | 2.0 | 1.0 | 1000 | $4,850 | $4.85 | 43d | 1 | 0.88mi |
| 1728 Bedford Ln Newport Beach, CA | 1.0–2.0 | 1.0–2.0 | 954 | $3,795 | $3.98 | 1d | 2 | 0.88mi |
| 206 Adams St #1 Newport Beach, CA | 3.0 | 3.0 | 1065 | $9,000 | $8.45 | 3d | 1 | 0.90mi |
| 114 Onyx Ave Newport Beach, CA | 3.0 | 2.0 | 1050 | $6,750 | $6.43 | 43d | 1 | 0.90mi |
| 533 Saint Andrews Rd Newport Beach, CA | 2.0 | 1.0 | 980 | $3,800 | $3.88 | 2d | 1 | 0.92mi |
| 1400 Haven Pl Unit 533 Newport Beach, CA | 2.0 | 1.0 | 980 | $3,800 | $3.88 | 2d | 1 | 0.92mi |
| 618 W Balboa Blvd Newport Beach, CA | 2.0 | 1.0 | 780 | $4,195 | $5.38 | 43d | 1 | 0.96mi |
| 880 Irvine Ave Newport Beach, CA | 2.0 | 1.0–2.0 | 704 | $3,179 | $4.51 | 1d | 99 | 0.97mi |
| 2101 E 15th St #8 Newport Beach, CA | 2.0 | 1.5 | 1025 | $4,350 | $4.24 | 43d | 1 | 0.98mi |
| 116 Jade Ave Newport Beach, CA | 2.0 | 1.5 | 1144 | $7,000 | $6.12 | 43d | 1 | 1.04mi |
| 913 W Balboa Blvd Newport Beach, CA | 3.0 | 3.0 | 1423 | $8,500 | $5.97 | 16d | 1 | 1.09mi |
| 913 W Balboa Blvd Unit C Newport Beach, CA | 3.0 | 3.0 | 1423 | $8,500 | $5.97 | 7d | 1 | 1.09mi |
| 1114 W Balboa Blvd Unit 1114 Newport Beach, CA | 2.0 | 1.0 | 800 | $3,850 | $4.81 | 24d | 1 | 1.15mi |
| 5100 Colony Plz Newport Beach, CA | 1.0–2.0 | 1.0–2.0 | 1316 | $6,260 | $4.76 | 2d | 10 | 1.17mi |
| 1144 W Balboa Blvd Unit A1 Newport Beach, CA | 2.0 | 1.0 | 1100 | $6,500 | $5.91 | 24d | 1 | 1.18mi |
| 1144 W Balboa Blvd Unit A Newport Beach, CA | 2.0 | 1.0 | 1100 | $4,750 | $4.32 | 24d | 1 | 1.18mi |
Listing history 15 events
-
2026-06-18days on market $595,000 Active 33 DOM
-
2026-06-17days on market $595,000 Active 32 DOM
-
2026-06-16days on market $595,000 Active 31 DOM
-
2026-06-15days on market $595,000 Active 30 DOM
-
2026-06-13days on market $595,000 Active 28 DOM
-
2026-06-13days on market $595,000 Active 27 DOM
-
2026-06-09days on market $595,000 Active 24 DOM
-
2026-06-08days on market $595,000 Active 23 DOM
-
2026-06-07days on market $595,000 Active 22 DOM
-
2026-06-04days on market $595,000 Active 19 DOM
-
2026-06-03days on market $595,000 Active 18 DOM
-
2026-06-02days on market $595,000 Active 17 DOM
-
2026-06-01days on market $595,000 Active 16 DOM
-
2026-05-31days on market $595,000 Active 15 DOM
-
2026-05-16$595,000 Active
ⓘ Source: listings_history table (triggers on properties + properties_extension) + one-shot
backfill from property_details.listing_events for pre-trigger history.
Climate risk First Street
- Flood 1/10 Low FEMA zone X (unshaded) · 0% chance over 30 yrs
- Wildfire 1/10 Low
- Heat 5/10 Major 7 d/yr ≥82°F today · 23 d/yr by 30 yrs out
- Wind 1/10 Low
- Air quality 4/10 Moderate 6 unhealthy d/yr today · 6 by 30 yrs out
Nearby sold comps map
Loading sold comps map…
Walkable amenities ~0.75 mi
Loading nearby amenities…
Taxation est. · year 1
- Rental income
- $63,444
- − Mortgage interest
- −$33,329
- − Property taxes
- −$8,925
- − Insurance
- −$2,975
- − Repairs & maintenance
- −$5,075
- − Management
- −$5,075
- − Depreciation
- −$17,309
- Taxable loss
- −$9,246
- Est. tax savings @ 24.0%
- +$2,219
- After-tax cash flow
- $2,996/yr
For passive investors: Depreciation is non-cash, so a rental often shows a tax loss while cash-flowing — sheltering income. Rental losses are passive: they offset passive income freely, and up to $25,000/yr can offset ordinary (W-2) income if you actively participate and your MAGI is under $100k (phasing out to $0 by $150k); unused losses carry forward. On sale, claimed depreciation is recaptured at up to 25%, and gains may owe capital-gains tax (a 1031 exchange can defer both). Figures are a year-1 estimate at your 24.0% rate — not tax advice; consult a CPA.
Schools (NCES district)
- District
- Newport-Mesa Unified
- NCES district ID
- 0627240
- Math proficiency
- 46% ▼ -6.00%
- Reading proficiency
- 58% ▼ -5.00%
- Median HH income
- $83,922
- Composite
- 47.64/100
- National rank
- #2248
- State rank
- #106 of 517 in CA
Livability — Newport Beach
- Score
- 76/100
- State rank
- #101
- US rank
- #3645
Category grades
Schools grade is shown separately in the Schools card above.
Census & demographics
- Census place
- Newport Beach, CA
- County
- Orange County · 3,096,323 people
- City population
- 83,845
- Metro
- Los Angeles-Long Beach-Anaheim, CA
- Population (ZIP)
- 34,890
- Household income
- $159,564
- Rent vs Own
- Severe rent burden
- 2633.0
Population outlook (Orange County) Hauer SSP2
- Today (2025)
- 3,477,456 people
- By 2030
- 3,613,117 · +3.9%
- By 2040
- 3,835,945 · +10.3%
- By 2050
- 3,968,736 · +14.1%
- By 2075
- 4,097,053 · +17.8%
- By 2100
- 3,903,633 · +12.3%
Race, ethnicity, and origin ACS 2023
- Neighborhood character
- Predominantly White (74%)
- Race & ethnicity
- White 74% Two or more races 10% Hispanic / Latino 10% Asian 9% Black 1%
- Hispanic origin (detail)
- Mexican 6%
- Common ancestry
- Italian 4% Lithuanian 3% Slovak 3%
- Foreign-born
- 16% · Canada, China, South Korea
- Languages at home
- 81% English-only · Spanish 5% Other Indo-European 5% Chinese 2%
Political lean MEDSL · Orange
- 2024 margin
- Toss-up / Even · D 49.7% · R 47.1% · Other 3.2%
- 2008→2024 swing
- +5.2pp toward D · 2008: -2.6pp · 2024: 2.6pp
- All cycles
- 2024: D+2.6 2020: D+9.0 2016: D+7.7 2012: R+8.3 2008: R+2.6
Not yet ingested
- Civics
- —
Market trends
- HPI YoY
- ▲ 17.65%
- Current HPI
- 537.8751
- Rent YoY
- ▲ 4.11%
- Metro
- Los Angeles-Long Beach-Anaheim, CA
- State GDP YoY
- ▲ 3.21%
- F500 in state
- 116
Industry mix (Fortune 500 HQ in CA)
| Industry | F500 HQs | Revenue |
|---|---|---|
| Technology | 27 | $1,492B |
|
||
| Financial Services | 3 | $174B |
|
||
| Retail | 3 | $44B |
|
||
| Insurance | 3 | $26B |
|
||
| Media / Entertainment | 2 | $115B |
|
||
| Pharmaceuticals / Biotech | 2 | $62B |
|
||
Price history
1 event — show timeline
- 2026-05-16 Listed $595,000 CRMLS
Property tax history
+12.2%/yrLatest (2025): $207 · -0.4% YoY. Source: county tax records.
Cash-flow waterfall
monthlySold comps — $/sqft
last 12 mo · ≤1 miLoading sold comps…