209 L St NE · Ardmore, OK
Flood risk 1/10 · Minimal
- FEMA flood zone
- X (unshaded)
- Chance of flooding over 30 yrs
- 0.0%
- Est. flood insurance / yr
- $507 – $1,088
Fire risk 5/10 · Moderate
- Est. fire insurance / yr
- $2,463 – $4,575
Heat risk 6/10 · Moderate
- Hot days now (above 112°F)
- 7 days/yr
- Hot days in 30 yrs
- 19 days/yr
Wind risk 4/10 · Minor
- Chance of severe wind over 30 yrs
- 11.0%
Air-quality risk 3/10 · Minor
- Unhealthy air days now
- 2 days/yr
- Unhealthy air days in 30 yrs
- 3 days/yr
Risk factors via First Street. Map © Google.
Why this score? — see what drove the C- grade
The composite is a weighted blend of 9 inputs, each scored 0–100. Each bar is that input's sub-score; the figure is the points it added to the 100-point composite (weight × sub-score).
- Cash flow +15.0/30.0
- ARV discount +15.0/15.0
- 1% rule +5.0/10.0
- DSCR +5.0/10.0
- Rent growth +4.3/5.0
- Livability +2.9/5.0
- Condition / age +2.5/5.0
- Schools +1.1/10.0
- Appreciation +0.0/10.0
$28,000
🖨 Deal sheet (PDF) 📄 Offer letter ✓ Due diligence
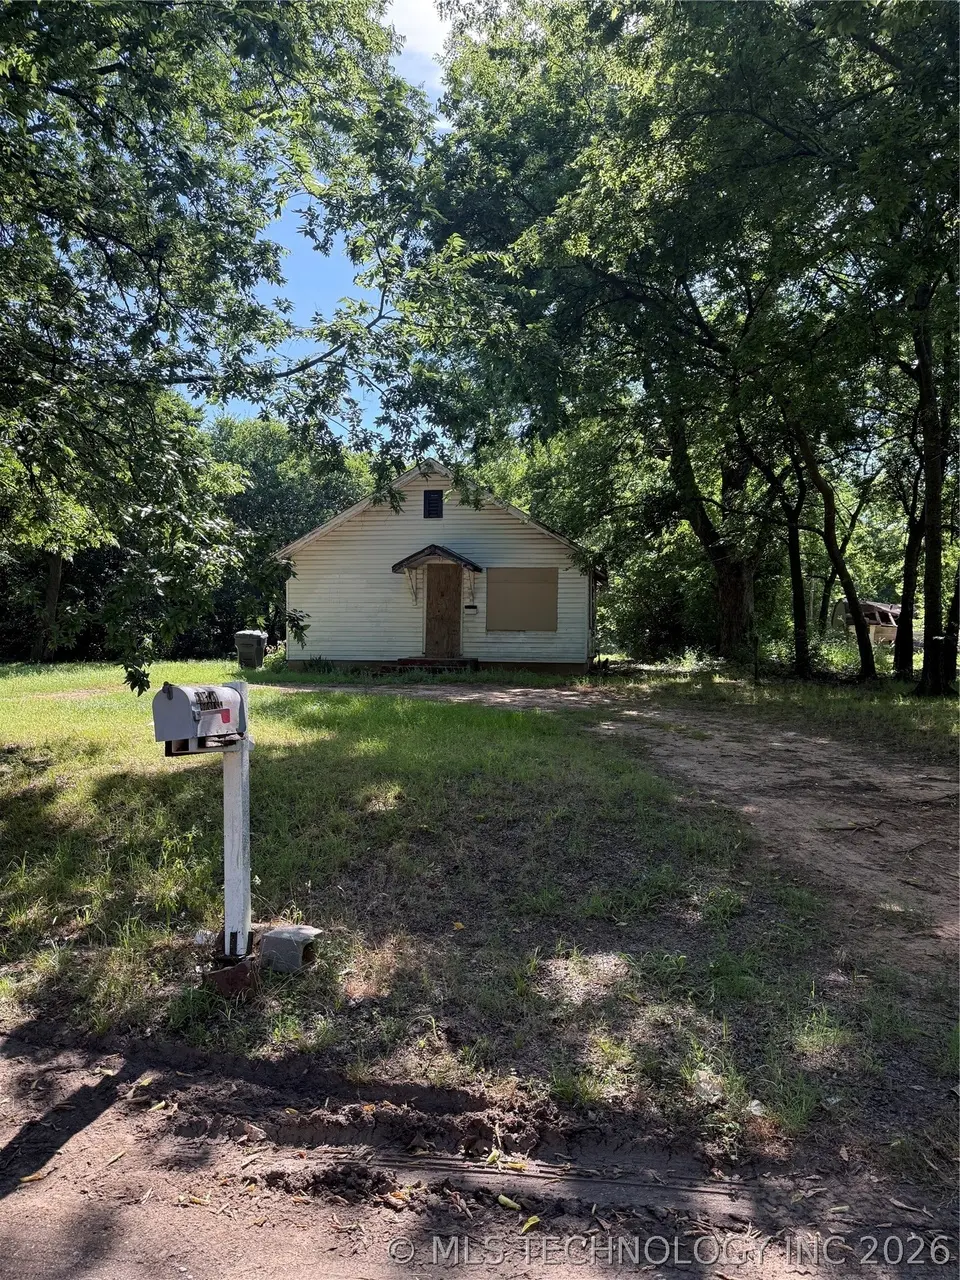
Listing remarks
Attention Investors and Builders! Opportunity awaits on this approximately 0.81-acre lot in Ardmore. Property includes an existing 936 sq. ft. home and is being sold AS-IS, WHERE-IS. Large lots of this size within city limits are becoming increasingly difficult to find. Whether you’re looking for a redevelopment project, investment property, or future building site, this property offers tremendous potential. Buyer to verify all property information, utilities, zoning, and intended use.
Key facts
- 0.81-acre lot
- Existing home
- Investment property
Tags
Property features AI
Exterior
- Security: No safety shelter
- Utilities: Public water; Public sewer; Cable available
- Home design: Single-story home; Faces east; Crawlspace foundation
- Construction: Wood siding with wood frame construction; Asphalt/fiberglass roof
- Exterior features: Fruit trees on the property; No other exterior features listed
Interior
- Flooring: Wood flooring
- Bathrooms: 1 full bathroom
- Interior features: Aluminum frame windows; Ventilation for improved indoor air quality; Wood counters; No additional interior features listed
- Laundry & utility: Gas water heater
Neighborhood map
What this means for you Summary
Snapshot
- This is a 2-bed/1.0-bath single-family listed at $28k.
Deal economics
- At list price, monthly cash flow is $750 ($9k/yr) — positive.
- The deal already cash-flows at list — no discount required.
- Meets the 1% rule at list price ($1k rent vs $28k).
- Recommended offer: $28k (1.5% below list) — sets the bar for market timing.
- Cap rate 38.4% vs local median 4.6% in Ardmore — top-decile yield for the area; either an underpriced asset or a hidden risk that comps aren't pricing in. Stress-test before assuming the spread holds.
Location & tenants
- Location reads 58/100 on livability (#447 in OK) — a working-class tenant base; expect higher turnover. Strengths: cost of living A+, housing A+; Watch: schools F, crime F, amenities F.
- Ardmore (town): math 12% / reading 15% proficiency, ranked #241 of 270 in OK (top 89%) — low school quality limits family demand, transient renter base, plan for 1-2y turnover; 73% free/reduced lunch — lower-income household profile, screen leases tightly.
- Market conditions: Rents rising fast (+7.4%/yr); 379 active listings in the ZIP; 73 units permitted in Carter County in 2024 (0 in 5+ unit buildings).
Forward outlook
- Local home prices are declining (-3.0%/yr); year-one equity from $194 of loan paydown is wiped out by about $840 of value loss. Plan a longer hold.
- Carter County population projected at +9% by 2050 — modest demand growth; plan on rents tracking national, not racing it.
- At projected returns (-3.0% appreciation + 7.4% rent growth), your $8k cash investment doubles in ~1 year — after that, you're playing with house money.
Negotiation context
- It's been on market 16 days — a 2% lower offer ($28k) is reasonable based on typical stale-listing flexibility.
- 4 sale attempts with the ask held roughly flat each time — persistent listings suggest the price (not the market) is what's stuck; bring a comps-based counter.
Risks & watch-outs
- Climate carrying-cost: moderate wildfire risk; extreme-heat days projected 7→19/yr by 2055 (HVAC capex compounding) — expect insurance premiums to compound above CPI over the hold.
Questions for the listing agent
- Built in 1961 — when were the roof, HVAC, electrical panel, plumbing, and water heater last replaced?
- Is there a deadline driving the sale (1031 exchange, divorce, estate, relocation)? That informs how much negotiation room exists.
- Schools are F-rated, which usually means shorter tenancies and higher turnover. Who's the typical renter profile here, and what's been the actual vacancy rate?
- Crime grade is F in this area — have there been break-ins, vandalism, or insurance claims at this property in the last 3 years? What carrier currently insures it and at what premium?
- What's the average days-on-market for RENTAL listings here right now (not sales)? A rising rental-DOM trend means longer vacancies and softer asking-rent achievability than the comps imply.
- What's the recent tenant-quality profile in this submarket — average credit score on applications, eviction rate, late-payment / NSF rate, and stable-employment percentage? A property-management company in the area should have these aggregated.
- How much new for-sale + rental construction is in the pipeline within 1–3 miles? Heavy new supply typically softens prices + rents 12–24 months out; constrained supply supports both.
Investment metrics
- 1% rule
- 4.21% ✓
- Cap rate
- 38.45%
- Cash-on-cash
- 114.84%
- DSCR
- 6.11
- GRM
- 2.0
CMA / ARV
- ARV (on-the-fly)
- $43,992
- Comps found
- 9
Show comp detail 9 sales within ~0.75 mi
| Address | Dist | Beds/Ba | Sqft | Sold | Price | $/sf | Match |
|---|---|---|---|---|---|---|---|
| 206 I St NE | 0.12mi | 2/1.0 | 936 (0%) | 10mo | $98,000 | $105 | 86 |
| 1001 4th Ave NE | 0.14mi | 3/1.0 (+1) | 910 (-3%) | 4mo | $60,000 | $66 | 80 |
| 1103 4th NE | 0.14mi | 2/1.0 | 858 (-8%) | 0mo | $20,000 | $23 | 79 |
| 413 M NE | 0.17mi | 2/1.0 | 808 (-14%) | 5mo | $16,000 | $20 | 65 |
| 733 E Main | 0.33mi | 2/1.0 | 1,016 (+8%) | 12mo | $60,000 | $59 | 60 |
| 1003 NE 8th Ave | 0.41mi | 3/1.5 (+1) | 997 (+6%) | 12mo | $19,500 | $20 | 53 |
| 43 F NE | 0.44mi | 2/1.0 | 1,056 (+13%) | 17mo | $50,000 | $47 | 44 |
| 17 NE F St | 0.47mi | 3/1.0 (+1) | 1,072 (+14%) | 14mo | $15,000 | $14 | 37 |
| 306 G St SE | 0.70mi | 3/2.0 (+1) | 1,032 (+10%) | 9mo | $129,000 | $125 | 34 |
Match score weights: distance 35% · size 25% · config 20% · recency 20%. Top-matched comps best support the ARV.
Projected returns pro-forma
-3.0% appreciation · 7.38% rent growth · sell at horizon
- IRR
- —
- Equity multiple
- 7.21×
- Total profit
- $48,679
- Equity at exit
- $4,175
- IRR
- —
- Equity multiple
- 17.37×
- Total profit
- $128,313
- Equity at exit
- $2,421
Cash invested: $7,840 (down + closing). Projections, not guarantees.
Landlord ↔ Tenant lean methodology
- Overall (STATE)
- 83 Strongly Landlord-Friendly
- State Oklahoma
- 83 Strongly Landlord-Friendly · R+20
- County
- — inherits STATE
- City
- — inherits STATE
ZIP-level market 73401
- Home prices YoY
- -21.7%
- Rents YoY
- 7.4%
- Active inventory
- 379
- Price-to-rent
- 2.0×
Monthly cashflow live
- Estimated rent
- $1,178 medium interval (Pro) →
- Mortgage (P&I)
- −$147
- Tax from tax record
- −$22 /mo · $264/yr
- Insurance
- −$12
- HOA
- −$0
- Vacancy / Maint / Mgmt
- −$247
- Net cashflow
- $750
Break-even live
Sensitivity live
| Price | -10% $766 | -5% $758 | +0% $750 | +5% $742 | +10% $734 |
|---|---|---|---|---|---|
| Rent | -10% $657 | -5% $704 | +0% $750 | +5% $797 | +10% $843 |
| Rate | -1.0pp $764 | -0.5pp $757 | base $750 | +0.5pp $743 | +1.0pp $736 |
UW: 25.0% down · 7.5% · 30yr · 1.5% tax · 5.0% vac · 8.0% maint · 8.0% mgmt
Financing live
Cash to close
- Down payment
- $7,000
- Closing costs
- $840
- Reserves months
- —
- Total cash needed
- —
Loan-product check · same deal, 3 products live
Conventional
25% down · 7.5% · 30yr
- Down + closing
- —
- Monthly P&I
- —
- Monthly cashflow
- —
- DSCR
- —
- Eligible?
- —
Personal DTI + credit; lowest rate.
DSCR
20% down · 8.5% · 30yr
- Down + closing
- —
- Monthly P&I
- —
- Monthly cashflow
- —
- DSCR
- —
- Eligible?
- —
No personal income docs; deal must DSCR.
Hard money
10% down · 12.0% · 12mo
- Down + closing
- —
- Monthly P&I
- —
- Monthly cashflow
- —
- DSCR
- —
- Eligible?
- —
Short-term bridge; refi at stabilization.
Listing history 12 events
-
2026-06-19days on market $28,000 Active 16 DOM
-
2026-06-18days on market $28,000 Active 15 DOM
-
2026-06-17days on market $28,000 Active 14 DOM
-
2026-06-16days on market $28,000 Active 13 DOM
-
2026-06-15days on market $28,000 Active 12 DOM
-
2026-06-14days on market $28,000 Active 10 DOM
-
2026-06-12days on market $28,000 Active 9 DOM
-
2026-06-09days on market $28,000 Active 6 DOM
-
2026-06-08days on market $28,000 Active 5 DOM
-
2026-06-07days on market $28,000 Active 4 DOM
-
2026-06-03remarks 490-char remark
-
2026-06-03$28,000 Active 1 DOM
ⓘ Source: listings_history table (triggers on properties + properties_extension) + one-shot
backfill from property_details.listing_events for pre-trigger history.
Tax reassessment forecast OK · Resets to sale price
- Current annual tax
- $264 · $22/mo
- Projected year-2 tax
- $264 · $22/mo
- Expected delta
- $0/yr ($0/mo · 0.0%)
ⓘ Screening estimate from a state-policy table — verify with the county assessor before closing.
Climate risk First Street
- Flood 1/10 Low FEMA zone X (unshaded) · 0% chance over 30 yrs
- Wildfire 5/10 Major
- Heat 6/10 Major 7 d/yr ≥112°F today · 19 d/yr by 30 yrs out
- Wind 4/10 Moderate 11% chance of damaging wind over 30 yrs
- Air quality 3/10 Moderate 2 unhealthy d/yr today · 3 by 30 yrs out
Nearby sold comps map
Loading sold comps map…
Walkable amenities ~0.75 mi
Loading nearby amenities…
Taxation est. · year 1
- Rental income
- $14,138
- − Mortgage interest
- −$1,568
- − Property taxes
- −$264
- − Insurance
- −$140
- − Repairs & maintenance
- −$1,131
- − Management
- −$1,131
- − Depreciation
- −$815
- Taxable income
- $9,089
- Est. tax owed @ 24.0%
- −$2,181
- After-tax cash flow
- $6,822/yr
For passive investors: Depreciation is non-cash, so a rental often shows a tax loss while cash-flowing — sheltering income. Rental losses are passive: they offset passive income freely, and up to $25,000/yr can offset ordinary (W-2) income if you actively participate and your MAGI is under $100k (phasing out to $0 by $150k); unused losses carry forward. On sale, claimed depreciation is recaptured at up to 25%, and gains may owe capital-gains tax (a 1031 exchange can defer both). Figures are a year-1 estimate at your 24.0% rate — not tax advice; consult a CPA.
Schools (NCES district)
- District
- Ardmore
- NCES district ID
- 4003180
- Math proficiency
- 12% ▼ -7.00%
- Reading proficiency
- 15% ▼ -6.00%
- Median HH income
- $35,194
- Composite
- 11.1/100
- National rank
- #9733
- State rank
- #241 of 270 in OK
Livability — Ardmore
- Score
- 58/100
- State rank
- #447
- US rank
- #21387
Category grades
Schools grade is shown separately in the Schools card above.
Census & demographics
- Census place
- Ardmore, OK
- County
- Carter County · 36,833 people
- City population
- 36,833
- Metro
- Ardmore, OK
- Population (ZIP)
- 36,833
- Household income
- $61,989
- Rent vs Own
- Severe rent burden
- 1026.0
Population outlook (Carter County) Hauer SSP2
- Today (2025)
- 50,892 people
- By 2030
- 51,913 · +2.0%
- By 2040
- 53,857 · +5.8%
- By 2050
- 55,604 · +9.3%
- By 2075
- 60,670 · +19.2%
- By 2100
- 62,366 · +22.5%
Race, ethnicity, and origin ACS 2023
- Neighborhood character
- Diverse neighborhood (Simpson 0.57)
- Race & ethnicity
- White 65% Two or more races 14% Hispanic / Latino 9% Native American 8% Black 7% Asian 1%
- Hispanic origin (detail)
- Mexican 7%
- Common ancestry
- Slovak 2% Lithuanian 1% Italian 1%
- Foreign-born
- 4% · Canada
- Languages at home
- 92% English-only · Spanish 5%
Political lean MEDSL · Carter
- 2024 margin
- Solid R (+54.7) · D 21.9% · R 76.7% · Other 1.4%
- 2008→2024 swing
- -14.2pp toward R · 2008: -40.5pp · 2024: -54.7pp
- All cycles
- 2024: R+54.7 2020: R+52.5 2016: R+52.6 2012: R+42.7 2008: R+40.5
Not yet ingested
- Civics
- —
Market trends
- HPI YoY
- ▼ -74.93%
- Current HPI
- 269.7381
- Rent YoY
- ▲ 7.38%
- Metro
- Ardmore, OK
- State GDP YoY
- ▲ 1.55%
- F500 in state
- 6
Industry mix (Fortune 500 HQ in OK)
| Industry | F500 HQs | Revenue |
|---|---|---|
| Energy | 3 | $48B |
|
||
Price history
-6.7% since first listed8 events — show timeline
- 2026-06-03 Listed $28,000 MLS Technology, Inc.
- 2026-04-17 Listing Removed — MLS Technology, Inc.
- 2026-01-18 Listed $35,000 MLS Technology, Inc.
- 2025-10-31 Pending — MLS Technology, Inc.
- 2025-10-31 Listing Removed — MLS Technology, Inc.
- 2025-10-25 Relisted — MLS Technology, Inc.
- 2025-10-24 Listing Removed — MLS Technology, Inc.
- 2025-09-17 Listed $30,000 MLS Technology, Inc.
Property tax history
+6.9%/yrLatest (2025): $264 · +3.9% YoY. Source: county tax records.
Cash-flow waterfall
monthlySold comps — $/sqft
last 12 mo · ≤1 miLoading sold comps…