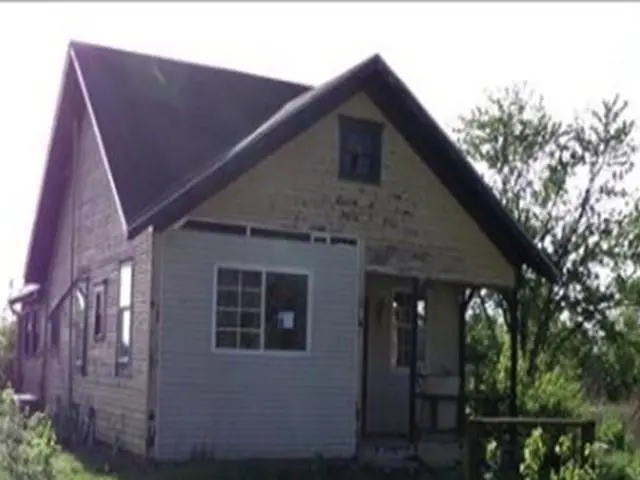
6757 Seward Ln · Camden, MO
Flood risk 6/10 · Moderate
- FEMA flood zone
- A
- Chance of flooding over 30 yrs
- 0.71%
- Est. flood insurance / yr
- $946 – $6,584
Fire risk 1/10 · Minimal
- Est. fire insurance / yr
- $1,054 – $1,958
Heat risk 4/10 · Minor
- Hot days now (above 107°F)
- 7 days/yr
- Hot days in 30 yrs
- 17 days/yr
Wind risk 2/10 · Minimal
- Chance of severe wind over 30 yrs
- —
Air-quality risk 2/10 · Minimal
- Unhealthy air days now
- 2 days/yr
- Unhealthy air days in 30 yrs
- 2 days/yr
Risk factors via First Street. Map © Google.
Why this score? — see what drove the B grade
The composite is a weighted blend of 9 inputs, each scored 0–100. Each bar is that input's sub-score; the figure is the points it added to the 100-point composite (weight × sub-score).
- Cash flow +29.7/30.0
- DSCR +10.0/10.0
- Appreciation +8.8/10.0
- 1% rule +7.6/10.0
- ARV discount +7.5/15.0
- Schools +3.0/10.0
- Livability +2.9/5.0
- Rent growth +2.5/5.0
- Condition / age +2.5/5.0
$68,250
🖨 Deal sheet (PDF) 📄 Offer letter ✓ Due diligence
Listing remarks MLS
Looking for small acreage at an affordable price? Sitting on 2 acres just off blacktop. .. This home is ready for you! Lots of work has been done already - now its time for your finishing touches! Property features a two bedroom home with living room, dining room and kitchen along with a large mudroom/bonus room. There is a 31x24 detached garage.
Key facts
- 2 acre lot
- 2 garage spots
- Built 1918
Property features AI
Finance
- Other: Living area reported as 872 (above grade); Property listed as Residential — Single Family Residence
- HOA & community: No association fees
Exterior
- Parking: Detached 2-car garage
- Utilities: Public water; Septic tank sewer
- Home design: Single-family residence; Bungalow floor plan
- Construction: Frame construction; Other roof type; Built over 100 years ago
- Exterior features: Lot approximately 87,120 square feet
Interior
- Kitchen: Kitchen
- Bedrooms: 2 bedrooms
- Bathrooms: 1 full bathroom
- Heating & cooling: Forced air heating; No central air
- Interior features: Partial basement
- Laundry & utility: No cooling system (none listed)
Neighborhood map
What this means for you Summary
Snapshot
- This is a 2-bed/1.0-bath single-family listed at $68k.
Deal economics
- At list price, monthly cash flow is $-65 ($-781/yr) — negative.
- To cash-flow at today's rent, offer at most $57k (16.8% below list).
- Meets the 1% rule at list price ($857 rent vs $68k).
- Recommended offer: $57k (16.8% below list) — sets the bar for cash-flow.
Location & tenants
- Location reads 58/100 on livability (#590 in MO) — a working-class tenant base; expect higher turnover. Strengths: cost of living A+, housing A+, employment B; Watch: crime F, amenities F, commute F.
- Richmond R-XVI (town): math 32% / reading 39% proficiency, ranked #209 of 324 in MO (top 64%) — families likely to look elsewhere, expect single-tenant / working-renter base with shorter leases.
- Zoned schools: Sunrise Elem. (math 33% / reading 37%, grade F, #672 of 1,115 statewide, top 60%, 447 students, 53% FRL); Richmond Middle (math 35% / reading 39%, grade F, #220 of 391 statewide, top 59%, 359 students, 40% FRL); Richmond High (math 22% / reading 47%, grade F, #321 of 521 statewide, top 67%, 454 students, 32% FRL) — zoned schools at 42% FRL track the district average.
- Market conditions: 2 active listings in the ZIP; 56 units permitted in Ray County in 2024 (0 in 5+ unit buildings).
Forward outlook
- In year one you build about $6k of equity ($472 loan paydown + $5k appreciation (7.7% local appreciation)).
- Ray County population projected at -23% by 2050 — secular population decline; favor cash flow + early exit over multi-decade hold.
- At projected returns (7.7% appreciation + 3.0% rent growth), your $19k cash investment doubles in ~4 years — after that, you're playing with house money.
- By year 6, paydown + projected appreciation supports a ~$32k cash-out refi (75% LTV) — recoverable capital for the next deal without selling this one.
Negotiation context
- It's been on market 17 days — a 2% lower offer ($67k) is reasonable based on typical stale-listing flexibility.
- 3 sale attempts since 5y ago with the ask held roughly flat each time — persistent listings suggest the price (not the market) is what's stuck; bring a comps-based counter.
Risks & watch-outs
- Watch-outs: flood insurance adds $314/mo; built in 1918 — expect roof / HVAC / electrical / plumbing capex.
- Climate carrying-cost: in FEMA flood zone A (mandatory federal flood insurance) — expect insurance premiums to compound above CPI over the hold.
Questions for the listing agent
- What do current leases actually rent for vs. the listed asking? Can we see a recent rent roll and the last 12 months of T-12 income?
- Built in 1918 — when were the roof, HVAC, electrical panel, plumbing, and water heater last replaced?
- What's the actual annual flood-insurance premium (NFIP or private), and is the property in a SFHA with mandatory coverage?
- Is there a deadline driving the sale (1031 exchange, divorce, estate, relocation)? That informs how much negotiation room exists.
- Schools are F-rated, which usually means shorter tenancies and higher turnover. Who's the typical renter profile here, and what's been the actual vacancy rate?
- Crime grade is F in this area — have there been break-ins, vandalism, or insurance claims at this property in the last 3 years? What carrier currently insures it and at what premium?
- What's the average days-on-market for RENTAL listings here right now (not sales)? A rising rental-DOM trend means longer vacancies and softer asking-rent achievability than the comps imply.
- What's the recent tenant-quality profile in this submarket — average credit score on applications, eviction rate, late-payment / NSF rate, and stable-employment percentage? A property-management company in the area should have these aggregated.
- How much new for-sale + rental construction is in the pipeline within 1–3 miles? Heavy new supply typically softens prices + rents 12–24 months out; constrained supply supports both.
Investment metrics
- 1% rule
- 1.26% ✓
- Cap rate
- 10.67%
- Cash-on-cash
- 15.61%
- DSCR
- 1.69
- GRM
- 6.6
CMA / ARV
No comps found within radius.
Projected returns pro-forma
7.69% appreciation · 3.0% rent growth · sell at horizon
- IRR
- 16.3%
- Equity multiple
- 2.19×
- Total profit
- $22,784
- Equity at exit
- $50,399
- IRR
- 15.9%
- Equity multiple
- 4.64×
- Total profit
- $69,526
- Equity at exit
- $98,687
Cash invested: $19,110 (down + closing). Projections, not guarantees.
Landlord ↔ Tenant lean methodology
- Overall (STATE)
- 81 Strongly Landlord-Friendly
- State Missouri
- 81 Strongly Landlord-Friendly · R+10
- County
- — inherits STATE
- City
- — inherits STATE
ZIP-level market 64017
- Home prices YoY
- 1.8%
- Active inventory
- 2
- Price-to-rent
- 6.6×
Monthly cashflow live
- Estimated rent
- $857 medium interval (Pro) →
- Mortgage (P&I)
- −$358
- Tax from tax record
- −$42 /mo · $506/yr
- Insurance
- −$28
- Flood insurance flood zone
- −$314 /mo · $3,765/yr
- HOA
- −$0
- Vacancy / Maint / Mgmt
- −$180
- Net cashflow
- $-65
Break-even live
Sensitivity live
| Price | -10% $-26 | -5% $-46 | +0% $-65 | +5% $-84 | +10% $-104 |
|---|---|---|---|---|---|
| Rent | -10% $-133 | -5% $-99 | +0% $-65 | +5% $-31 | +10% $3 |
| Rate | -1.0pp $-31 | -0.5pp $-48 | base $-65 | +0.5pp $-83 | +1.0pp $-101 |
UW: 25.0% down · 7.5% · 30yr · 1.5% tax · 5.0% vac · 8.0% maint · 8.0% mgmt
Financing live
Cash to close
- Down payment
- $17,062
- Closing costs
- $2,048
- Reserves months
- —
- Total cash needed
- —
Loan-product check · same deal, 3 products live
Conventional
25% down · 7.5% · 30yr
- Down + closing
- —
- Monthly P&I
- —
- Monthly cashflow
- —
- DSCR
- —
- Eligible?
- —
Personal DTI + credit; lowest rate.
DSCR
20% down · 8.5% · 30yr
- Down + closing
- —
- Monthly P&I
- —
- Monthly cashflow
- —
- DSCR
- —
- Eligible?
- —
No personal income docs; deal must DSCR.
Hard money
10% down · 12.0% · 12mo
- Down + closing
- —
- Monthly P&I
- —
- Monthly cashflow
- —
- DSCR
- —
- Eligible?
- —
Short-term bridge; refi at stabilization.
Listing history 13 events
-
2026-06-21days on market $68,250 Active 17 DOM
-
2026-06-21days on market $68,250 Active 16 DOM
-
2026-06-18days on market $68,250 Active 14 DOM
-
2026-06-17days on market $68,250 Active 13 DOM
-
2026-06-16days on market $68,250 Active 12 DOM
-
2026-06-15days on market $68,250 Active 11 DOM
-
2026-06-13days on market $68,250 Active 9 DOM
-
2026-06-12days on market $68,250 Active 8 DOM
-
2026-06-09days on market $68,250 Active 5 DOM
-
2026-06-08days on market $68,250 Active 4 DOM
-
2026-06-07days on market $68,250 Active 3 DOM
-
2026-06-07remarks 248-char remark
-
2026-06-07$68,250 Active 2 DOM
ⓘ Source: listings_history table (triggers on properties + properties_extension) + one-shot
backfill from property_details.listing_events for pre-trigger history.
Tax reassessment forecast MO · Resets to sale price
- Current annual tax
- $506 · $42/mo
- Projected year-2 tax
- $662 · $55/mo
- Expected delta
- +$156/yr (+$13/mo · 30.9%)
ⓘ Screening estimate from a state-policy table — verify with the county assessor before closing.
Climate risk First Street
- Flood 6/10 Major FEMA zone A · 71% chance over 30 yrs
- Wildfire 1/10 Low
- Heat 4/10 Moderate 7 d/yr ≥107°F today · 17 d/yr by 30 yrs out
- Wind 2/10 Low
- Air quality 2/10 Low 2 unhealthy d/yr today · 2 by 30 yrs out
Nearby sold comps map
Loading sold comps map…
Walkable amenities ~0.75 mi
Loading nearby amenities…
Taxation est. · year 1
- Rental income
- $10,286
- − Mortgage interest
- −$3,823
- − Property taxes
- −$506
- − Insurance
- −$4,106
- − Repairs & maintenance
- −$823
- − Management
- −$823
- − Depreciation
- −$1,985
- Taxable loss
- −$1,780
- Est. tax savings @ 24.0%
- +$427
- After-tax cash flow
- $-354/yr
For passive investors: Depreciation is non-cash, so a rental often shows a tax loss while cash-flowing — sheltering income. Rental losses are passive: they offset passive income freely, and up to $25,000/yr can offset ordinary (W-2) income if you actively participate and your MAGI is under $100k (phasing out to $0 by $150k); unused losses carry forward. On sale, claimed depreciation is recaptured at up to 25%, and gains may owe capital-gains tax (a 1031 exchange can defer both). Figures are a year-1 estimate at your 24.0% rate — not tax advice; consult a CPA.
Schools (NCES district)
- District
- Richmond R-XVI
- NCES district ID
- 2926480
- Math proficiency
- 32% ▼ -11.00%
- Reading proficiency
- 39% ▼ -8.00%
- Median HH income
- $44,070
- Composite
- 30.17/100
- National rank
- #6321
- State rank
- #209 of 324 in MO
Livability — Camden
- Score
- 58/100
- State rank
- #590
- US rank
- #20891
Category grades
Schools grade is shown separately in the Schools card above.
Census & demographics
- Population (ZIP)
- 288
Population outlook (Ray County) Hauer SSP2
- Today (2025)
- 21,420 people
- By 2030
- 20,507 · -4.3%
- By 2040
- 18,550 · -13.4%
- By 2050
- 16,516 · -22.9%
- By 2075
- 12,899 · -39.8%
- By 2100
- 10,413 · -51.4%
Race, ethnicity, and origin ACS 2023
- Neighborhood character
- Predominantly White (97%)
- Race & ethnicity
- White 97% Two or more races 2% Hispanic / Latino 1%
- Common ancestry
- Slovak 3% Lithuanian 2% Italian 1%
- Foreign-born
- 1% · Canada
Political lean MEDSL · Ray
- 2024 margin
- Solid R (+48.7) · D 25.1% · R 73.8% · Other 1.1%
- 2008→2024 swing
- -45.5pp toward R · 2008: -3.2pp · 2024: -48.7pp
- All cycles
- 2024: R+48.7 2020: R+45.0 2016: R+37.1 2012: R+14.9 2008: R+3.2
Not yet ingested
- Civics
- —
Market trends
- HPI YoY
- ▲ 7.69%
- Current HPI
- 437.3166
- Rent YoY
- —
- Metro
- —
- State GDP YoY
- ▲ 1.84%
- F500 in state
- 20
Industry mix (Fortune 500 HQ in MO)
| Industry | F500 HQs | Revenue |
|---|---|---|
| Healthcare | 1 | $163B |
|
||
| Insurance | 1 | $21B |
|
||
| Industrial Technology | 1 | $17B |
|
||
| Retail | 1 | $16B |
|
||
| Industrial Distribution | 1 | $10B |
|
||
| Utilities | 1 | $9B |
|
||
Price history
-14.6% since first listed6 events — show timeline
- 2026-06-04 Listed $68,250 Heartland MLS as Distributed by MLS Grid
- 2022-07-14 Listing Removed — Heartland MLS as Distributed by MLS Grid
- 2022-04-14 Listed $80,000 Heartland MLS as Distributed by MLS Grid
- 2021-10-25 Pending — Heartland MLS as Distributed by MLS Grid
- 2021-10-25 Listing Removed — Heartland MLS as Distributed by MLS Grid
- 2021-07-19 Listed $79,900 Heartland MLS as Distributed by MLS Grid
Property tax history
+3.0%/yrLatest (2025): $506 · +9.6% YoY. Source: county tax records.
Cash-flow waterfall
monthlySold comps — $/sqft
last 12 mo · ≤1 miLoading sold comps…