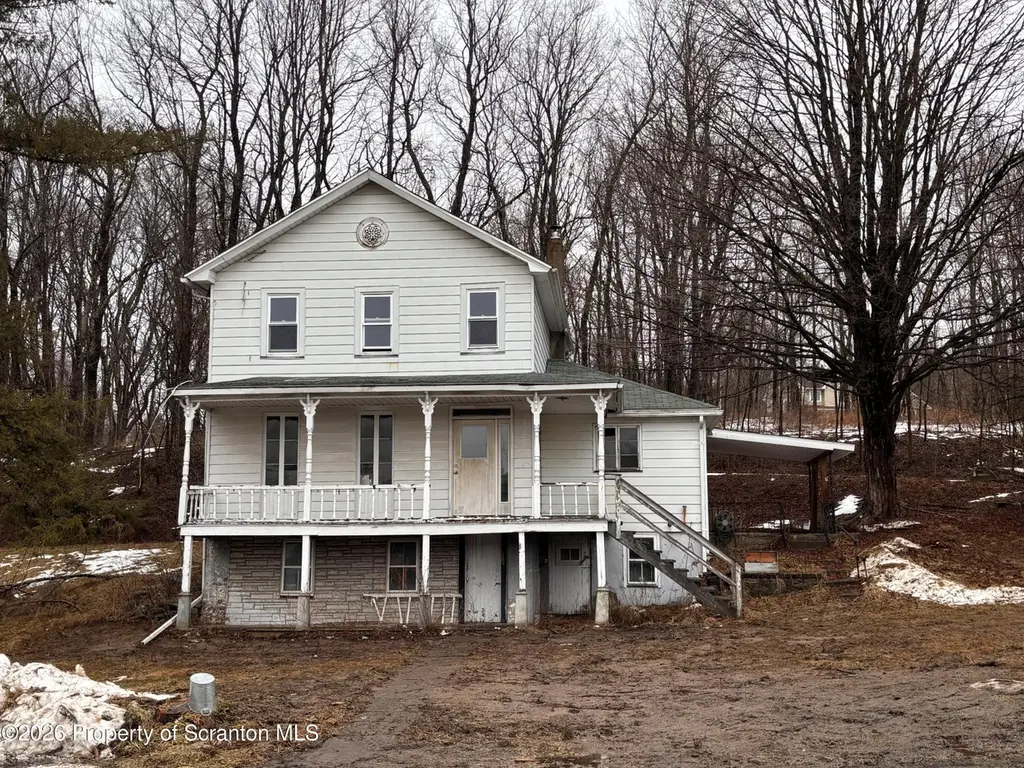
197 State Route 690 · Scranton, PA
Flood risk 1/10 · Minimal
- FEMA flood zone
- X (unshaded)
- Chance of flooding over 30 yrs
- 0.0%
- Est. flood insurance / yr
- $507 – $1,088
Fire risk 3/10 · Minor
- Est. fire insurance / yr
- $511 – $949
Heat risk 2/10 · Minimal
- Hot days now (above 90°F)
- 7 days/yr
- Hot days in 30 yrs
- 17 days/yr
Wind risk 3/10 · Minor
- Chance of severe wind over 30 yrs
- 5.0%
Air-quality risk 2/10 · Minimal
- Unhealthy air days now
- 1 days/yr
- Unhealthy air days in 30 yrs
- 2 days/yr
Risk factors via First Street. Map © Google.
Why this score? — see what drove the B+ grade
The composite is a weighted blend of 9 inputs, each scored 0–100. Each bar is that input's sub-score; the figure is the points it added to the 100-point composite (weight × sub-score).
- Cash flow +25.4/30.0
- ARV discount +15.0/15.0
- Appreciation +10.0/10.0
- DSCR +8.4/10.0
- 1% rule +6.7/10.0
- Schools +5.0/10.0
- Livability +4.4/5.0
- Rent growth +2.5/5.0
- Condition / age +1.0/5.0
$179,999
🖨 Deal sheet 📄 Offer letter ✓ Due diligence
Listing remarks MLS
All measurements are approximate. Property being sold AS IS.
Key facts
- 1.26 acre lot
- 2 garage spots
- Built 1921
Neighborhood map
What this means for you Summary
Snapshot
- This is a 3-bed/1.0-bath single-family listed at $180k. Condition is rated poor.
Deal economics
- At list price, monthly cash flow is $415 ($5k/yr) — positive.
- The deal already cash-flows at list — no discount required.
- Meets the 1% rule at list price ($2k rent vs $180k).
- Recommended offer: $177k (1.5% below list) — sets the bar for market timing.
Location & tenants
- Location reads 87/100 on livability (#50 in PA, #283 nationally) — a professional / high-income tenant draw. Strengths: amenities A+, commute A+, cost of living A+; Watch: schools D, employment D.
- North Pocono SD (rural): math 45% / reading 71% proficiency, ranked #82 of 539 in PA (top 15%) — acceptable for families but not a draw, mixed tenant base, ~2y average lease.
- Market conditions: 95 active listings in the ZIP; 1 comparable units currently listed for rent nearby; 251 units permitted in Lackawanna County in 2024 (0 in 5+ unit buildings).
Forward outlook
- In year one you build about $19k of equity ($1k loan paydown + $18k appreciation (10.0% local appreciation)).
- Lackawanna County population projected to shrink 4% by 2050 — rents likely to lag national; underwrite the cash flow, not the appreciation.
- At projected returns (10.0% appreciation + 3.0% rent growth), your $50k cash investment doubles in ~2 years — after that, you're playing with house money.
- By year 2, paydown + projected appreciation supports a ~$31k cash-out refi (75% LTV) — recoverable capital for the next deal without selling this one.
Negotiation context
- It's been on market 25 days — a 2% lower offer ($177k) is reasonable based on typical stale-listing flexibility.
Risks & watch-outs
- Watch-outs: built in 1921 — expect roof / HVAC / electrical / plumbing capex.
Questions for the listing agent
- Have any recent inspections been done? Can we get a copy of the seller's disclosures and any deferred-maintenance estimates?
- Built in 1921 — when were the roof, HVAC, electrical panel, plumbing, and water heater last replaced?
- Is there a deadline driving the sale (1031 exchange, divorce, estate, relocation)? That informs how much negotiation room exists.
- Schools are D-rated, which usually means shorter tenancies and higher turnover. Who's the typical renter profile here, and what's been the actual vacancy rate?
- What's the average days-on-market for RENTAL listings here right now (not sales)? A rising rental-DOM trend means longer vacancies and softer asking-rent achievability than the comps imply.
- What's the recent tenant-quality profile in this submarket — average credit score on applications, eviction rate, late-payment / NSF rate, and stable-employment percentage? A property-management company in the area should have these aggregated.
- How much new for-sale + rental construction is in the pipeline within 1–3 miles? Heavy new supply typically softens prices + rents 12–24 months out; constrained supply supports both.
Investment metrics
- 1% rule
- 1.17% ✓
- Cap rate
- 9.06%
- Cash-on-cash
- 9.88%
- DSCR
- 1.44
- GRM
- 7.1
CMA / ARV
- ARV (median comp)
- $288,942
- List price
- $179,999
- Delta
- -37.70%
- Verdict
- UNDERPRICED
- Comps
- 2 within 1.0 mi
Show comp detail 1 sale within ~0.75 mi
| Address | Dist | Beds/Ba | Sqft | Sold | Price | $/sf | Match |
|---|---|---|---|---|---|---|---|
| 104 Bowens Rd | 0.51mi | 3/1.5 | 1,679 (+5%) | 22mo | $280,000 | $167 | 48 |
Match score weights: distance 35% · size 25% · config 20% · recency 20%. Top-matched comps best support the ARV.
Projected returns pro-forma
10.0% appreciation · 3.0% rent growth · sell at horizon
- IRR
- 31.5%
- Equity multiple
- 3.47×
- Total profit
- $124,500
- Equity at exit
- $162,157
- IRR
- 27.2%
- Equity multiple
- 7.86×
- Total profit
- $345,905
- Equity at exit
- $349,698
Cash invested: $50,400 (down + closing). Projections, not guarantees.
Landlord ↔ Tenant lean methodology
- Overall (STATE)
- 62 Landlord-Friendly
- State Pennsylvania
- 62 Landlord-Friendly · EVEN
- County
- — inherits STATE
- City
- — inherits STATE
ZIP-level market 18444
- Home prices YoY
- 24.9%
- Active inventory
- 95
- Price-to-rent
- 7.1×
Monthly cashflow live
- Estimated rent
- $2,100 medium interval (Pro) →
- Mortgage (P&I)
- −$944
- Tax est. 1.5%
- −$225 /mo · $2,700/yr
- Insurance
- −$75
- HOA
- −$0
- Vacancy / Maint / Mgmt
- −$441
- Net cashflow
- $415
Break-even live
UW: 25.0% down · 7.5% · 30yr · 1.5% tax · 5.0% vac · 8.0% maint · 8.0% mgmt
Financing live
Cash to close
- Down payment
- $45,000
- Closing costs
- $5,400
- Reserves months
- —
- Total cash needed
- —
Loan-product check · same deal, 3 products live
Conventional
25% down · 7.5% · 30yr
- Down + closing
- —
- Monthly P&I
- —
- Monthly cashflow
- —
- DSCR
- —
- Eligible?
- —
Personal DTI + credit; lowest rate.
DSCR
20% down · 8.5% · 30yr
- Down + closing
- —
- Monthly P&I
- —
- Monthly cashflow
- —
- DSCR
- —
- Eligible?
- —
No personal income docs; deal must DSCR.
Hard money
10% down · 12.0% · 12mo
- Down + closing
- —
- Monthly P&I
- —
- Monthly cashflow
- —
- DSCR
- —
- Eligible?
- —
Short-term bridge; refi at stabilization.
Rent comps 1 comps
| Address | Beds | Baths | Sqft | Rent | $/sqft | DOM | Units | Dist |
|---|---|---|---|---|---|---|---|---|
| 1 Beech Rd Spring Brook Township, PA | 4.0 | 2.0 | 1545 | $2,100 | $1.36 | 21d | 1 | 0.42mi |
Listing history 2 events
-
2026-05-08status Pending 60-char remark
Show marketing remark (60 chars)
All measurements are approximate. Property being sold AS IS.
-
2026-04-07$179,999 Active 60-char remark
Show marketing remark (60 chars)
All measurements are approximate. Property being sold AS IS.
ⓘ Source: listings_history table (triggers on properties + properties_extension) + one-shot
backfill from property_details.listing_events for pre-trigger history.
Climate risk First Street
- Flood 1/10 Low FEMA zone X (unshaded) · 0% chance over 30 yrs
- Wildfire 3/10 Moderate
- Heat 2/10 Low 7 d/yr ≥90°F today · 17 d/yr by 30 yrs out
- Wind 3/10 Moderate 5% chance of damaging wind over 30 yrs
- Air quality 2/10 Low 1 unhealthy d/yr today · 2 by 30 yrs out
Nearby sold comps map
Loading sold comps map…
Walkable amenities ~0.75 mi
Loading nearby amenities…
Taxation est. · year 1
- Rental income
- $25,200
- − Mortgage interest
- −$10,083
- − Property taxes
- −$2,700
- − Insurance
- −$900
- − Repairs & maintenance
- −$2,016
- − Management
- −$2,016
- − Depreciation
- −$5,236
- Taxable income
- $2,249
- Est. tax owed @ 24.0%
- −$540
- After-tax cash flow
- $4,441/yr
For passive investors: Depreciation is non-cash, so a rental often shows a tax loss while cash-flowing — sheltering income. Rental losses are passive: they offset passive income freely, and up to $25,000/yr can offset ordinary (W-2) income if you actively participate and your MAGI is under $100k (phasing out to $0 by $150k); unused losses carry forward. On sale, claimed depreciation is recaptured at up to 25%, and gains may owe capital-gains tax (a 1031 exchange can defer both). Figures are a year-1 estimate at your 24.0% rate — not tax advice; consult a CPA.
Condition & rehab AI · 12 photos
This property requires extensive renovations to bring it up to modern standards, significantly increasing its resale and rental value.
Repairs flagged
- Major kitchen cabinets — severe damage
- Major bathroom fixtures — outdated and missing
- Major exterior siding — paint peeling and exposed
- Major flooring — damaged and missing tiles
- Major interior walls — paint peeling and exposed drywall
- Major windows — old and single-pane
- Major HVAC/mechanicals — no visible systems
Value-add opportunities
- Resale kitchen renovation — modern kitchen increases appeal
- Resale bathroom renovation — updated bathroom enhances functionality
- Resale exterior paint and siding repair — fresh paint improves curb appeal
- Resale flooring replacement — new flooring enhances living spaces
- Resale interior wall repairs and paint — fresh paint and repairs improve aesthetics
- Resale window replacement — new windows enhance energy efficiency and appearance
- Both HVAC system replacement — modern HVAC improves comfort and energy efficiency
Renovation cost estimate screening
| Repair item | Severity | Est. cost |
|---|---|---|
| kitchen cabinets · severe damage | Major | $15,000–50,000 |
| bathroom fixtures · outdated and missing | Major | $15,000–50,000 |
| exterior siding · paint peeling and exposed | Major | $15,000–50,000 |
| flooring · damaged and missing tiles | Major | $15,000–50,000 |
| interior walls · paint peeling and exposed drywall | Major | $15,000–50,000 |
| windows · old and single-pane | Major | $15,000–50,000 |
| HVAC/mechanicals · no visible systems | Major | $15,000–50,000 |
| Total estimated repair cost · 7 items | $105,000–350,000 |
Value-add ROI direction
- Resale kitchen renovation — modern kitchen increases appeal ↑
- Resale bathroom renovation — updated bathroom enhances functionality ↑
- Resale exterior paint and siding repair — fresh paint improves curb appeal ↑
- Resale flooring replacement — new flooring enhances living spaces ↑
- Resale interior wall repairs and paint — fresh paint and repairs improve aesthetics ↑
- Resale window replacement — new windows enhance energy efficiency and appearance ↑
- Both HVAC system replacement — modern HVAC improves comfort and energy efficiency ↑
ⓘ Cost ranges are severity-bucket heuristics (US national rule-of-thumb). Get contractor quotes + a written scope before underwriting a rehab budget.
Schools (NCES district)
- District
- North Pocono SD
- NCES district ID
- 4217310
- Math proficiency
- 45% ▼ -9.00%
- Reading proficiency
- 71% ▼ -2.00%
- Median HH income
- $59,555
- Composite
- 50.23/100
- National rank
- #1894
- State rank
- #82 of 539 in PA
Livability — Scranton
- Score
- 87/100
- State rank
- #50
- US rank
- #283
Category grades
Schools grade is shown separately in the Schools card above.
Census & demographics
- City population
- 82,447
- Population (ZIP)
- 13,681
Population outlook (Lackawanna County) Hauer SSP2
- Today (2025)
- 210,652 people
- By 2030
- 208,623 · -1.0%
- By 2040
- 203,980 · -3.2%
- By 2050
- 201,069 · -4.5%
- By 2075
- 205,026 · -2.7%
- By 2100
- 210,851 · +0.1%
Race, ethnicity, and origin ACS 2023
- Neighborhood character
- Predominantly White (91%)
- Race & ethnicity
- White 91% Two or more races 6% Hispanic / Latino 3%
- Common ancestry
- Romanian 16% Scotch-Irish 4% Slovak 2%
- Foreign-born
- 1% · Canada, South Korea
- Languages at home
- 97% English-only · Spanish 2% Russian/Polish/Slavic 1%
Political lean MEDSL · Lackawanna
- 2024 margin
- Toss-up / Even · D 51.0% · R 48.3%
- 2008→2024 swing
- -23.2pp toward R · 2008: 26.0pp · 2024: 2.8pp
- All cycles
- 2024: D+2.8 2020: D+8.4 2016: D+3.4 2012: D+27.4 2008: D+26.0
Not yet ingested
- Civics
- —
Market trends
- HPI YoY
- ▲ 85.51%
- Current HPI
- 428.8661
- Rent YoY
- —
- Metro
- —
- State GDP YoY
- ▲ 1.68%
- F500 in state
- 34
Industry mix (Fortune 500 HQ in PA)
| Industry | F500 HQs | Revenue |
|---|---|---|
| Healthcare | 2 | $309B |
|
||
| Insurance | 2 | $27B |
|
||
| Telecommunications / Media | 1 | $124B |
|
||
| Industrial Distribution | 1 | $22B |
|
||
| Financial Services | 1 | $20B |
|
||
| Chemicals / Materials | 1 | $18B |
|
||
Price history
2 events — show timeline
- 2026-05-08 Pending — GSBR as distributed by MLS GRID
- 2026-04-07 Listed $179,999 GSBR as distributed by MLS GRID
Cash-flow waterfall
monthlySold comps — $/sqft
last 12 mo · ≤1 miLoading sold comps…