17183 Pompeii Way · North Fort Myers, FL
Flood risk No data
- FEMA flood zone
- —
- Chance of flooding over 30 yrs
- —
- Est. flood insurance / yr
- —
Fire risk No data
- Est. fire insurance / yr
- —
Heat risk No data
- Hot days now (above threshold)
- —
- Hot days in 30 yrs
- —
Wind risk No data
- Chance of severe wind over 30 yrs
- —
Air-quality risk No data
- Unhealthy air days now
- —
- Unhealthy air days in 30 yrs
- —
Risk factors via First Street. Map © Google.
Why this score? — see what drove the F grade
The composite is a weighted blend of 9 inputs, each scored 0–100. Each bar is that input's sub-score; the figure is the points it added to the 100-point composite (weight × sub-score).
- Cash flow +8.9/30.0
- ARV discount +7.5/15.0
- Schools +4.1/10.0
- Livability +3.7/5.0
- Rent growth +3.2/5.0
- 1% rule +2.5/10.0
- DSCR +2.5/10.0
- Condition / age +2.5/5.0
- Appreciation +0.0/10.0
$349,097
🖨 Deal sheet (PDF) 📄 Offer letter ✓ Due diligence
Listing remarks
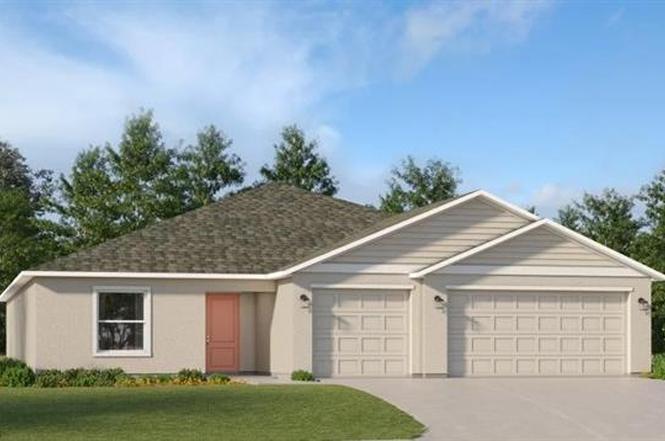
THIS HOME IS READY FOR YOU NOW!! Crane Landing is a master-planned community of new single-family homes for sale in North Fort Myers, FL, offering an excellent selection of onsite amenities. Designed to enhance recreation-rich living and promote a healthy lifestyle, state-of-the-art amenities at Crane Landing include a playground and numerous sports courts for basketball, soccer, pickleball and tennis. Designed for gracious living and entertainment, this new single-story home features a total of five bedrooms to accommodate large and growing families. At the heart of the floorplan is a sprawling family room made for gatherings, which connects to the modern kitchen and a cozy dining area. A
Key facts
- Three-car garage
- Onsite amenities
- Sports courts
Tags
Neighborhood map
What this means for you Summary
Snapshot
- This is a 5-bed/3.0-bath land listed at $349k.
Deal economics
- At list price, monthly cash flow is $-282 ($-3k/yr) — negative.
- To cash-flow at today's rent, offer at most $299k (14.3% below list).
- To meet the 1% rule (rent ≥ 1% of price), the offer needs to be $262k (24.9% below list).
- Recommended offer: $262k (24.9% below list) — sets the bar for 1% rule.
- Cap rate 5.3% vs local median 3.6% in North Fort Myers — top-decile yield for the area; either an underpriced asset or a hidden risk that comps aren't pricing in. Stress-test before assuming the spread holds.
Location & tenants
- Location reads 74/100 on livability (#269 in FL, #4,409 nationally) — a middle-class / working-renter tenant base. Strengths: cost of living A+, housing A+, health & safety A+; Watch: employment C-, amenities F, commute F.
- Lee (suburban): math 47% / reading 50% proficiency, ranked #42 of 73 in FL (top 58%) — families likely to look elsewhere, expect single-tenant / working-renter base with shorter leases.
- Zoned schools: Diplomat Elementary School (math 67% / reading 60%, grade B, #564 of 2,144 statewide, top 27%, 1,069 students, 56% FRL); Mariner Middle School (math 50% / reading 47%, grade C-, #274 of 571 statewide, top 50%, 1,001 students, 53% FRL); Ida S. Baker High School (math 44% / reading 47%, grade D-, #223 of 667 statewide, top 34%, 1,933 students, 39% FRL).
- Market conditions: Rents rising (+2.6%/yr); 846 active listings in the ZIP; 18 comparable units currently listed for rent nearby; rentals at typical pace (median 26d on market — plan ~3-4 weeks tenant-placement turnaround); 15,411 units permitted in Lee County in 2024 (4,686 in 5+ unit buildings).
- At $2,623/mo this rent would consume 57% of the median local household income ($55k/yr) (locally 775% of renters already pay >50% of income on rent) — very limited rent-growth headroom before tenants either downsize or default.
Forward outlook
- Local home prices are declining (-3.0%/yr); year-one equity from $2k of loan paydown is wiped out by about $10k of value loss. Plan a longer hold.
- Lee County population projected at +44% by 2050 — long-run rental-demand tailwind backs the buy-and-hold thesis.
Negotiation context
- It's been on market 54 days — a 3% lower offer ($339k) is reasonable based on typical stale-listing flexibility.
Questions for the listing agent
- What do current leases actually rent for vs. the listed asking? Can we see a recent rent roll and the last 12 months of T-12 income?
- It's been on market 54 days. Have you received any prior offers? Is the seller open to a 25% concession, seller financing, or rate buy-down credit?
- What does the HOA fee cover, when was the last increase, and are there any pending special assessments or reserve-fund shortfalls?
- Is there a deadline driving the sale (1031 exchange, divorce, estate, relocation)? That informs how much negotiation room exists.
- The area grade is low — what's the realistic commute time and amenity access for the typical tenant pool here? Any planned neighborhood developments (good or bad) we should know about?
- What's the average days-on-market for RENTAL listings here right now (not sales)? A rising rental-DOM trend means longer vacancies and softer asking-rent achievability than the comps imply.
- What's the recent tenant-quality profile in this submarket — average credit score on applications, eviction rate, late-payment / NSF rate, and stable-employment percentage? A property-management company in the area should have these aggregated.
- How much new for-sale + rental construction is in the pipeline within 1–3 miles? Heavy new supply typically softens prices + rents 12–24 months out; constrained supply supports both.
Investment metrics
- 1% rule
- 0.75% ✗
- Cap rate
- 5.32%
- Cash-on-cash
- -3.46%
- DSCR
- 0.85
- GRM
- 11.1
CMA / ARV
No comps found within radius.
Projected returns pro-forma
-3.0% appreciation · 2.63% rent growth · sell at horizon
- IRR
- -22.5%
- Equity multiple
- 0.23×
- Total profit
- $-75,508
- Equity at exit
- $52,051
- IRR
- -17.6%
- Equity multiple
- 0.05×
- Total profit
- $-92,837
- Equity at exit
- $30,184
Cash invested: $97,747 (down + closing). Projections, not guarantees.
Landlord ↔ Tenant lean methodology
- Overall (STATE)
- 87 Strongly Landlord-Friendly
- State Florida
- 87 Strongly Landlord-Friendly · R+3
- County
- — inherits STATE
- City
- — inherits STATE
ZIP-level market 33917
- Home prices YoY
- -30.2%
- Rents YoY
- 2.6%
- Active inventory
- 846
- Price-to-rent
- 11.1×
Monthly cashflow live
- Estimated rent
- $2,623 high interval (Pro) →
- Mortgage (P&I)
- −$1,831
- Tax from tax record
- −$180 /mo · $2,161/yr
- Insurance
- −$145
- HOA
- −$198
- Vacancy / Maint / Mgmt
- −$551
- Net cashflow
- $-282
Break-even live
Sensitivity live
| Price | -10% $-85 | -5% $-183 | +0% $-282 | +5% $-381 | +10% $-480 |
|---|---|---|---|---|---|
| Rent | -10% $-489 | -5% $-386 | +0% $-282 | +5% $-179 | +10% $-75 |
| Rate | -1.0pp $-106 | -0.5pp $-193 | base $-282 | +0.5pp $-373 | +1.0pp $-465 |
UW: 25.0% down · 7.5% · 30yr · 1.5% tax · 5.0% vac · 8.0% maint · 8.0% mgmt
Financing live
Cash to close
- Down payment
- $87,274
- Closing costs
- $10,473
- Reserves months
- —
- Total cash needed
- —
Loan-product check · same deal, 3 products live
Conventional
25% down · 7.5% · 30yr
- Down + closing
- —
- Monthly P&I
- —
- Monthly cashflow
- —
- DSCR
- —
- Eligible?
- —
Personal DTI + credit; lowest rate.
DSCR
20% down · 8.5% · 30yr
- Down + closing
- —
- Monthly P&I
- —
- Monthly cashflow
- —
- DSCR
- —
- Eligible?
- —
No personal income docs; deal must DSCR.
Hard money
10% down · 12.0% · 12mo
- Down + closing
- —
- Monthly P&I
- —
- Monthly cashflow
- —
- DSCR
- —
- Eligible?
- —
Short-term bridge; refi at stabilization.
Rent comps 18 comps
| Address | Beds | Baths | Sqft | Rent | $/sqft | DOM | Units | Dist |
|---|---|---|---|---|---|---|---|---|
| 17167 Pompeii Way North Fort Myers, FL | 5.0 | 3.0 | 2587 | $2,700 | $1.04 | 13d | 1 | 0.06mi |
| 17257 Cantu Ct North Fort Myers, FL | 5.0 | 2.5 | 2570 | $2,450 | $0.95 | 25d | 1 | 0.07mi |
| 17158 Pompeii Way North Fort Myers, FL | 4.0 | 3.0 | 2205 | $2,600 | $1.18 | 15d | 1 | 0.09mi |
| 17244 Cantu Ct North Fort Myers, FL | 4.0 | 2.0 | 1824 | $2,200 | $1.21 | 16d | 1 | 0.11mi |
| 17124 Pompeii Way North Fort Myers, FL | 5.0 | 3.0 | 2587 | $2,600 | $1.01 | 13d | 1 | 0.13mi |
| 4106 San Felice Ln North Fort Myers, FL | 4.0 | 2.5 | 1874 | $2,400 | $1.28 | 25d | 1 | 0.14mi |
| 17225 Cantu Ct North Fort Myers, FL | 4.0 | 2.0 | 1824 | $2,200 | $1.21 | 25d | 1 | 0.14mi |
| 4106 Lattuca Ln North Fort Myers, FL | 4.0 | 2.5 | 1874 | $2,200 | $1.17 | 25d | 1 | 0.22mi |
| 4106 Granita Ct North Fort Myers, FL | 4.0 | 2.5 | 1812 | $2,300 | $1.27 | 25d | 1 | 0.28mi |
| 17596 Monte Isola Way North Fort Myers, FL | 4.0 | 2.5 | 2500 | $2,550 | $1.02 | 25d | 1 | 0.32mi |
| 17404 Monte Isola Way North Fort Myers, FL | 5.0 | 2.5 | 2279 | $2,099 | $0.92 | 15d | 1 | 0.49mi |
| 17392 Monte Isola Way North Fort Myers, FL | 4.0 | 2.5 | 1871 | $2,299 | $1.23 | 25d | 1 | 0.57mi |
| 4216 Villa Rapallo Way North Fort Myers, FL | 4.0 | 2.0 | 1817 | $2,000 | $1.10 | 3d | 1 | 0.74mi |
| 4232 Villa Rapallo Way North Fort Myers, FL | 4.0 | 2.0 | 1812 | $1,900 | $1.05 | 25d | 1 | 0.76mi |
| 4263 Villa Rapallo Way North Fort Myers, FL | 4.0 | 2.0 | 1937 | $2,200 | $1.14 | 5d | 1 | 0.81mi |
| 4263 Villa Rapallo Way North Fort Myers, FL | 4.0 | 2.0 | 1936 | $2,200 | $1.14 | 17d | 1 | 0.81mi |
| 2729 Foralesca Ct Cape Coral, FL | 4.0 | 2.0 | 1828 | $2,300 | $1.26 | 5d | 1 | 1.32mi |
| 2729 Foralesca Ct Cape Coral, FL | 4.0 | 2.0 | 1828 | $2,300 | $1.26 | 25d | 1 | 1.32mi |
HOA detail
- Monthly dues
- $198 · $2,376/yr
Listing history 3 events
-
2026-03-23status Pending
-
2026-03-16price $349,097
-
2026-01-28$360,000 Active
ⓘ Source: listings_history table (triggers on properties + properties_extension) + one-shot
backfill from property_details.listing_events for pre-trigger history.
Tax reassessment forecast FL · Resets to sale price
- Current annual tax
- $2,161 · $180/mo
- Projected year-2 tax
- $2,898 · $241/mo
- Expected delta
- +$737/yr (+$61/mo · 34.1%)
ⓘ Screening estimate from a state-policy table — verify with the county assessor before closing.
Nearby sold comps map
Loading sold comps map…
Walkable amenities ~0.75 mi
Loading nearby amenities…
Taxation est. · year 1
- Rental income
- $31,475
- − Mortgage interest
- −$19,555
- − Property taxes
- −$2,161
- − Insurance
- −$1,745
- − Repairs & maintenance
- −$2,518
- − Management
- −$2,518
- − HOA
- −$2,376
- − Depreciation
- −$10,156
- Taxable loss
- −$9,554
- Est. tax savings @ 24.0%
- +$2,293
- After-tax cash flow
- $-1,093/yr
For passive investors: Depreciation is non-cash, so a rental often shows a tax loss while cash-flowing — sheltering income. Rental losses are passive: they offset passive income freely, and up to $25,000/yr can offset ordinary (W-2) income if you actively participate and your MAGI is under $100k (phasing out to $0 by $150k); unused losses carry forward. On sale, claimed depreciation is recaptured at up to 25%, and gains may owe capital-gains tax (a 1031 exchange can defer both). Figures are a year-1 estimate at your 24.0% rate — not tax advice; consult a CPA.
Schools (NCES district)
- District
- Lee
- NCES district ID
- 1201080
- Math proficiency
- 47% ▼ -11.00%
- Reading proficiency
- 50% ▼ -4.00%
- Median HH income
- $49,518
- Composite
- 41.49/100
- National rank
- #3458
- State rank
- #42 of 73 in FL
Livability — North Fort Myers
- Score
- 74/100
- State rank
- #269
- US rank
- #4409
Category grades
Schools grade is shown separately in the Schools card above.
Census & demographics
- Census place
- North Fort Myers, FL
- County
- Lee County · 788,662 people
- City population
- 57,035
- Metro
- Cape Coral-Fort Myers, FL
- Population (ZIP)
- 33,380
- Household income
- $55,000
- Rent vs Own
- Severe rent burden
- 775.0
Population outlook (Lee County) Hauer SSP2
- Today (2025)
- 871,946 people
- By 2030
- 955,468 · +9.6%
- By 2040
- 1,113,587 · +27.7%
- By 2050
- 1,256,891 · +44.1%
- By 2075
- 1,560,270 · +78.9%
- By 2100
- 1,726,848 · +98.0%
Race, ethnicity, and origin ACS 2023
- Neighborhood character
- Predominantly White (85%)
- Race & ethnicity
- White 85% Hispanic / Latino 10% Two or more races 7% Asian 1% Black 1%
- Hispanic origin (detail)
- Mexican 2% Puerto Rican 1% Cuban 3%
- Common ancestry
- Lithuanian 3% Romanian 3% Slovak 2%
- Foreign-born
- 10% · Canada
- Languages at home
- 88% English-only · Spanish 9% Other Indo-European 1% Russian/Polish/Slavic 1%
Political lean MEDSL · Lee
- 2024 margin
- Strong R (+28.4) · D 35.5% · R 63.9%
- 2008→2024 swing
- -18.0pp toward R · 2008: -10.4pp · 2024: -28.4pp
- All cycles
- 2024: R+28.4 2020: R+19.2 2016: R+20.4 2012: R+16.6 2008: R+10.4
Not yet ingested
- Civics
- —
Market trends
- HPI YoY
- ▼ -122.28%
- Current HPI
- 282.2895
- Rent YoY
- ▲ 2.63%
- Metro
- Cape Coral-Fort Myers, FL
- State GDP YoY
- ▲ 3.28%
- F500 in state
- 36
Industry mix (Fortune 500 HQ in FL)
| Industry | F500 HQs | Revenue |
|---|---|---|
| Industrial Technology | 2 | $29B |
|
||
| Insurance | 2 | $17B |
|
||
| Retail | 1 | $60B |
|
||
| Technology Distribution | 1 | $58B |
|
||
| Homebuilding | 1 | $35B |
|
||
| Technology Manufacturing | 1 | $35B |
|
||
Price history
-3.0% since first listed3 events — show timeline
- 2026-03-23 Pending — NAPLESMLS
- 2026-03-16 Price Changed $349,097 NAPLESMLS
- 2026-01-28 Listed $360,000 NAPLESMLS
Cash-flow waterfall
monthlySold comps — $/sqft
last 12 mo · ≤1 miLoading sold comps…