880 Tully Rd #13 · Houston, TX
Flood risk 3/10 · Minor
- FEMA flood zone
- X (unshaded)
- Chance of flooding over 30 yrs
- 0.2%
- Est. flood insurance / yr
- $507 – $1,088
Fire risk 4/10 · Minor
- Est. fire insurance / yr
- $1,222 – $2,270
Heat risk 9/10 · Severe
- Hot days now (above 110°F)
- 7 days/yr
- Hot days in 30 yrs
- 25 days/yr
Wind risk 9/10 · Severe
- Chance of severe wind over 30 yrs
- 99.0%
Air-quality risk 3/10 · Minor
- Unhealthy air days now
- 2 days/yr
- Unhealthy air days in 30 yrs
- 3 days/yr
Risk factors via First Street. Map © Google.
Why this score? — see what drove the D+ grade
The composite is a weighted blend of 9 inputs, each scored 0–100. Each bar is that input's sub-score; the figure is the points it added to the 100-point composite (weight × sub-score).
- ARV discount +13.8/15.0
- Cash flow +10.9/30.0
- 1% rule +5.6/10.0
- Schools +4.1/10.0
- Livability +3.7/5.0
- DSCR +3.2/10.0
- Condition / age +2.5/5.0
- Rent growth +2.3/5.0
- Appreciation +0.0/10.0
$199,000
🖨 Deal sheet 📄 Offer letter ✓ Due diligence
Listing remarks
SOLD AS-IS! Welcome to 880 Tully Rd #13, a spacious 2-bedroom, 2.5-bath townhome in a gated community in desirable 77079 near the Energy Corridor and Memorial. Offering approximately 1,775 sq ft, this home provides a great opportunity to personalize in a prime location. The generous living area is ideal for everyday living or entertaining. Both bedrooms feature en-suite baths, plus a convenient half bath downstairs for guests. Major updates include a recent HVAC system (2023/2024) and water heater (2021). Priced to reflect original condition, allowing the next owner to update to their own style. Community amenities include a pool and tennis courts. Easy access to I-10, CityCentre, shoppin
Key facts
- Gated community
- Recent water heater
- Community amenities
Tags
Property features AI
Finance
- HOA & community: Sterling Association Services; Monthly association fee of $268 (includes clubhouse and common areas)
Exterior
- Parking: Attached garage
- Utilities: Public water; Public sewer
- Home design: Residential property; 2 stories; Full ownership; Slab foundation
- Construction: Built in 1982; Roof: composition/shingle/wood; Construction materials: unknown
- Exterior features: Association pool; Association clubhouse; Tennis courts; Gated community
Interior
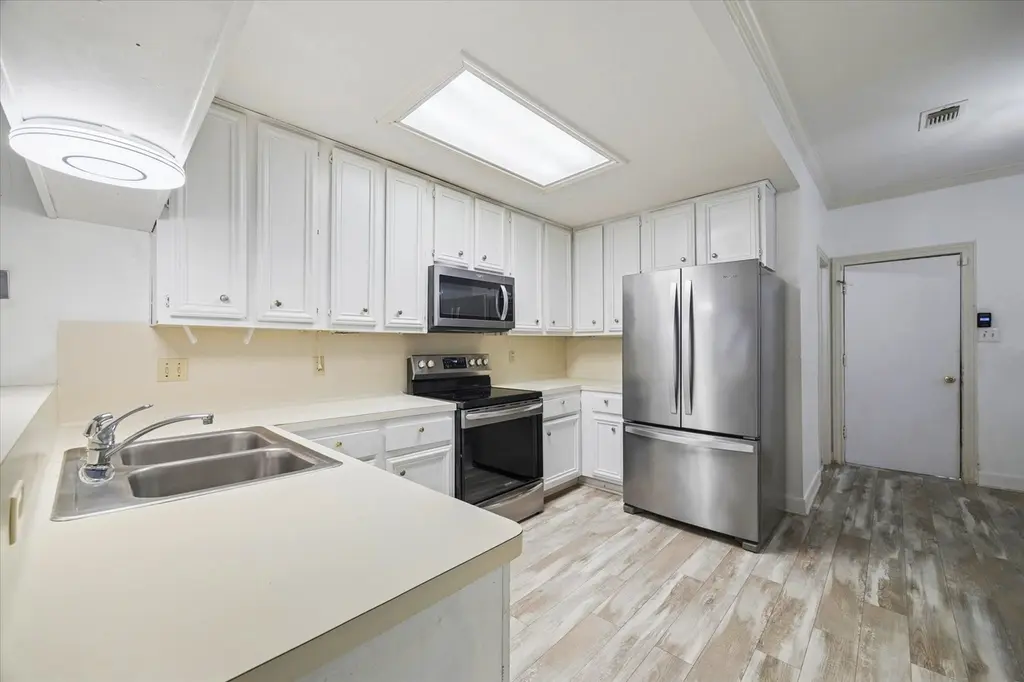
- Kitchen: Electric range; Dishwasher; Microwave; Refrigerator
- Bedrooms: Primary bedroom on second level; Additional bedroom on second level (approx. 10 x 10)
- Bathrooms: 2 full bathrooms; 1 half bathroom (first level)
- Interior features: Balcony; Bath in primary bedroom; Ceiling fans; Wood-burning fireplace (1)
- Laundry & utility: Washer; Dryer
Neighborhood map
What this means for you Summary
Snapshot
- This is a 3-bed/2.5-bath townhouse listed at $199k.
Deal economics
- At list price, monthly cash flow is $-89 ($-1k/yr) — negative.
- To cash-flow at today's rent, offer at most $183k (7.9% below list).
- Meets the 1% rule at list price ($2k rent vs $199k).
- Recommended offer: $183k (7.9% below list) — sets the bar for cash-flow.
- Cap rate 5.8% vs local median 3.2% in Houston — top-decile yield for the area; either an underpriced asset or a hidden risk that comps aren't pricing in. Stress-test before assuming the spread holds.
Location & tenants
- Location reads 74/100 on livability (#184 in TX, #4,771 nationally) — a middle-class / working-renter tenant base. Strengths: amenities A+, cost of living A+, housing A+; Watch: crime F.
- Spring Branch ISD (urban): math 47% / reading 46% proficiency, ranked #215 of 826 in TX (top 26%) — families likely to look elsewhere, expect single-tenant / working-renter base with shorter leases.
- Zoned schools: Thornwood El (math 27% / reading 27%, grade F, #2,791 of 4,322 statewide, top 68%, 408 students, 88% FRL); Spring Forest Middle (math 39% / reading 44%, grade F, #595 of 1,662 statewide, top 37%, 962 students, 56% FRL); Stratford H S (math 52% / reading 59%, grade C, #364 of 1,632 statewide, top 23%, 2,272 students, 33% FRL) — zoned schools at 59% FRL track the district average.
- Market conditions: Rents soft (-0.8%/yr); 235 active listings in the ZIP; 31 comparable units currently listed for rent nearby; rentals at typical pace (median 18d on market — plan ~3-4 weeks tenant-placement turnaround); solid renter incomes; 29,883 units permitted in Harris County in 2024 (8,621 in 5+ unit buildings).
Forward outlook
- Local home prices are declining (-3.0%/yr); year-one equity from $1k of loan paydown is wiped out by about $6k of value loss. Plan a longer hold.
- Harris County population projected at +47% by 2050 — long-run rental-demand tailwind backs the buy-and-hold thesis.
Negotiation context
- Only 13 days on market — expect competitive offers; lowballing is unlikely to land.
- 10 sale attempts since 20y ago with the ask held roughly flat each time — persistent listings suggest the price (not the market) is what's stuck; bring a comps-based counter.
- Current owner paid $77k; list at $199k implies a 158% gain — meaningful room to come down on a strong offer.
Risks & watch-outs
- Climate carrying-cost: severe wind risk, 99% chance of damaging wind over 30y; extreme-heat days projected 7→25/yr by 2055 (HVAC capex compounding) — expect insurance premiums to compound above CPI over the hold.
Questions for the listing agent
- What do current leases actually rent for vs. the listed asking? Can we see a recent rent roll and the last 12 months of T-12 income?
- What does the HOA fee cover, when was the last increase, and are there any pending special assessments or reserve-fund shortfalls?
- Is there a deadline driving the sale (1031 exchange, divorce, estate, relocation)? That informs how much negotiation room exists.
- Schools are D-rated, which usually means shorter tenancies and higher turnover. Who's the typical renter profile here, and what's been the actual vacancy rate?
- Crime grade is F in this area — have there been break-ins, vandalism, or insurance claims at this property in the last 3 years? What carrier currently insures it and at what premium?
- The area grade is low — what's the realistic commute time and amenity access for the typical tenant pool here? Any planned neighborhood developments (good or bad) we should know about?
- What's the average days-on-market for RENTAL listings here right now (not sales)? A rising rental-DOM trend means longer vacancies and softer asking-rent achievability than the comps imply.
- What's the recent tenant-quality profile in this submarket — average credit score on applications, eviction rate, late-payment / NSF rate, and stable-employment percentage? A property-management company in the area should have these aggregated.
- How much new for-sale + rental construction is in the pipeline within 1–3 miles? Heavy new supply typically softens prices + rents 12–24 months out; constrained supply supports both.
Investment metrics
- 1% rule
- 1.06% ✓
- Cap rate
- 5.76%
- Cash-on-cash
- -1.91%
- DSCR
- 0.92
- GRM
- 7.9
CMA / ARV
- ARV (median comp)
- $231,191
- List price
- $199,000
- Delta
- -7.00%
- Verdict
- FAIR
- Comps
- 20 within 1.0 mi
Show comp detail 12 sales within ~0.75 mi
| Address | Dist | Beds/Ba | Sqft | Sold | Price | $/sf | Match |
|---|---|---|---|---|---|---|---|
| 14571 Misty Meadow Ln | 0.17mi | 3/2.5 | 1,794 (+1%) | 2mo | $265,980 | $148 | 88 |
| 14506 Misty Meadow Ln | 0.20mi | 3/2.5 | 1,886 (+6%) | 1mo | $225,000 | $119 | 79 |
| 781 Country Place Dr #2016 | 0.37mi | 3/2.5 | 1,864 (+5%) | 3mo | $99,900 | $54 | 72 |
| 1147 Country Place Dr | 0.16mi | 3/2.5 | 1,992 (+12%) | 1mo | $270,000 | $136 | 72 |
| 800 Country Place Dr #802 | 0.35mi | 3/3.0 | 1,670 (-6%) | 2mo | $209,990 | $126 | 70 |
| 710 Country Place Dr Unit G | 0.41mi | 3/2.5 | 1,670 (-6%) | 2mo | $255,000 | $153 | 69 |
| 800 Country Place Dr #1204 | 0.32mi | 3/2.5 | 1,951 (+10%) | 3mo | $270,000 | $138 | 66 |
| 1079 Country Place Dr #1079 | 0.14mi | 2/2.5 (-1) | 1,520 (-14%) | 3mo | $225,000 | $148 | 62 |
| 14231 Misty Meadow Ln | 0.31mi | 3/2.5 | 2,024 (+14%) | 1mo | $329,900 | $163 | 61 |
| 14309 Misty Meadow Ln | 0.26mi | 3/3.0 | 2,040 (+15%) | 1mo | $210,000 | $103 | 60 |
| 14690 Perthshire Rd Unit C | 0.50mi | 3/2.5 | 1,978 (+11%) | 1mo | $225,000 | $114 | 57 |
| 14706 Perthshire Rd Unit G | 0.54mi | 3/2.5 | 1,978 (+11%) | 0mo | $239,500 | $121 | 56 |
Match score weights: distance 35% · size 25% · config 20% · recency 20%. Top-matched comps best support the ARV.
Projected returns pro-forma
-3.0% appreciation · 0.0% rent growth · sell at horizon
- IRR
- -23.7%
- Equity multiple
- 0.21×
- Total profit
- $-43,797
- Equity at exit
- $29,672
- IRR
- -35.4%
- Equity multiple
- -0.22×
- Total profit
- $-68,182
- Equity at exit
- $17,206
Cash invested: $55,720 (down + closing). Projections, not guarantees.
Landlord ↔ Tenant lean methodology
- Overall (STATE)
- 87 Strongly Landlord-Friendly
- State Texas
- 87 Strongly Landlord-Friendly · R+5
- County
- — inherits STATE
- City
- — inherits STATE
ZIP-level market 77079
- Rents YoY
- -0.8%
- Active inventory
- 235
- Price-to-rent
- 7.9×
Monthly cashflow live
- Estimated rent
- $2,106 high interval (Pro) →
- Mortgage (P&I)
- −$1,044
- Tax from tax record
- −$358 /mo · $4,291/yr
- Insurance
- −$83
- HOA
- −$268
- Vacancy / Maint / Mgmt
- −$442
- Net cashflow
- $-89
Break-even live
UW: 25.0% down · 7.5% · 30yr · 1.5% tax · 5.0% vac · 8.0% maint · 8.0% mgmt
Financing live
Cash to close
- Down payment
- $49,750
- Closing costs
- $5,970
- Reserves months
- —
- Total cash needed
- —
Loan-product check · same deal, 3 products live
Conventional
25% down · 7.5% · 30yr
- Down + closing
- —
- Monthly P&I
- —
- Monthly cashflow
- —
- DSCR
- —
- Eligible?
- —
Personal DTI + credit; lowest rate.
DSCR
20% down · 8.5% · 30yr
- Down + closing
- —
- Monthly P&I
- —
- Monthly cashflow
- —
- DSCR
- —
- Eligible?
- —
No personal income docs; deal must DSCR.
Hard money
10% down · 12.0% · 12mo
- Down + closing
- —
- Monthly P&I
- —
- Monthly cashflow
- —
- DSCR
- —
- Eligible?
- —
Short-term bridge; refi at stabilization.
Rent comps 31 comps
| Address | Beds | Baths | Sqft | Rent | $/sqft | DOM | Units | Dist |
|---|---|---|---|---|---|---|---|---|
| 14553 Still Meadow Dr Houston, TX | 2.0 | 2.5 | 1264 | $1,900 | $1.50 | 18d | 1 | 0.24mi |
| 1305 Country Place Dr Houston, TX | 3.0 | 2.5 | 1886 | $1,550 | $0.82 | 43d | 1 | 0.25mi |
| 781 Country Place Dr Houston, TX | 2.0–3.0 | 2.0–2.5 | 2264 | $1,800 | $0.80 | 4d | 6 | 0.44mi |
| 777 Bateswood Dr Houston, TX | 2.0 | 1.5–2.0 | 1488 | $1,459 | $0.98 | 5d | 4 | 0.57mi |
| 14759 Perthshire Rd Houston, TX | 2.0 | 1.0 | 1272 | $1,925 | $1.51 | 24d | 1 | 0.58mi |
| 681 Dairy Ashford Rd Houston, TX | 3.0 | 2.0 | 1492 | $1,886 | $1.26 | 43d | 1 | 0.66mi |
| 681 Dairy Ashford Rd Houston, TX | 3.0 | 2.0 | 1492 | $1,886 | $1.26 | 22d | 1 | 0.66mi |
| 738 Bateswood Dr Houston, TX | 1.0–3.0 | 1.0–2.0 | 1010 | $1,459 | $1.44 | 20d | 12 | 0.67mi |
| 14814 Perthshire Rd Houston, TX | 2.0–4.0 | 1.0–2.5 | 1381 | $1,748 | $1.26 | 2d | 81 | 0.69mi |
| 14800 Memorial Dr Houston, TX | 1.0–3.0 | 1.5–3.0 | 1368 | $3,966 | $2.90 | 10d | 21 | 0.73mi |
| 14800 Memorial Dr Houston, TX | 1.0–3.0 | 1.5–3.0 | 1371 | $3,885 | $2.83 | 1d | 14 | 0.73mi |
| 14806 Memorial Dr Houston, TX | 3.0 | 3.0 | 1565 | $2,750 | $1.76 | 43d | 1 | 0.79mi |
| 14855 Memorial Dr Houston, TX | 1.0–2.0 | 1.0–2.0 | 1098 | $2,040 | $1.86 | 1d | 29 | 0.90mi |
| 770 N Eldridge Pkwy Houston, TX | 1.0–3.0 | 1.0–2.0 | 1099 | $2,544 | $2.31 | 2d | 19 | 1.00mi |
| 881 N Eldridge Pkwy Houston, TX | 3.0 | 3.0 | 1766 | $2,483 | $1.41 | 20d | 1 | 1.03mi |
| 881 N Eldridge Pkwy Houston, TX | 3.0 | 3.0 | 1766 | $2,483 | $1.41 | 43d | 1 | 1.03mi |
| 776 N Eldridge Pkwy Houston, TX | 2.0 | 2.0 | 1242 | $1,909 | $1.54 | 43d | 1 | 1.05mi |
| 15100 Turkey Creek Dr Houston, TX | 3.0 | 2.0 | 1766 | $2,648 | $1.50 | 24d | 1 | 1.08mi |
| 875 N Eldridge Pkwy Houston, TX | 1.0–3.0 | 1.0–2.5 | 1197 | $2,688 | $2.25 | 2d | 29 | 1.11mi |
| 632 N Eldridge Pkwy Unit 1258 Houston, TX | 2.0 | 2.0 | 1305 | $1,685 | $1.29 | 43d | 1 | 1.14mi |
| 632 N Eldridge Pkwy Unit 1442 Houston, TX | 2.0 | 2.0 | 1444 | $2,002 | $1.39 | 43d | 1 | 1.14mi |
| 611 N Dairy Ashford Rd Houston, TX | 1.0–2.0 | 1.0–2.0 | 879 | $2,056 | $2.34 | 1d | 19 | 1.15mi |
| 874 Yorkchester Dr Houston, TX | 3.0 | 2.0 | 1282 | $1,620 | $1.26 | 43d | 1 | 1.21mi |
| 15206 Memorial Dr Houston, TX | 3.0 | 2.0 | 1772 | $2,718 | $1.53 | 22d | 1 | 1.25mi |
| 15206 Memorial Dr Houston, TX | 3.0 | 2.0 | 1772 | $2,718 | $1.53 | 43d | 1 | 1.25mi |
| 1200 Dairy Ashford Rd Houston, TX | 1.0–2.0 | 1.0–2.0 | 974 | $1,851 | $1.90 | 2d | 30 | 1.29mi |
| 15200 Memorial Dr Houston, TX | 1.0–2.0 | 1.5–2.0 | 1250 | $2,852 | $2.28 | 2d | 23 | 1.31mi |
| 1200 S Dairy Ashford Rd Houston, TX | 1.0–2.0 | 1.0–2.0 | 1000 | $1,572 | $1.57 | 1d | 13 | 1.37mi |
| 12658 Briar Patch Rd Houston, TX | 4.0 | 3.0 | 2405 | $2,500 | $1.04 | 7d | 1 | 1.38mi |
| 777 S Mayde Creek Dr Houston, TX | 3.0 | 1.0–2.5 | 1279 | $3,011 | $2.35 | 2d | 20 | 1.44mi |
| 935 N Wilcrest Dr Houston, TX | 1.0–2.0 | 1.0–2.5 | 1260 | $2,600 | $2.06 | 1d | 24 | 1.49mi |
HOA detail
- Monthly dues
- $268 · $3,216/yr
- Likely covers
- waterpoolsecurity
Listing history 30 events
-
2026-06-18days on market $199,000 Active 13 DOM
-
2026-06-17days on market $199,000 Active 12 DOM
-
2026-06-16days on market $199,000 Active 11 DOM
-
2026-06-15days on market $199,000 Active 10 DOM
-
2026-06-13days on market $199,000 Active 8 DOM
-
2026-06-09days on market $199,000 Active 4 DOM
-
2026-06-08days on market $199,000 Active 3 DOM
-
2026-06-07pricedays on market $199,000 Active 2 DOM
-
2026-04-28$215,000 Active 807-char remark
-
2026-04-25historical $1,850
-
2026-04-25historical
-
2026-03-26$1,850
-
2026-03-25$225,000 Active
-
2026-03-23historical $1,850
-
2026-03-23historical
-
2026-03-02status Active
-
2026-02-27status Pending
-
2026-02-20$1,850
-
2026-02-17$225,000 Active
-
2026-02-17$325,000 Active
-
2026-02-17historical
-
2019-10-09soldstatus
-
2019-10-08soldstatus Sold
-
2019-09-10status Pending
-
2019-09-04$135,000 Active
-
2007-06-09historical
-
2006-11-14$109,900
-
2003-12-19soldstatus
-
1999-10-01soldstatus $77,000
-
1999-09-28soldstatus
ⓘ Source: listings_history table (triggers on properties + properties_extension) + one-shot
backfill from property_details.listing_events for pre-trigger history.
Tax reassessment forecast TX · Resets to sale price
- Current annual tax
- $4,291 · $358/mo
- Projected year-2 tax
- $4,291 · $358/mo
- Expected delta
- $0/yr ($0/mo · 0.0%)
ⓘ Screening estimate from a state-policy table — verify with the county assessor before closing.
Climate risk First Street
- Flood 3/10 Moderate FEMA zone X (unshaded) · 20% chance over 30 yrs
- Wildfire 4/10 Moderate
- Heat 9/10 Extreme 7 d/yr ≥110°F today · 25 d/yr by 30 yrs out
- Wind 9/10 Extreme 99% chance of damaging wind over 30 yrs
- Air quality 3/10 Moderate 2 unhealthy d/yr today · 3 by 30 yrs out
Nearby sold comps map
Loading sold comps map…
Walkable amenities ~0.75 mi
Loading nearby amenities…
Taxation est. · year 1
- Rental income
- $25,269
- − Mortgage interest
- −$11,147
- − Property taxes
- −$4,291
- − Insurance
- −$995
- − Repairs & maintenance
- −$2,022
- − Management
- −$2,022
- − HOA
- −$3,216
- − Depreciation
- −$5,789
- Taxable loss
- −$4,213
- Est. tax savings @ 24.0%
- +$1,011
- After-tax cash flow
- $-52/yr
For passive investors: Depreciation is non-cash, so a rental often shows a tax loss while cash-flowing — sheltering income. Rental losses are passive: they offset passive income freely, and up to $25,000/yr can offset ordinary (W-2) income if you actively participate and your MAGI is under $100k (phasing out to $0 by $150k); unused losses carry forward. On sale, claimed depreciation is recaptured at up to 25%, and gains may owe capital-gains tax (a 1031 exchange can defer both). Figures are a year-1 estimate at your 24.0% rate — not tax advice; consult a CPA.
Schools (NCES district)
- District
- Spring Branch ISD
- NCES district ID
- 4841100
- Math proficiency
- 47% ▼ -4.00%
- Reading proficiency
- 46% ▼ -1.00%
- Median HH income
- $60,311
- Composite
- 40.88/100
- National rank
- #3624
- State rank
- #215 of 826 in TX
Livability — Houston
- Score
- 74/100
- State rank
- #184
- US rank
- #4771
Category grades
Schools grade is shown separately in the Schools card above.
Census & demographics
- Census place
- Houston, TX
- County
- Harris County · 4,702,590 people
- City population
- 3,226,434
- Metro
- Houston-The Woodlands-Sugar Land, TX
- Population (ZIP)
- 37,276
- Household income
- $101,995
- Rent vs Own
- Severe rent burden
- 1811.0
Population outlook (Harris County) Hauer SSP2
- Today (2025)
- 5,571,493 people
- By 2030
- 6,089,821 · +9.3%
- By 2040
- 7,142,806 · +28.2%
- By 2050
- 8,185,864 · +46.9%
- By 2075
- 10,574,329 · +89.8%
- By 2100
- 12,109,958 · +117.4%
Race, ethnicity, and origin ACS 2023
- Neighborhood character
- Diverse neighborhood (Simpson 0.64)
- Race & ethnicity
- White 55% Hispanic / Latino 20% Two or more races 15% Black 13% Asian 8%
- Hispanic origin (detail)
- Mexican 10% Cuban 1%
- Common ancestry
- Lithuanian 4% Slovak 2% Italian 2%
- Foreign-born
- 25% · Canada, Jamaica, China
- Languages at home
- 69% English-only · Spanish 15% Other Indo-European 5% Chinese 2%
Political lean MEDSL · Harris
- 2024 margin
- Lean D (+5.5) · D 52.0% · R 46.4% · Other 1.6%
- 2008→2024 swing
- +3.9pp toward D · 2008: 1.6pp · 2024: 5.5pp
- All cycles
- 2024: D+5.5 2020: D+13.3 2016: D+12.4 2012: D+0.1 2008: D+1.6
Not yet ingested
- Civics
- —
Market trends
- HPI YoY
- ▼ -316.55%
- Current HPI
- 286.7958
- Rent YoY
- ▼ -0.80%
- Metro
- Houston-The Woodlands-Sugar Land, TX
- State GDP YoY
- ▲ 3.95%
- F500 in state
- 110
Industry mix (Fortune 500 HQ in TX)
| Industry | F500 HQs | Revenue |
|---|---|---|
| Energy | 16 | $1,198B |
|
||
| Technology | 5 | $198B |
|
||
| Engineering / Construction | 4 | $72B |
|
||
| Energy Services | 3 | $60B |
|
||
| Utilities | 3 | $41B |
|
||
| Healthcare | 2 | $330B |
|
||
Price history
+158.4% since first listed24 events — show timeline
- 2026-06-05 Listed $199,000 HARMLS
- 2026-05-30 Listing Removed — HARMLS
- 2026-04-28 Listed $215,000 HARMLS
- 2026-04-25 Rental Removed $1,850 HARMLS
- 2026-04-25 Listing Removed — HARMLS
- 2026-03-26 Listed for Rent $1,850 HARMLS
- 2026-03-25 Listed $225,000 HARMLS
- 2026-03-23 Rental Removed $1,850 HARMLS
- 2026-03-23 Listing Removed — HARMLS
- 2026-03-02 Relisted — HARMLS
- 2026-02-27 Pending — HARMLS
- 2026-02-20 Listed for Rent $1,850 HARMLS
- 2026-02-17 Listed $325,000 HARMLS
- 2026-02-17 Listing Removed — HARMLS
- 2026-02-17 Listed $225,000 HARMLS
- 2019-10-09 Sold (Public Records) — Public Records
- 2019-10-08 Sold (MLS) — HARMLS
- 2019-09-10 Pending — HARMLS
- 2019-09-04 Listed $135,000 HARMLS
- 2007-06-09 Listing Removed — HARMLS
- 2006-11-14 Listed $109,900 HARMLS
- 2003-12-19 Sold (Public Records) — Public Records
- 1999-10-01 Sold (Public Records) $77,000 Public Records
- 1999-09-28 Sold (Public Records) — Public Records
Property tax history
+5.8%/yrLatest (2025): $4,291 · +8.3% YoY. Source: county tax records.
Cash-flow waterfall
monthlySold comps — $/sqft
last 12 mo · ≤1 miLoading sold comps…