3712 Arroyo Seco Ln #85 · North Highlands, CA
Flood risk 1/10 · Minimal
- FEMA flood zone
- X (unshaded)
- Chance of flooding over 30 yrs
- 0.0%
- Est. flood insurance / yr
- $507 – $1,088
Fire risk 2/10 · Minimal
- Est. fire insurance / yr
- $659 – $1,223
Heat risk 7/10 · Major
- Hot days now (above 102°F)
- 7 days/yr
- Hot days in 30 yrs
- 15 days/yr
Wind risk 1/10 · Minimal
- Chance of severe wind over 30 yrs
- —
Air-quality risk 10/10 · Severe
- Unhealthy air days now
- 34 days/yr
- Unhealthy air days in 30 yrs
- 38 days/yr
Risk factors via First Street. Map © Google.
Why this score? — see what drove the B+ grade
The composite is a weighted blend of 9 inputs, each scored 0–100. Each bar is that input's sub-score; the figure is the points it added to the 100-point composite (weight × sub-score).
- Cash flow +30.0/30.0
- ARV discount +15.0/15.0
- 1% rule +10.0/10.0
- DSCR +10.0/10.0
- Rent growth +3.9/5.0
- Schools +3.1/10.0
- Livability +3.1/5.0
- Condition / age +2.8/5.0
- Appreciation +0.0/10.0
$65,900
🖨 Deal sheet (PDF) 📄 Offer letter ✓ Due diligence
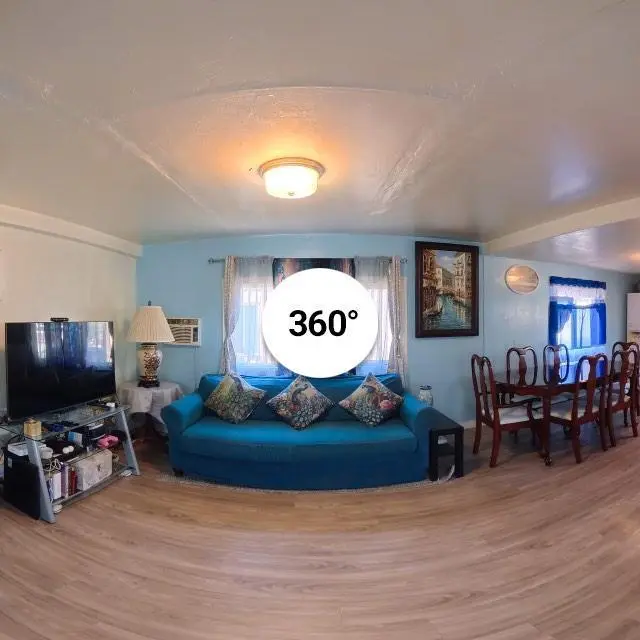
Listing remarks
Priced reduction! Great opportunity to own this Spacious 4-bedroom manufactured home conveniently located near schools, shopping, and everyday amenities. The home offers 4 parking spaces and was originally a single-wide mobile home with an owner expansion completed approximately 3 years ago, creating additional living space. The property includes a small garden area with a variety of plants and fruit trees, including mint and aloe vera (sbila), offering a pleasant outdoor space. Community amenities include a swimming pool, basketball court, and a community hall available for private events and gatherings for a small fee. A great opportunity for buyers seeking comfortable living with access
Key facts
- 4 parking spots
- Built 1966
- Listed 174 days
Neighborhood map
What this means for you Summary
Snapshot
- This is a 4-bed/1.0-bath manufactured listed at $66k. Condition is rated average.
Deal economics
- At list price, monthly cash flow is $2k ($20k/yr) — positive.
- The deal already cash-flows at list — no discount required.
- Meets the 1% rule at list price ($3k rent vs $66k).
- Recommended offer: $58k (12.0% below list) — sets the bar for market timing.
- Cap rate 36.2% vs local median 4.1% in North Highlands — top-decile yield for the area; either an underpriced asset or a hidden risk that comps aren't pricing in. Stress-test before assuming the spread holds.
Location & tenants
- Location reads 61/100 on livability (#523 in CA) — a middle-class / working-renter tenant base. Strengths: housing A+; Watch: employment C-, crime F, amenities F.
- Twin Rivers Unified (suburban): math 29% / reading 37% proficiency, ranked #970 of 1,400 in CA (top 69%) — families likely to look elsewhere, expect single-tenant / working-renter base with shorter leases; 76% free/reduced lunch — lower-income household profile, screen leases tightly.
- Zoned schools: Village Elementary (407 students, 91% FRL); Highlands High (744 students, 90% FRL).
- Market conditions: Rents rising fast (+5.7%/yr); 110 active listings in the ZIP; 25 comparable units currently listed for rent nearby; rentals leasing fast (median 9d on market — plan ~1-2 weeks tenant-placement turnaround); 6,825 units permitted in Sacramento County in 2024 (1,752 in 5+ unit buildings).
- At $2,654/mo this rent would consume 47% of the median local household income ($68k/yr) (locally 1300% of renters already pay >50% of income on rent) — very limited rent-growth headroom before tenants either downsize or default.
Forward outlook
- Local home prices are declining (-3.0%/yr); year-one equity from $456 of loan paydown is wiped out by about $2k of value loss. Plan a longer hold.
- Sacramento County population projected at +17% by 2050 — long-run rental-demand tailwind backs the buy-and-hold thesis.
- At projected returns (-3.0% appreciation + 5.7% rent growth), your $18k cash investment doubles in ~2 years — after that, you're playing with house money.
Negotiation context
- It's been on market 174 days — a 12% lower offer ($58k) is reasonable based on typical stale-listing flexibility.
Risks & watch-outs
- Climate carrying-cost: extreme-heat days projected 7→15/yr by 2055 (HVAC capex compounding) — expect insurance premiums to compound above CPI over the hold.
Questions for the listing agent
- It's been on market 174 days. Have you received any prior offers? Is the seller open to a 12% concession, seller financing, or rate buy-down credit?
- Built in 1966 — when were the roof, HVAC, electrical panel, plumbing, and water heater last replaced?
- Why hasn't it sold? Are there any deal-killer items the seller is aware of (foundation, flood, title, zoning, code violations)?
- Is there a deadline driving the sale (1031 exchange, divorce, estate, relocation)? That informs how much negotiation room exists.
- Schools are D-rated, which usually means shorter tenancies and higher turnover. Who's the typical renter profile here, and what's been the actual vacancy rate?
- Crime grade is F in this area — have there been break-ins, vandalism, or insurance claims at this property in the last 3 years? What carrier currently insures it and at what premium?
- What's the average days-on-market for RENTAL listings here right now (not sales)? A rising rental-DOM trend means longer vacancies and softer asking-rent achievability than the comps imply.
- What's the recent tenant-quality profile in this submarket — average credit score on applications, eviction rate, late-payment / NSF rate, and stable-employment percentage? A property-management company in the area should have these aggregated.
- How much new for-sale + rental construction is in the pipeline within 1–3 miles? Heavy new supply typically softens prices + rents 12–24 months out; constrained supply supports both.
Investment metrics
- 1% rule
- 4.03% ✓
- Cap rate
- 36.17%
- Cash-on-cash
- 106.72%
- DSCR
- 5.75
- GRM
- 2.1
CMA / ARV
- ARV (median comp)
- $123,088
- List price
- $65,900
- Delta
- -46.46%
- Verdict
- UNDERPRICED
- Comps
- 1 within 2.0 mi
Show comp detail 1 sale within ~0.75 mi
| Address | Dist | Beds/Ba | Sqft | Sold | Price | $/sf | Match |
|---|---|---|---|---|---|---|---|
| 7599 La Bella Cir #72 | 0.03mi | 5/2.0 (+1) | 1,200 (+5%) | 23mo | $180,000 | $150 | 62 |
Match score weights: distance 35% · size 25% · config 20% · recency 20%. Top-matched comps best support the ARV.
Projected returns pro-forma
-3.0% appreciation · 5.69% rent growth · sell at horizon
- IRR
- —
- Equity multiple
- 6.49×
- Total profit
- $101,254
- Equity at exit
- $9,826
- IRR
- —
- Equity multiple
- 14.81×
- Total profit
- $254,897
- Equity at exit
- $5,698
Cash invested: $18,452 (down + closing). Projections, not guarantees.
Landlord ↔ Tenant lean methodology
- Overall (STATE)
- 18 Strongly Tenant-Friendly
- State California
- 18 Strongly Tenant-Friendly · D+13
- County
- — inherits STATE
- City
- — inherits STATE
ZIP-level market 95660
- Rents YoY
- 5.7%
- Active inventory
- 110
- Price-to-rent
- 2.1×
Monthly cashflow live
- Estimated rent
- $2,654 high interval (Pro) →
- Mortgage (P&I)
- −$346
- Tax est. 1.5%
- −$82 /mo · $988/yr
- Insurance
- −$27
- HOA
- −$0
- Vacancy / Maint / Mgmt
- −$557
- Net cashflow
- $1,641
Break-even live
Sensitivity live
| Price | -10% $1,687 | -5% $1,664 | +0% $1,641 | +5% $1,618 | +10% $1,595 |
|---|---|---|---|---|---|
| Rent | -10% $1,431 | -5% $1,536 | +0% $1,641 | +5% $1,746 | +10% $1,851 |
| Rate | -1.0pp $1,674 | -0.5pp $1,658 | base $1,641 | +0.5pp $1,624 | +1.0pp $1,607 |
UW: 25.0% down · 7.5% · 30yr · 1.5% tax · 5.0% vac · 8.0% maint · 8.0% mgmt
Financing live
Cash to close
- Down payment
- $16,475
- Closing costs
- $1,977
- Reserves months
- —
- Total cash needed
- —
Loan-product check · same deal, 3 products live
Conventional
25% down · 7.5% · 30yr
- Down + closing
- —
- Monthly P&I
- —
- Monthly cashflow
- —
- DSCR
- —
- Eligible?
- —
Personal DTI + credit; lowest rate.
DSCR
20% down · 8.5% · 30yr
- Down + closing
- —
- Monthly P&I
- —
- Monthly cashflow
- —
- DSCR
- —
- Eligible?
- —
No personal income docs; deal must DSCR.
Hard money
10% down · 12.0% · 12mo
- Down + closing
- —
- Monthly P&I
- —
- Monthly cashflow
- —
- DSCR
- —
- Eligible?
- —
Short-term bridge; refi at stabilization.
Rent comps 25 comps
| Address | Beds | Baths | Sqft | Rent | $/sqft | DOM | Units | Dist |
|---|---|---|---|---|---|---|---|---|
| 3825 Little Rock Dr Antelope, CA | 1.0–3.0 | 1.0–2.0 | 848 | $2,500 | $2.95 | 0d | 5 | 0.24mi |
| 4196 Worthington Dr North Highlands, CA | 3.0 | 2.0 | 1200 | $2,350 | $1.96 | 9d | 1 | 0.65mi |
| 3700 Navaho Dr Antelope, CA | 2.0–4.0 | 1.0–2.5 | 1308 | $3,150 | $2.41 | 0d | 9 | 0.68mi |
| 6909 Stoneman Dr North Highlands, CA | 3.0 | 1.0 | 1113 | $1,995 | $1.79 | 14d | 1 | 0.71mi |
| 4249 Worthington Dr North Highlands, CA | 4.0 | 2.0 | 1364 | $2,500 | $1.83 | 45d | 1 | 0.73mi |
| 3131 Scotland Dr Unit A Antelope, CA | 3.0 | 2.0 | 1200 | $2,500 | $2.08 | 6d | 1 | 0.86mi |
| 3844 Milton Way North Highlands, CA | 3.0 | 1.5 | 972 | $2,250 | $2.31 | 3d | 1 | 0.89mi |
| 3320 Saxonville Way Antelope, CA | 3.0 | 2.0 | 1235 | $2,500 | $2.02 | 9d | 1 | 0.90mi |
| 8082 Quiet Knolls Dr Antelope, CA | 3.0 | 2.5 | 1411 | $2,475 | $1.75 | 0d | 1 | 1.03mi |
| 8086 Quiet Knolls Dr Antelope, CA | 3.0 | 2.5 | 1436 | $2,475 | $1.72 | 0d | 1 | 1.04mi |
| 3237 Lowther Way Antelope, CA | 3.0 | 2.5 | 1392 | $2,595 | $1.86 | 6d | 1 | 1.04mi |
| 6629 Medora Dr North Highlands, CA | 3.0 | 2.0 | 1090 | $1,995 | $1.83 | 45d | 1 | 1.09mi |
| 6625 Medora Dr North Highlands, CA | 3.0 | 1.0 | 972 | $2,100 | $2.16 | 12d | 1 | 1.09mi |
| 8020 Walerga Rd Antelope, CA | 2.0–3.0 | 2.0 | 1014 | $2,800 | $2.76 | 9d | 2 | 1.15mi |
| 3704 Pinehill Way Antelope, CA | 3.0 | 2.0 | 1445 | $2,725 | $1.89 | 14d | 1 | 1.15mi |
| 3624 Van Owen St North Highlands, CA | 4.0 | 2.0 | 1232 | $2,200 | $1.79 | 23d | 1 | 1.17mi |
| 8449 Bramble Bush Cir Antelope, CA | 3.0 | 2.0 | 1381 | $2,695 | $1.95 | 45d | 1 | 1.20mi |
| 6436 Thomas Dr North Highlands, CA | 4.0 | 2.0 | 1272 | $2,395 | $1.88 | 3d | 1 | 1.22mi |
| 6436 Thomas Dr North Highlands, CA | 4.0 | 2.0 | 1272 | $2,395 | $1.88 | 13d | 1 | 1.22mi |
| 4400 Shandwick Dr Antelope, CA | 1.0–3.0 | 1.0–2.0 | 876 | $2,514 | $2.87 | 0d | 13 | 1.25mi |
| 8020 Walerga Rd #1276 Antelope, CA | 3.0 | 2.0 | 1193 | $2,800 | $2.35 | 16d | 1 | 1.31mi |
| 8337 Scrub Oak Way Antelope, CA | 3.0 | 2.0 | 1381 | $2,450 | $1.77 | 25d | 1 | 1.31mi |
| 8303 Walerga Rd Antelope, CA | 1.0–3.0 | 1.0–2.0 | 894 | $3,351 | $3.75 | 0d | 10 | 1.36mi |
| 7330 Stratford Pl #706 Sacramento, CA | 3.0 | 2.0 | 1322 | $2,600 | $1.97 | 3d | 1 | 1.42mi |
| 4150 Munich Ct Antelope, CA | 3.0 | 2.0 | 1229 | $2,595 | $2.11 | 45d | 1 | 1.43mi |
Listing history 12 events
-
2026-06-17status $65,900 Pending 174 DOM
-
2026-06-16days on market $65,900 Active 174 DOM
-
2026-06-15days on market $65,900 Active 173 DOM
-
2026-06-13days on market $65,900 Active 171 DOM
-
2026-06-13days on market $65,900 Active 170 DOM
-
2026-06-09days on market $65,900 Active 169 DOM
-
2026-06-08days on market $65,900 Active 168 DOM
-
2026-06-07days on market $65,900 Active 167 DOM
-
2026-06-03days on market $65,900 Active 163 DOM
-
2026-06-02days on market $65,900 Active 162 DOM
-
2026-06-01days on market $65,900 Active 161 DOM
-
2026-05-31days on market $65,900 Active 160 DOM
ⓘ Source: listings_history table (triggers on properties + properties_extension) + one-shot
backfill from property_details.listing_events for pre-trigger history.
Climate risk First Street
- Flood 1/10 Low FEMA zone X (unshaded) · 0% chance over 30 yrs
- Wildfire 2/10 Low
- Heat 7/10 Severe 7 d/yr ≥102°F today · 15 d/yr by 30 yrs out
- Wind 1/10 Low
- Air quality 10/10 Extreme 34 unhealthy d/yr today · 38 by 30 yrs out
Nearby sold comps map
Loading sold comps map…
Walkable amenities ~0.75 mi
Loading nearby amenities…
Taxation est. · year 1
- Rental income
- $31,845
- − Mortgage interest
- −$3,691
- − Property taxes
- −$988
- − Insurance
- −$330
- − Repairs & maintenance
- −$2,548
- − Management
- −$2,548
- − Depreciation
- −$1,917
- Taxable income
- $19,823
- Est. tax owed @ 24.0%
- −$4,757
- After-tax cash flow
- $14,935/yr
For passive investors: Depreciation is non-cash, so a rental often shows a tax loss while cash-flowing — sheltering income. Rental losses are passive: they offset passive income freely, and up to $25,000/yr can offset ordinary (W-2) income if you actively participate and your MAGI is under $100k (phasing out to $0 by $150k); unused losses carry forward. On sale, claimed depreciation is recaptured at up to 25%, and gains may owe capital-gains tax (a 1031 exchange can defer both). Figures are a year-1 estimate at your 24.0% rate — not tax advice; consult a CPA.
Condition & rehab AI · 12 photos
This 4-bedroom manufactured home requires moderate repairs and maintenance to improve its condition and value. Key updates include painting the exterior and interior, refinishing the flooring, and cleaning the countertops to enhance both resale and rental appeal.
Repairs flagged
- Minor Kitchen cabinets — Worn condition
- Minor Shower curtain rod — Loose and may fall
- Moderate Exterior siding — Weathered and may need repainting
- Moderate Hardwood flooring — Worn and may need refinishing
- Moderate Paint — Faded and may need repainting
- Minor Blinds — Dusty and may need cleaning
Value-add opportunities
- Resale Paint exterior siding — Fresh paint enhances curb appeal
- Resale Refinish hardwood flooring — Refinished floors improve aesthetics
- Resale Repaint interior walls — Fresh paint improves interior appearance
- Rental Clean countertops — Cleaner countertops attract renters
- Both Tighten shower curtain rod — Fixing loose rod prevents accidents and improves aesthetics
Renovation cost estimate screening
| Repair item | Severity | Est. cost |
|---|---|---|
| Kitchen cabinets · Worn condition | Minor | $500–3,000 |
| Shower curtain rod · Loose and may fall | Minor | $500–3,000 |
| Exterior siding · Weathered and may need repainting | Moderate | $3,000–15,000 |
| Hardwood flooring · Worn and may need refinishing | Moderate | $3,000–15,000 |
| Paint · Faded and may need repainting | Moderate | $3,000–15,000 |
| Blinds · Dusty and may need cleaning | Minor | $500–3,000 |
| Total estimated repair cost · 6 items | $10,500–54,000 |
Value-add ROI direction
- Resale Paint exterior siding — Fresh paint enhances curb appeal ↑
- Resale Refinish hardwood flooring — Refinished floors improve aesthetics ↑
- Resale Repaint interior walls — Fresh paint improves interior appearance ↑
- Rental Clean countertops — Cleaner countertops attract renters ↑
- Both Tighten shower curtain rod — Fixing loose rod prevents accidents and improves aesthetics ↑
ⓘ Cost ranges are severity-bucket heuristics (US national rule-of-thumb). Get contractor quotes + a written scope before underwriting a rehab budget.
Schools (NCES district)
- District
- Twin Rivers Unified
- NCES district ID
- 0601332
- Math proficiency
- 29% ▲ 2.00%
- Reading proficiency
- 37% ▲ 2.00%
- Median HH income
- $42,481
- Composite
- 30.67/100
- National rank
- #11437
- State rank
- #970 of 1400 in CA
Livability — North Highlands
- Score
- 61/100
- State rank
- #523
- US rank
- #17613
Category grades
Schools grade is shown separately in the Schools card above.
Census & demographics
- Census place
- North Highlands, CA
- County
- Sacramento County · 1,539,646 people
- City population
- 56,900
- Metro
- Sacramento-Roseville-Folsom, CA
- Population (ZIP)
- 35,451
- Household income
- $68,235
- Rent vs Own
- Severe rent burden
- 1300.0
Population outlook (Sacramento County) Hauer SSP2
- Today (2025)
- 1,660,763 people
- By 2030
- 1,732,990 · +4.3%
- By 2040
- 1,855,755 · +11.7%
- By 2050
- 1,941,335 · +16.9%
- By 2075
- 2,046,162 · +23.2%
- By 2100
- 1,961,444 · +18.1%
Race, ethnicity, and origin ACS 2023
- Neighborhood character
- Diverse neighborhood (Simpson 0.69)
- Race & ethnicity
- White 41% Hispanic / Latino 37% Two or more races 16% Black 9% Asian 7%
- Hispanic origin (detail)
- Mexican 29%
- Common ancestry
- Subsaharan African 5% Scotch-Irish 2% Scandinavian 2%
- Foreign-born
- 28% · Canada, Vietnam
- Languages at home
- 56% English-only · Spanish 25% Russian/Polish/Slavic 9% Other Indo-European 5%
Political lean MEDSL · Sacramento
- 2024 margin
- D (+19.7) · D 58.1% · R 38.4% · Other 3.5%
- 2008→2024 swing
- +0.7pp no change · 2008: 19.0pp · 2024: 19.7pp
- All cycles
- 2024: D+19.7 2020: D+25.3 2016: D+23.7 2012: D+16.3 2008: D+19.0
Not yet ingested
- Civics
- —
Market trends
- HPI YoY
- ▼ -273.83%
- Current HPI
- 438.1022
- Rent YoY
- ▲ 5.69%
- Metro
- Sacramento-Roseville-Folsom, CA
- State GDP YoY
- ▲ 3.21%
- F500 in state
- 116
Industry mix (Fortune 500 HQ in CA)
| Industry | F500 HQs | Revenue |
|---|---|---|
| Technology | 27 | $1,492B |
|
||
| Financial Services | 3 | $174B |
|
||
| Retail | 3 | $44B |
|
||
| Insurance | 3 | $26B |
|
||
| Media / Entertainment | 2 | $115B |
|
||
| Pharmaceuticals / Biotech | 2 | $62B |
|
||
Cash-flow waterfall
monthlySold comps — $/sqft
last 12 mo · ≤1 miLoading sold comps…