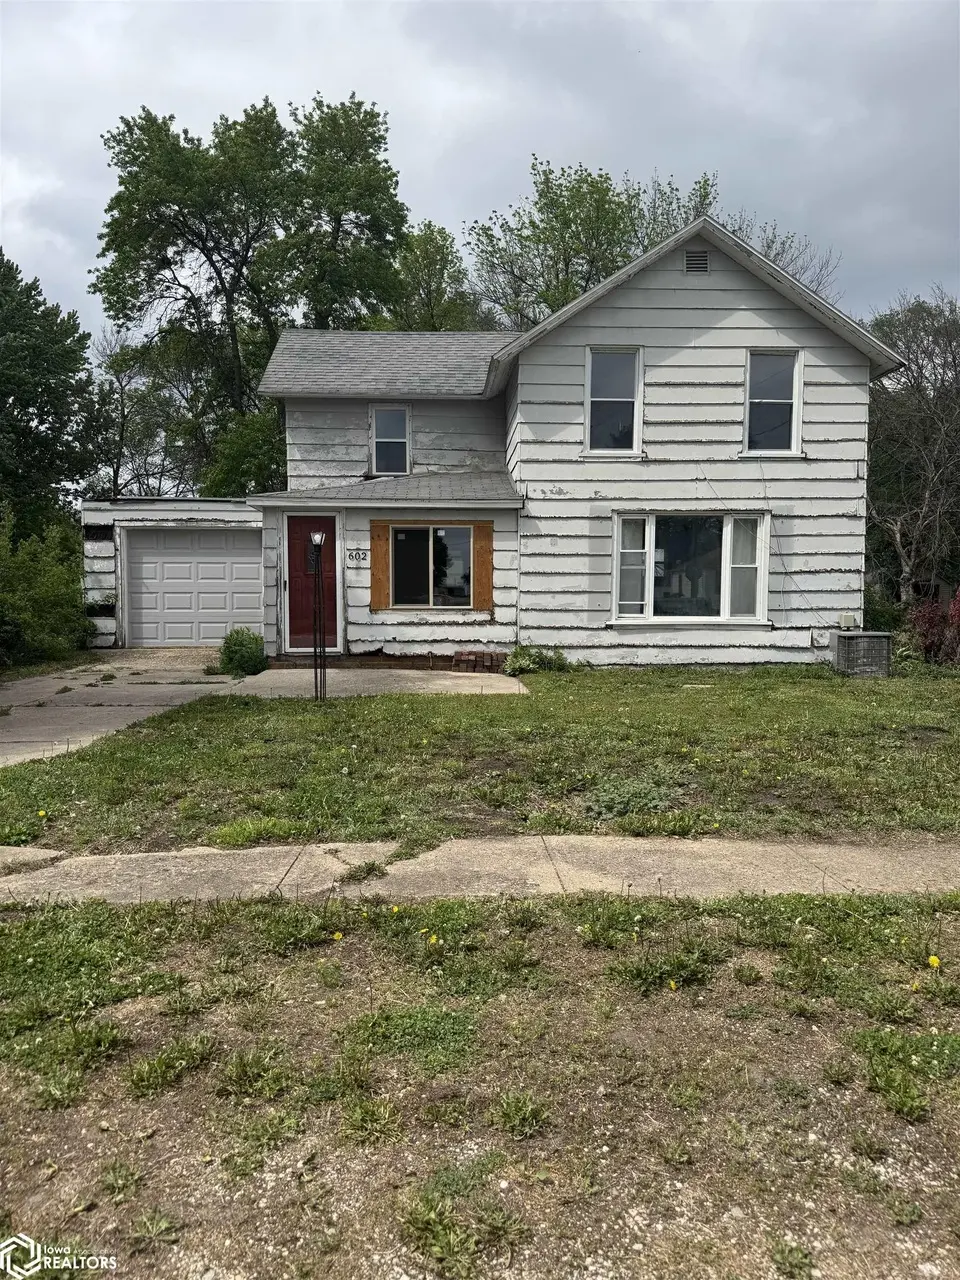
602 3rd Ave · Livermore, IA
Flood risk 1/10 · Minimal
- FEMA flood zone
- X (unshaded)
- Chance of flooding over 30 yrs
- 0.0%
- Est. flood insurance / yr
- $473 – $860
Fire risk 2/10 · Minimal
- Est. fire insurance / yr
- $902 – $1,676
Heat risk 2/10 · Minimal
- Hot days now (above 101°F)
- 7 days/yr
- Hot days in 30 yrs
- 16 days/yr
Wind risk 2/10 · Minimal
- Chance of severe wind over 30 yrs
- —
Air-quality risk 1/10 · Minimal
- Unhealthy air days now
- 0 days/yr
- Unhealthy air days in 30 yrs
- 0 days/yr
Risk factors via First Street. Map © Google.
Why this score? — see what drove the B+ grade
The composite is a weighted blend of 9 inputs, each scored 0–100. Each bar is that input's sub-score; the figure is the points it added to the 100-point composite (weight × sub-score).
- Cash flow +30.0/30.0
- 1% rule +10.0/10.0
- DSCR +10.0/10.0
- ARV discount +7.5/15.0
- Appreciation +7.1/10.0
- Schools +4.4/10.0
- Livability +3.3/5.0
- Rent growth +2.5/5.0
- Condition / age +2.5/5.0
$45,000
🖨 Deal sheet 📄 Offer letter ✓ Due diligence
Listing remarks
Fixer upper with a great head start and tons of potential! Some big projects are already underway, including some flooring removal and most windows replaced. The main floor welcomes you with an enclosed porch, a kitchen open to the dining area, a bright living room with a large picture window, a bedroom, full bath, and convenient laundry area. Upstairs, you’ll find three additional bedrooms—perfect for family, guests, or a home office. Bring your vision and make this home your own! Being sold AS IS.
Key facts
- Large picture window
- Bright living room
- Enclosed porch
Tags
Property features AI
Exterior
- Parking: Attached garage (1 car)
- Utilities: Public water; Public sewer
- Home design: One and one-half story single-family residence; Residential property
- Construction: HardiPlank and vinyl siding; One and one-half story construction
- Exterior features: Lot measures approximately 60 x 150 (0.21 acres)
Interior
- Bathrooms: One full bathroom
- Heating & cooling: Central air conditioning; Forced air heating
- Interior features: Basement
Neighborhood map
What this means for you Summary
Snapshot
- This is a 4-bed/1.0-bath single-family listed at $45k.
Deal economics
- At list price, monthly cash flow is $591 ($7k/yr) — positive.
- The deal already cash-flows at list — no discount required.
- Meets the 1% rule at list price ($1k rent vs $45k).
- Recommended offer: $44k (3.0% below list) — sets the bar for market timing.
Location & tenants
- Location reads 66/100 on livability (#541 in IA) — a middle-class / working-renter tenant base. Strengths: cost of living A+, housing A+, employment B; Watch: health & safety C-, schools F, amenities F.
- Twin Rivers Community School District (rural): math 60% / reading 40% proficiency, ranked #323 of 330 in IA (top 98%) — acceptable for families but not a draw, mixed tenant base, ~2y average lease.
- Market conditions: 3 active listings in the ZIP; 13 units permitted in Humboldt County in 2024 (0 in 5+ unit buildings).
Forward outlook
- In year one you build about $2k of equity ($311 loan paydown + $2k appreciation (4.1% local appreciation)).
- Humboldt County population projected to shrink 9% by 2050 — rents likely to lag national; underwrite the cash flow, not the appreciation.
- At projected returns (4.1% appreciation + 3.0% rent growth), your $13k cash investment doubles in ~2 years — after that, you're playing with house money.
Negotiation context
- It's been on market 31 days — a 3% lower offer ($44k) is reasonable based on typical stale-listing flexibility.
Risks & watch-outs
- Watch-outs: built in 1940 — expect roof / HVAC / electrical / plumbing capex.
Questions for the listing agent
- It's been on market 31 days. Have you received any prior offers? Is the seller open to a 3% concession, seller financing, or rate buy-down credit?
- Built in 1940 — when were the roof, HVAC, electrical panel, plumbing, and water heater last replaced?
- Is there a deadline driving the sale (1031 exchange, divorce, estate, relocation)? That informs how much negotiation room exists.
- Schools are F-rated, which usually means shorter tenancies and higher turnover. Who's the typical renter profile here, and what's been the actual vacancy rate?
- What's the average days-on-market for RENTAL listings here right now (not sales)? A rising rental-DOM trend means longer vacancies and softer asking-rent achievability than the comps imply.
- What's the recent tenant-quality profile in this submarket — average credit score on applications, eviction rate, late-payment / NSF rate, and stable-employment percentage? A property-management company in the area should have these aggregated.
- How much new for-sale + rental construction is in the pipeline within 1–3 miles? Heavy new supply typically softens prices + rents 12–24 months out; constrained supply supports both.
Investment metrics
- 1% rule
- 2.51% ✓
- Cap rate
- 22.04%
- Cash-on-cash
- 56.25%
- DSCR
- 3.50
- GRM
- 3.3
CMA / ARV
- ARV (on-the-fly)
- $97,120
- Comps found
- 3
Show comp detail 3 sales within ~0.75 mi
| Address | Dist | Beds/Ba | Sqft | Sold | Price | $/sf | Match |
|---|---|---|---|---|---|---|---|
| 608 3rd Avenue Ave | 0.05mi | 3/1.0 (-1) | 1,203 (-1%) | 16mo | $55,000 | $46 | 78 |
| 403 2nd St | 0.37mi | 3/2.0 (-1) | 1,088 (-10%) | 4mo | $87,000 | $80 | 53 |
| 405 3rd St | 0.30mi | 3/2.0 (-1) | 1,284 (+6%) | 17mo | $170,000 | $132 | 53 |
Match score weights: distance 35% · size 25% · config 20% · recency 20%. Top-matched comps best support the ARV.
Projected returns pro-forma
4.13% appreciation · 3.0% rent growth · sell at horizon
- IRR
- 62.5%
- Equity multiple
- 4.64×
- Total profit
- $45,803
- Equity at exit
- $23,166
- IRR
- 61.0%
- Equity multiple
- 9.50×
- Total profit
- $107,119
- Equity at exit
- $38,171
Cash invested: $12,600 (down + closing). Projections, not guarantees.
Landlord ↔ Tenant lean methodology
- Overall (STATE)
- 83 Strongly Landlord-Friendly
- State Iowa
- 83 Strongly Landlord-Friendly · R+6
- County
- — inherits STATE
- City
- — inherits STATE
ZIP-level market 50558
- Home prices YoY
- 3.9%
- Active inventory
- 3
- Price-to-rent
- 3.3×
Monthly cashflow live
- Estimated rent
- $1,130 medium interval (Pro) →
- Mortgage (P&I)
- −$236
- Tax from tax record
- −$47 /mo · $564/yr
- Insurance
- −$19
- HOA
- −$0
- Vacancy / Maint / Mgmt
- −$237
- Net cashflow
- $591
Break-even live
UW: 25.0% down · 7.5% · 30yr · 1.5% tax · 5.0% vac · 8.0% maint · 8.0% mgmt
Financing live
Cash to close
- Down payment
- $11,250
- Closing costs
- $1,350
- Reserves months
- —
- Total cash needed
- —
Loan-product check · same deal, 3 products live
Conventional
25% down · 7.5% · 30yr
- Down + closing
- —
- Monthly P&I
- —
- Monthly cashflow
- —
- DSCR
- —
- Eligible?
- —
Personal DTI + credit; lowest rate.
DSCR
20% down · 8.5% · 30yr
- Down + closing
- —
- Monthly P&I
- —
- Monthly cashflow
- —
- DSCR
- —
- Eligible?
- —
No personal income docs; deal must DSCR.
Hard money
10% down · 12.0% · 12mo
- Down + closing
- —
- Monthly P&I
- —
- Monthly cashflow
- —
- DSCR
- —
- Eligible?
- —
Short-term bridge; refi at stabilization.
Listing history 16 events
-
2026-06-18days on market $45,000 Active 31 DOM
-
2026-06-17days on market $45,000 Active 30 DOM
-
2026-06-16days on market $45,000 Active 29 DOM
-
2026-06-15days on market $45,000 Active 28 DOM
-
2026-06-13days on market $45,000 Active 26 DOM
-
2026-06-12days on market $45,000 Active 25 DOM
-
2026-06-09days on market $45,000 Active 22 DOM
-
2026-06-08days on market $45,000 Active 21 DOM
-
2026-06-07days on market $45,000 Active 20 DOM
-
2026-06-05days on market $45,000 Active 18 DOM
-
2026-06-04days on market $45,000 Active 16 DOM
-
2026-06-02days on market $45,000 Active 15 DOM
-
2026-06-01days on market $45,000 Active 14 DOM
-
2026-05-31days on market $45,000 Active 13 DOM
-
2026-05-31days on market $45,000 Active 12 DOM
-
2026-05-18$45,000 Active
ⓘ Source: listings_history table (triggers on properties + properties_extension) + one-shot
backfill from property_details.listing_events for pre-trigger history.
Tax reassessment forecast IA · Partial reset (capped growth)
- Current annual tax
- $564 · $47/mo
- Projected year-2 tax
- $635 · $53/mo
- Expected delta
- +$71/yr (+$6/mo · 12.6%)
ⓘ Screening estimate from a state-policy table — verify with the county assessor before closing.
Climate risk First Street
- Flood 1/10 Low FEMA zone X (unshaded) · 0% chance over 30 yrs
- Wildfire 2/10 Low
- Heat 2/10 Low 7 d/yr ≥101°F today · 16 d/yr by 30 yrs out
- Wind 2/10 Low
- Air quality 1/10 Low 0 unhealthy d/yr today · 0 by 30 yrs out
Nearby sold comps map
Loading sold comps map…
Walkable amenities ~0.75 mi
Loading nearby amenities…
Taxation est. · year 1
- Rental income
- $13,554
- − Mortgage interest
- −$2,521
- − Property taxes
- −$564
- − Insurance
- −$225
- − Repairs & maintenance
- −$1,084
- − Management
- −$1,084
- − Depreciation
- −$1,309
- Taxable income
- $6,767
- Est. tax owed @ 24.0%
- −$1,624
- After-tax cash flow
- $5,463/yr
For passive investors: Depreciation is non-cash, so a rental often shows a tax loss while cash-flowing — sheltering income. Rental losses are passive: they offset passive income freely, and up to $25,000/yr can offset ordinary (W-2) income if you actively participate and your MAGI is under $100k (phasing out to $0 by $150k); unused losses carry forward. On sale, claimed depreciation is recaptured at up to 25%, and gains may owe capital-gains tax (a 1031 exchange can defer both). Figures are a year-1 estimate at your 24.0% rate — not tax advice; consult a CPA.
Schools (NCES district)
- District
- Twin Rivers Community School District
- NCES district ID
- 1928200
- Math proficiency
- 60% ▼ -20.00%
- Reading proficiency
- 40% ▼ -40.00%
- Median HH income
- $45,541
- Composite
- 44.42/100
- National rank
- #6104
- State rank
- #323 of 330 in IA
Livability — Livermore
- Score
- 66/100
- State rank
- #541
- US rank
- #12108
Category grades
Schools grade is shown separately in the Schools card above.
Census & demographics
- Census place
- Livermore, IA
- Population (ZIP)
- 745
Population outlook (Humboldt County) Hauer SSP2
- Today (2025)
- 9,265 people
- By 2030
- 9,141 · -1.3%
- By 2040
- 8,904 · -3.9%
- By 2050
- 8,448 · -8.8%
- By 2075
- 7,742 · -16.4%
- By 2100
- 6,414 · -30.8%
Race, ethnicity, and origin ACS 2023
- Neighborhood character
- Predominantly White (90%)
- Race & ethnicity
- White 90% Hispanic / Latino 7% Two or more races 2%
- Hispanic origin (detail)
- Mexican 7%
- Common ancestry
- Portuguese 7% Slovak 3% Lithuanian 1%
- Foreign-born
- 2% · Canada
- Languages at home
- 94% English-only · Spanish 6%
Political lean MEDSL · Humboldt
- 2024 margin
- Solid R (+50.0) · D 24.4% · R 74.4% · Other 1.2%
- 2008→2024 swing
- -35.7pp toward R · 2008: -14.3pp · 2024: -50.0pp
- All cycles
- 2024: R+50.0 2020: R+44.6 2016: R+46.0 2012: R+22.1 2008: R+14.3
Not yet ingested
- Civics
- —
Market trends
- HPI YoY
- ▲ 4.13%
- Current HPI
- 109.1952
- Rent YoY
- —
- Metro
- —
- State GDP YoY
- ▲ 2.48%
- F500 in state
- 4
Industry mix (Fortune 500 HQ in IA)
| Industry | F500 HQs | Revenue |
|---|---|---|
| Financial Services | 1 | $16B |
|
||
| Retail / Convenience | 1 | $15B |
|
||
Price history
1 event — show timeline
- 2026-05-18 Listed $45,000 IAR
Property tax history
+2.6%/yrLatest (2025): $564 · +0.0% YoY. Source: county tax records.
Cash-flow waterfall
monthlySold comps — $/sqft
last 12 mo · ≤1 miLoading sold comps…