3305 Thomas St · Jacksonville, FL
Flood risk 1/10 · Minimal
- FEMA flood zone
- X (unshaded)
- Chance of flooding over 30 yrs
- 0.0%
- Est. flood insurance / yr
- $507 – $1,088
Fire risk 1/10 · Minimal
- Est. fire insurance / yr
- $947 – $1,759
Heat risk 9/10 · Severe
- Hot days now (above 107°F)
- 7 days/yr
- Hot days in 30 yrs
- 19 days/yr
Wind risk 9/10 · Severe
- Chance of severe wind over 30 yrs
- 99.0%
Air-quality risk 5/10 · Moderate
- Unhealthy air days now
- 7 days/yr
- Unhealthy air days in 30 yrs
- 7 days/yr
Risk factors via First Street. Map © Google.
Why this score? — see what drove the D- grade
The composite is a weighted blend of 9 inputs, each scored 0–100. Each bar is that input's sub-score; the figure is the points it added to the 100-point composite (weight × sub-score).
- ARV discount +7.5/15.0
- Appreciation +6.7/10.0
- Cash flow +5.9/30.0
- Livability +4.2/5.0
- Schools +3.9/10.0
- Rent growth +2.9/5.0
- Condition / age +2.5/5.0
- 1% rule +1.3/10.0
- DSCR +0.3/10.0
$222,990
🖨 Deal sheet (PDF) 📄 Offer letter ✓ Due diligence
Listing remarks MLS
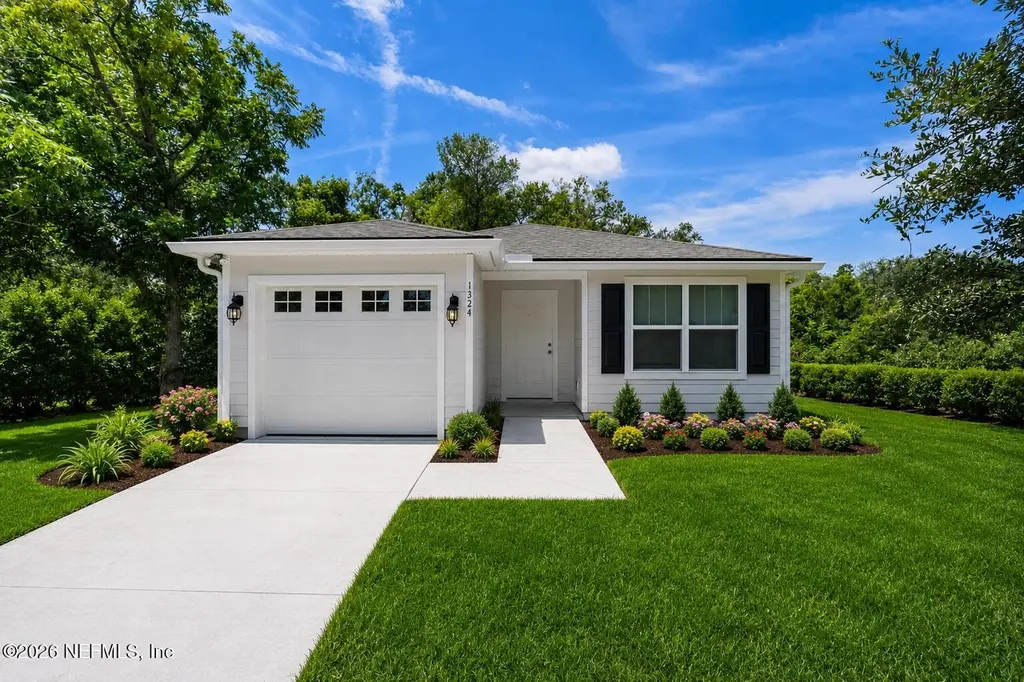
High-potential residential lot. Vacant lot ready for a new home to built on it. Non refundable deposit, please do inspections and walk the lot prior to making an offer. Property to be sold AS-IS. Seller to review all offers.
Key facts
- Large island
- Walk in closet
- En-suite bathroom
Tags
Property features AI
Finance
- HOA & community: Not a senior community
Exterior
- Parking: Detached or attached garage (1 car)
- Utilities: Public sewer; Cable connected; Electricity connected; Sewer connected; Water connected
- Home design: Single-family residence; One level
- Exterior features: No private pool; Lot approximately 0.1 acres
Interior
- Kitchen: Dishwasher; Electric range; Microwave; Refrigerator; Electric water heater
- Bedrooms: 3 bedrooms
- Flooring: Laminate
- Bathrooms: 2 full bathrooms
- Heating & cooling: Central heating; Central air conditioning
- Interior features: In-unit laundry; Laminate flooring
- Laundry & utility: In-unit laundry
Neighborhood map
What this means for you Summary
Snapshot
- This is a 3-bed/2.0-bath land listed at $223k.
Deal economics
- At list price, monthly cash flow is $-438 ($-5k/yr) — negative.
- To cash-flow at today's rent, offer at most $160k (28.4% below list).
- To meet the 1% rule (rent ≥ 1% of price), the offer needs to be $140k (37.4% below list).
- Recommended offer: $140k (37.4% below list) — sets the bar for 1% rule.
Location & tenants
- Location reads 83/100 on livability (#50 in FL, #911 nationally) — a professional / high-income tenant draw. Strengths: amenities A+, commute A+, housing A+.
- Duval (urban): math 46% / reading 45% proficiency, ranked #48 of 73 in FL (top 66%) — families likely to look elsewhere, expect single-tenant / working-renter base with shorter leases.
- Market conditions: Rents rising (+1.7%/yr); 172 active listings in the ZIP; 40 comparable units currently listed for rent nearby; rentals at typical pace (median 24d on market — plan ~3-4 weeks tenant-placement turnaround); lower-income renter base — watch delinquency; 6,503 units permitted in Duval County in 2024 (1,131 in 5+ unit buildings).
- At $1,396/mo this rent would consume 48% of the median local household income ($35k/yr) (locally 882% of renters already pay >50% of income on rent) — very limited rent-growth headroom before tenants either downsize or default.
Forward outlook
- In year one you build about $9k of equity ($2k loan paydown + $8k appreciation (3.4% local appreciation)).
- Duval County population projected at +19% by 2050 — long-run rental-demand tailwind backs the buy-and-hold thesis.
- By year 4, paydown + projected appreciation supports a ~$31k cash-out refi (75% LTV) — recoverable capital for the next deal without selling this one.
Negotiation context
- It's been on market 27 days — a 2% lower offer ($220k) is reasonable based on typical stale-listing flexibility.
- 4 sale attempts since 3y ago with the ask held roughly flat each time — persistent listings suggest the price (not the market) is what's stuck; bring a comps-based counter.
- Current owner paid $8k; list at $223k implies a 2687% gain — meaningful room to come down on a strong offer.
Risks & watch-outs
- Climate carrying-cost: severe wind risk, 99% chance of damaging wind over 30y; extreme-heat days projected 7→19/yr by 2055 (HVAC capex compounding) — expect insurance premiums to compound above CPI over the hold.
Questions for the listing agent
- What do current leases actually rent for vs. the listed asking? Can we see a recent rent roll and the last 12 months of T-12 income?
- Is there a deadline driving the sale (1031 exchange, divorce, estate, relocation)? That informs how much negotiation room exists.
- Schools are B-rated — typically a magnet for longer-tenancy family renters. What's the average tenant stay here, and is there a school-zone premium baked into asking?
- The area grade is low — what's the realistic commute time and amenity access for the typical tenant pool here? Any planned neighborhood developments (good or bad) we should know about?
- What's the average days-on-market for RENTAL listings here right now (not sales)? A rising rental-DOM trend means longer vacancies and softer asking-rent achievability than the comps imply.
- What's the recent tenant-quality profile in this submarket — average credit score on applications, eviction rate, late-payment / NSF rate, and stable-employment percentage? A property-management company in the area should have these aggregated.
- How much new for-sale + rental construction is in the pipeline within 1–3 miles? Heavy new supply typically softens prices + rents 12–24 months out; constrained supply supports both.
Investment metrics
- 1% rule
- 0.63% ✗
- Cap rate
- 3.94%
- Cash-on-cash
- -8.42%
- DSCR
- 0.63
- GRM
- 13.3
CMA / ARV
No comps found within radius.
Projected returns pro-forma
3.41% appreciation · 1.7% rent growth · sell at horizon
- IRR
- 0.6%
- Equity multiple
- 1.03×
- Total profit
- $2,103
- Equity at exit
- $105,489
- IRR
- 3.9%
- Equity multiple
- 1.61×
- Total profit
- $38,293
- Equity at exit
- $166,754
Cash invested: $62,437 (down + closing). Projections, not guarantees.
Landlord ↔ Tenant lean methodology
- Overall (STATE)
- 87 Strongly Landlord-Friendly
- State Florida
- 87 Strongly Landlord-Friendly · R+3
- County
- — inherits STATE
- City
- — inherits STATE
ZIP-level market 32254
- Home prices YoY
- 1.2%
- Rents YoY
- 1.7%
- Active inventory
- 172
- Price-to-rent
- 13.3×
Monthly cashflow live
- Estimated rent
- $1,396 high interval (Pro) →
- Mortgage (P&I)
- −$1,169
- Tax est. 1.5%
- −$279 /mo · $3,345/yr
- Insurance
- −$93
- HOA
- −$0
- Vacancy / Maint / Mgmt
- −$293
- Net cashflow
- $-438
Break-even live
Sensitivity live
| Price | -10% $-284 | -5% $-361 | +0% $-438 | +5% $-515 | +10% $-592 |
|---|---|---|---|---|---|
| Rent | -10% $-548 | -5% $-493 | +0% $-438 | +5% $-383 | +10% $-328 |
| Rate | -1.0pp $-326 | -0.5pp $-381 | base $-438 | +0.5pp $-496 | +1.0pp $-554 |
UW: 25.0% down · 7.5% · 30yr · 1.5% tax · 5.0% vac · 8.0% maint · 8.0% mgmt
Financing live
Cash to close
- Down payment
- $55,748
- Closing costs
- $6,690
- Reserves months
- —
- Total cash needed
- —
Loan-product check · same deal, 3 products live
Conventional
25% down · 7.5% · 30yr
- Down + closing
- —
- Monthly P&I
- —
- Monthly cashflow
- —
- DSCR
- —
- Eligible?
- —
Personal DTI + credit; lowest rate.
DSCR
20% down · 8.5% · 30yr
- Down + closing
- —
- Monthly P&I
- —
- Monthly cashflow
- —
- DSCR
- —
- Eligible?
- —
No personal income docs; deal must DSCR.
Hard money
10% down · 12.0% · 12mo
- Down + closing
- —
- Monthly P&I
- —
- Monthly cashflow
- —
- DSCR
- —
- Eligible?
- —
Short-term bridge; refi at stabilization.
Rent comps 40 comps
| Address | Beds | Baths | Sqft | Rent | $/sqft | DOM | Units | Dist |
|---|---|---|---|---|---|---|---|---|
| 3352 Dillon St Jacksonville, FL | 3.0 | 2.0 | 1229 | $1,372 | $1.12 | 24d | 1 | 0.16mi |
| 3318 Dignan St Jacksonville, FL | 3.0 | 2.0 | 960 | $1,200 | $1.25 | 24d | 1 | 0.17mi |
| 3323 Nolan St Jacksonville, FL | 3.0 | 1.0 | 927 | $1,050 | $1.13 | 2d | 1 | 0.19mi |
| 3515 Dignan St Jacksonville, FL | 3.0 | 1.0 | 915 | $1,036 | $1.13 | 3d | 1 | 0.20mi |
| 3319 Hunt St Jacksonville, FL | 3.0 | 1.0 | 924 | $1,295 | $1.40 | 24d | 1 | 0.23mi |
| 3118 Dignan St Jacksonville, FL | 4.0 | 2.0 | 1103 | $1,148 | $1.04 | 2d | 1 | 0.26mi |
| 3035 Fitzgerald St Jacksonville, FL | 2.0 | 1.0 | 900 | $1,021 | $1.13 | 3d | 1 | 0.32mi |
| 3688 Dillon St Jacksonville, FL | 3.0 | 2.0 | 1230 | $1,421 | $1.16 | 24d | 1 | 0.34mi |
| 3550 Edison Ave Jacksonville, FL | 3.0 | 2.0 | 1230 | $1,463 | $1.19 | 5d | 1 | 0.36mi |
| 3356 Lenox Ave Jacksonville, FL | 2.0 | 1.0 | 899 | $999 | $1.11 | 24d | 1 | 0.38mi |
| 841 Ontario St Jacksonville, FL | 2.0 | 1.0 | 1000 | $1,285 | $1.28 | 24d | 1 | 0.49mi |
| 3347 Phyllis St Jacksonville, FL | 3.0 | 2.0 | 1145 | $1,395 | $1.22 | 24d | 1 | 0.49mi |
| 3159 Phyllis St Jacksonville, FL | 3.0 | 2.0 | 1209 | $1,561 | $1.29 | 3d | 1 | 0.50mi |
| 2587 Orchard St Jacksonville, FL | 2.0 | 2.0 | 992 | $1,295 | $1.31 | 8d | 1 | 0.53mi |
| 3134 Phyllis St Jacksonville, FL | 4.0 | 2.0 | 1648 | $1,834 | $1.11 | 24d | 1 | 0.54mi |
| 912 Huron St Jacksonville, FL | 2.0 | 1.0 | 900 | $1,100 | $1.22 | 15d | 1 | 0.57mi |
| 3012 Imperial St Jacksonville, FL | 3.0 | 1.0 | 1089 | $1,395 | $1.28 | 24d | 1 | 0.59mi |
| 676 Bridal Ave Jacksonville, FL | 3.0 | 2.0 | 1008 | $1,450 | $1.44 | 24d | 1 | 0.60mi |
| 2410 McQuade St Jacksonville, FL | 3.0 | 2.0 | 1307 | $1,425 | $1.09 | 24d | 1 | 0.61mi |
| 691 Herman St Jacksonville, FL | 4.0 | 2.5 | 1641 | $1,669 | $1.02 | 8d | 1 | 0.63mi |
| 3312 Ernest St Jacksonville, FL | 3.0 | 1.0 | 1065 | $1,148 | $1.08 | 24d | 1 | 0.66mi |
| 3233 Dellwood Ave Jacksonville, FL | 2.0 | 2.0 | 1000 | $1,750 | $1.75 | 24d | 1 | 0.68mi |
| 3353 Dellwood Ave Jacksonville, FL | 3.0 | 1.0 | 934 | $1,595 | $1.71 | 18d | 1 | 0.69mi |
| 3609 Dellwood Ave Jacksonville, FL | 2.0 | 2.0 | 936 | $1,495 | $1.60 | 24d | 1 | 0.73mi |
| 420 Sunshine St Jacksonville, FL | 3.0 | 2.0 | 1050 | $1,350 | $1.29 | 2d | 1 | 0.76mi |
| 3313 Green St Jacksonville, FL | 3.0 | 1.0 | 1058 | $1,450 | $1.37 | 8d | 1 | 0.78mi |
| 2980 Ernest St Jacksonville, FL | 2.0 | 1.0 | 920 | $1,200 | $1.30 | 24d | 1 | 0.78mi |
| 3305 Sunnybrook Ave N Jacksonville, FL | 2.0 | 1.0 | 1012 | $1,021 | $1.01 | 24d | 1 | 0.81mi |
| 1037 Detroit St Jacksonville, FL | 3.0 | 2.0 | 912 | $1,250 | $1.37 | 2d | 1 | 0.82mi |
| 809 McDuff Ave S Jacksonville, FL | 2.0 | 1.0 | 1006 | $995 | $0.99 | 5d | 1 | 0.82mi |
| 3350 Sunnybrook Ave N Jacksonville, FL | 2.0 | 1.0 | 900 | $1,095 | $1.22 | 24d | 1 | 0.86mi |
| 3036 Green St Jacksonville, FL | 3.0 | 1.0 | 924 | $1,495 | $1.62 | 24d | 1 | 0.87mi |
| 3303 Broadway Ave Jacksonville, FL | 3.0 | 2.0 | 1072 | $1,550 | $1.45 | 4d | 1 | 0.87mi |
| 3302 College St Jacksonville, FL | 3.0 | 1.0 | 1174 | $1,095 | $0.93 | 8d | 1 | 0.91mi |
| 3352 College St Jacksonville, FL | 3.0 | 2.0 | 1335 | $1,550 | $1.16 | 15d | 1 | 0.91mi |
| 628 Meteor St Jacksonville, FL | 3.0 | 1.0 | 1123 | $1,395 | $1.24 | 24d | 1 | 0.95mi |
| 4006 College St Jacksonville, FL | 3.0 | 2.5 | 1208 | $2,200 | $1.82 | 12d | 1 | 0.95mi |
| 4006 College St Jacksonville, FL | 3.0 | 2.5 | 1200 | $2,200 | $1.83 | 24d | 1 | 0.95mi |
| 3362 Lowell Ave Jacksonville, FL | 3.0 | 2.0 | 1682 | $1,400 | $0.83 | 8d | 1 | 0.95mi |
| 3034 Detroit Cir E Jacksonville, FL | 3.0 | 2.0 | 1300 | $1,399 | $1.08 | 24d | 1 | 0.95mi |
Listing history 22 events
-
2026-06-18days on market $222,990 Active 27 DOM
-
2026-06-17days on market $222,990 Active 26 DOM
-
2026-06-16days on market $222,990 Active 25 DOM
-
2026-06-15days on market $222,990 Active 24 DOM
-
2026-06-13days on market $222,990 Active 22 DOM
-
2026-06-13days on market $222,990 Active 21 DOM
-
2026-06-10days on market $222,990 Active 18 DOM
-
2026-06-08days on market $222,990 Active 17 DOM
-
2026-06-07days on market $222,990 Active 16 DOM
-
2026-06-05days on market $222,990 Active 13 DOM
-
2026-06-03days on market $222,990 Active 12 DOM
-
2026-06-02days on market $222,990 Active 11 DOM
-
2026-06-01days on market $222,990 Active 10 DOM
-
2026-05-31days on market $222,990 Active 9 DOM
-
2026-05-01$222,990 Active
-
2024-01-18status Active 226-char remark
Show marketing remark (226 chars)
High-potential residential lot. Vacant lot ready for a new home to built on it. Non refundable deposit, please do inspections and walk the lot prior to making an offer. Property to be sold AS-IS. Seller to review all offers.
-
2024-01-05status Active 226-char remark
Show marketing remark (226 chars)
High-potential residential lot. Vacant lot ready for a new home to built on it. Non refundable deposit, please do inspections and walk the lot prior to making an offer. Property to be sold AS-IS. Seller to review all offers.
-
2023-09-17status Pending 226-char remark
Show marketing remark (226 chars)
High-potential residential lot. Vacant lot ready for a new home to built on it. Non refundable deposit, please do inspections and walk the lot prior to making an offer. Property to be sold AS-IS. Seller to review all offers.
-
2023-09-17historical 226-char remark
Show marketing remark (226 chars)
High-potential residential lot. Vacant lot ready for a new home to built on it. Non refundable deposit, please do inspections and walk the lot prior to making an offer. Property to be sold AS-IS. Seller to review all offers.
-
2023-09-17historical 226-char remark
Show marketing remark (226 chars)
High-potential residential lot. Vacant lot ready for a new home to built on it. Non refundable deposit, please do inspections and walk the lot prior to making an offer. Property to be sold AS-IS. Seller to review all offers.
-
2023-07-17$21,500 Active 226-char remark
Show marketing remark (226 chars)
High-potential residential lot. Vacant lot ready for a new home to built on it. Non refundable deposit, please do inspections and walk the lot prior to making an offer. Property to be sold AS-IS. Seller to review all offers.
-
1977-10-28soldstatus $8,000
ⓘ Source: listings_history table (triggers on properties + properties_extension) + one-shot
backfill from property_details.listing_events for pre-trigger history.
Climate risk First Street
- Flood 1/10 Low FEMA zone X (unshaded) · 0% chance over 30 yrs
- Wildfire 1/10 Low
- Heat 9/10 Extreme 7 d/yr ≥107°F today · 19 d/yr by 30 yrs out
- Wind 9/10 Extreme 99% chance of damaging wind over 30 yrs
- Air quality 5/10 Major 7 unhealthy d/yr today · 7 by 30 yrs out
Nearby sold comps map
Loading sold comps map…
Walkable amenities ~0.75 mi
Loading nearby amenities…
Taxation est. · year 1
- Rental income
- $16,757
- − Mortgage interest
- −$12,491
- − Property taxes
- −$3,345
- − Insurance
- −$1,115
- − Repairs & maintenance
- −$1,341
- − Management
- −$1,341
- − Depreciation
- −$6,487
- Taxable loss
- −$9,362
- Est. tax savings @ 24.0%
- +$2,247
- After-tax cash flow
- $-3,007/yr
For passive investors: Depreciation is non-cash, so a rental often shows a tax loss while cash-flowing — sheltering income. Rental losses are passive: they offset passive income freely, and up to $25,000/yr can offset ordinary (W-2) income if you actively participate and your MAGI is under $100k (phasing out to $0 by $150k); unused losses carry forward. On sale, claimed depreciation is recaptured at up to 25%, and gains may owe capital-gains tax (a 1031 exchange can defer both). Figures are a year-1 estimate at your 24.0% rate — not tax advice; consult a CPA.
Schools (NCES district)
- District
- Duval
- NCES district ID
- 1200480
- Math proficiency
- 46% ▼ -11.00%
- Reading proficiency
- 45% ▼ -4.00%
- Median HH income
- $48,987
- Composite
- 38.97/100
- National rank
- #4076
- State rank
- #48 of 73 in FL
Livability — Jacksonville
- Score
- 83/100
- State rank
- #50
- US rank
- #911
Category grades
Schools grade is shown separately in the Schools card above.
Census & demographics
- Census place
- Jacksonville, FL
- County
- Duval County · 1,015,274 people
- City population
- 979,034
- Metro
- Jacksonville, FL
- Population (ZIP)
- 13,927
- Household income
- $34,953
- Rent vs Own
- Severe rent burden
- 882.0
Population outlook (Duval County) Hauer SSP2
- Today (2025)
- 1,013,010 people
- By 2030
- 1,059,228 · +4.6%
- By 2040
- 1,141,439 · +12.7%
- By 2050
- 1,205,258 · +19.0%
- By 2075
- 1,324,282 · +30.7%
- By 2100
- 1,319,620 · +30.3%
Race, ethnicity, and origin ACS 2023
- Neighborhood character
- Diverse neighborhood (Simpson 0.56)
- Race & ethnicity
- Black 60% White 28% Two or more races 7% Hispanic / Latino 5%
- Hispanic origin (detail)
- Puerto Rican 1%
- Common ancestry
- Slovak 1% Hispanic 1% Lithuanian 1%
- Foreign-born
- 4% · Canada
- Languages at home
- 94% English-only · Spanish 4% French/Haitian/Cajun 2%
Political lean MEDSL · Duval
- 2024 margin
- Toss-up / Even · D 48.7% · R 50.1% · Other 1.2%
- 2008→2024 swing
- +0.4pp no change · 2008: -1.9pp · 2024: -1.5pp
- All cycles
- 2024: R+1.5 2020: D+3.8 2016: R+1.5 2012: R+3.6 2008: R+1.9
Not yet ingested
- Civics
- —
Market trends
- HPI YoY
- ▲ 3.41%
- Current HPI
- 282.2981
- Rent YoY
- ▲ 1.70%
- Metro
- Jacksonville, FL
- State GDP YoY
- ▲ 3.28%
- F500 in state
- 36
Industry mix (Fortune 500 HQ in FL)
| Industry | F500 HQs | Revenue |
|---|---|---|
| Industrial Technology | 2 | $29B |
|
||
| Insurance | 2 | $17B |
|
||
| Retail | 1 | $60B |
|
||
| Technology Distribution | 1 | $58B |
|
||
| Homebuilding | 1 | $35B |
|
||
| Technology Manufacturing | 1 | $35B |
|
||
Price history
+2687.4% since first listed8 events — show timeline
- 2026-05-01 Listed $222,990 realMLS
- 2024-01-18 Relisted — realMLS
- 2024-01-05 Relisted — realMLS
- 2023-09-17 Pending — realMLS
- 2023-09-17 Listing Removed — realMLS
- 2023-09-17 Listing Removed — realMLS
- 2023-07-17 Listed $21,500 realMLS
- 1977-10-28 Sold (Public Records) $8,000 Public Records
Property tax history
+9.9%/yrLatest (2025): $225 · +33.3% YoY. Source: county tax records.
Cash-flow waterfall
monthlySold comps — $/sqft
last 12 mo · ≤1 miLoading sold comps…