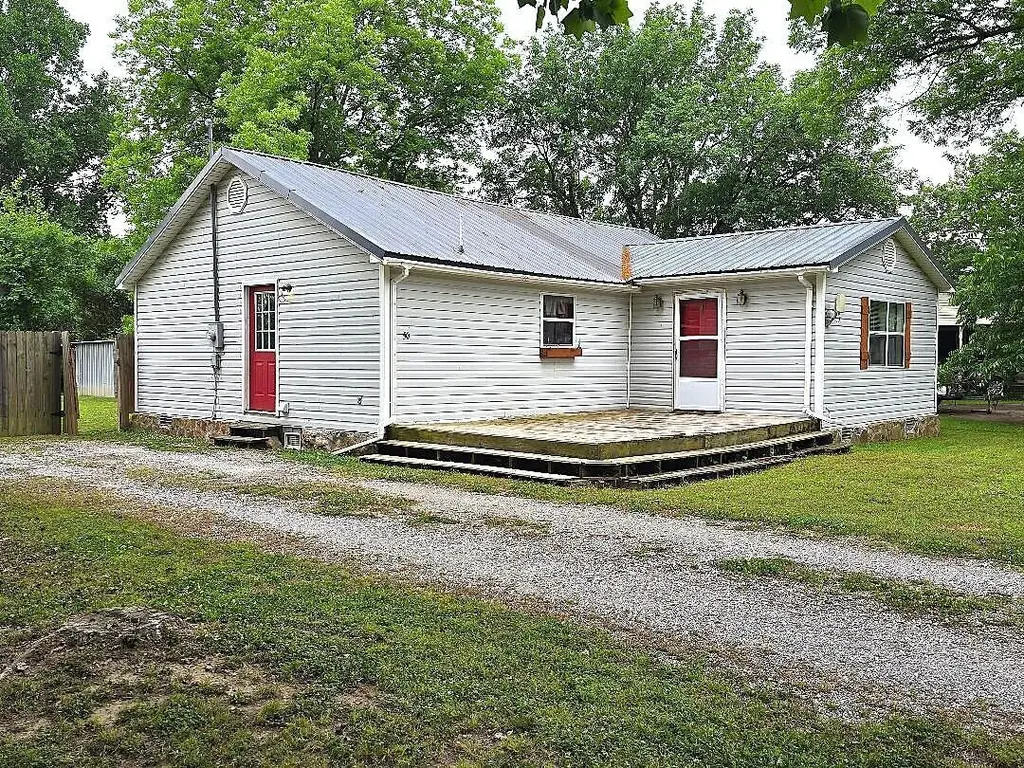
50 Charles St · Oil Trough, AR
Flood risk 5/10 · Moderate
- FEMA flood zone
- A
- Chance of flooding over 30 yrs
- 0.64%
- Est. flood insurance / yr
- $1,009 – $1,996
Fire risk 1/10 · Minimal
- Est. fire insurance / yr
- $1,499 – $2,785
Heat risk 6/10 · Moderate
- Hot days now (above 109°F)
- 7 days/yr
- Hot days in 30 yrs
- 20 days/yr
Wind risk 4/10 · Minor
- Chance of severe wind over 30 yrs
- 8.0%
Air-quality risk 1/10 · Minimal
- Unhealthy air days now
- 0 days/yr
- Unhealthy air days in 30 yrs
- 0 days/yr
Risk factors via First Street. Map © Google.
Why this score? — see what drove the B+ grade
The composite is a weighted blend of 9 inputs, each scored 0–100. Each bar is that input's sub-score; the figure is the points it added to the 100-point composite (weight × sub-score).
- Cash flow +30.0/30.0
- ARV discount +11.7/15.0
- DSCR +10.0/10.0
- 1% rule +9.2/10.0
- Appreciation +5.0/10.0
- Livability +2.8/5.0
- Rent growth +2.5/5.0
- Condition / age +2.5/5.0
- Schools +2.1/10.0
$68,000
🖨 Deal sheet 📄 Offer letter ✓ Due diligence
Listing remarks MLS
Charming 3-bedroom, 1-bath home offering 1,104 square feet of comfortable living space! Full of potential, this property is perfect for a starter home, downsizing, or an investment opportunity. Enjoy the large fenced backyard with plenty of space for pets, play, gardening, or relaxing. Seller has priced the home with 'cost to cure' already taken into consideration. To be sold AS IS - WHERE IS.
Key facts
- Fenced backyard
- 0.26 acre lot
- Built 1930
Tags
Property features AI
Finance
- Other: Approx. lot dimensions 75 x 150 (approx. 0.26 acre); Approximate size reported from tax records
- Financial info: Cash and in-house financing available
Exterior
- Parking: Other parking (see remarks)
- Utilities: Public sewer; Public water; Municipal electric service (Entergy)
- Home design: Metal/vinyl siding exterior; Inside city limits
- Construction: Metal roof; Crawl space foundation
- Exterior features: Deck; Partially fenced yard; Guttering; Paved road access; Level lot
Interior
- Kitchen: Free-standing stove; Electric range
- Flooring: Carpet; Vinyl; Tile; Laminate
- Bathrooms: 1 full bathroom
- Heating & cooling: Heat pump
- Interior features: Carpet, vinyl, tile, and laminate flooring; Sheetrock walls and ceilings
- Laundry & utility: Laundry room
Neighborhood map
What this means for you Summary
Snapshot
- This is a 3-bed/1.0-bath single-family listed at $68k.
Deal economics
- At list price, monthly cash flow is $221 ($3k/yr) — positive.
- The deal already cash-flows at list — no discount required.
- Meets the 1% rule at list price ($969 rent vs $68k).
- Recommended offer: $67k (1.5% below list) — sets the bar for market timing.
Location & tenants
- Location reads 56/100 on livability (#378 in AR) — a working-class tenant base; expect higher turnover. Strengths: cost of living A+, housing A+; Watch: employment D+, schools F, crime F.
- Cedar Ridge School District (rural): math 24% / reading 26% proficiency, ranked #186 of 238 in AR (top 78%) — low school quality limits family demand, transient renter base, plan for 1-2y turnover.
- Market conditions: 1 active listings in the ZIP; 33 units permitted in Independence County in 2024 (24 in 5+ unit buildings).
Forward outlook
- In year one you build about $3k of equity ($470 loan paydown + $2k appreciation (3.0% local appreciation)).
- At projected returns (3.0% appreciation + 3.0% rent growth), your $19k cash investment doubles in ~4 years — after that, you're playing with house money.
Negotiation context
- It's been on market 24 days — a 2% lower offer ($67k) is reasonable based on typical stale-listing flexibility.
- 2 sale attempts with the ask held roughly flat each time — persistent listings suggest the price (not the market) is what's stuck; bring a comps-based counter.
- Current owner paid $45k; list at $68k implies a 51% gain — meaningful room to come down on a strong offer.
Risks & watch-outs
- Watch-outs: flood insurance adds $125/mo; built in 1930 — expect roof / HVAC / electrical / plumbing capex.
- Climate carrying-cost: in FEMA flood zone A (mandatory federal flood insurance); extreme-heat days projected 7→20/yr by 2055 (HVAC capex compounding) — expect insurance premiums to compound above CPI over the hold.
Questions for the listing agent
- Built in 1930 — when were the roof, HVAC, electrical panel, plumbing, and water heater last replaced?
- What's the actual annual flood-insurance premium (NFIP or private), and is the property in a SFHA with mandatory coverage?
- Is there a deadline driving the sale (1031 exchange, divorce, estate, relocation)? That informs how much negotiation room exists.
- Schools are F-rated, which usually means shorter tenancies and higher turnover. Who's the typical renter profile here, and what's been the actual vacancy rate?
- Crime grade is F in this area — have there been break-ins, vandalism, or insurance claims at this property in the last 3 years? What carrier currently insures it and at what premium?
- What's the average days-on-market for RENTAL listings here right now (not sales)? A rising rental-DOM trend means longer vacancies and softer asking-rent achievability than the comps imply.
- What's the recent tenant-quality profile in this submarket — average credit score on applications, eviction rate, late-payment / NSF rate, and stable-employment percentage? A property-management company in the area should have these aggregated.
- How much new for-sale + rental construction is in the pipeline within 1–3 miles? Heavy new supply typically softens prices + rents 12–24 months out; constrained supply supports both.
Investment metrics
- 1% rule
- 1.42% ✓
- Cap rate
- 12.40%
- Cash-on-cash
- 21.82%
- DSCR
- 1.97
- GRM
- 5.9
CMA / ARV
- ARV (on-the-fly)
- $75,072
- Comps found
- 2
Show comp detail 2 sales within ~0.75 mi
| Address | Dist | Beds/Ba | Sqft | Sold | Price | $/sf | Match |
|---|---|---|---|---|---|---|---|
| 149 Nelse St | 0.07mi | 2/1.0 (-1) | 1,100 (-0%) | 19mo | $75,000 | $68 | 75 |
| 110 2nd St | 0.26mi | 3/1.0 | 1,222 (+11%) | 3mo | $32,500 | $27 | 68 |
Match score weights: distance 35% · size 25% · config 20% · recency 20%. Top-matched comps best support the ARV.
Projected returns pro-forma
3.0% appreciation · 3.0% rent growth · sell at horizon
- IRR
- 20.6%
- Equity multiple
- 2.17×
- Total profit
- $22,325
- Equity at exit
- $30,576
- IRR
- 21.8%
- Equity multiple
- 4.14×
- Total profit
- $59,845
- Equity at exit
- $47,121
Cash invested: $19,040 (down + closing). Projections, not guarantees.
Landlord ↔ Tenant lean methodology
- Overall (STATE)
- 92 Strongly Landlord-Friendly
- State Arkansas
- 92 Strongly Landlord-Friendly · R+14
- County
- — inherits STATE
- City
- — inherits STATE
ZIP-level market 72564
- Active inventory
- 1
- Price-to-rent
- 5.9×
Monthly cashflow live
- Estimated rent
- $969 medium interval (Pro) →
- Mortgage (P&I)
- −$357
- Tax from tax record
- −$34 /mo · $409/yr
- Insurance
- −$28
- Flood insurance flood zone
- −$125 /mo · $1,502/yr
- HOA
- −$0
- Vacancy / Maint / Mgmt
- −$203
- Net cashflow
- $221
Break-even live
UW: 25.0% down · 7.5% · 30yr · 1.5% tax · 5.0% vac · 8.0% maint · 8.0% mgmt
Financing live
Cash to close
- Down payment
- $17,000
- Closing costs
- $2,040
- Reserves months
- —
- Total cash needed
- —
Loan-product check · same deal, 3 products live
Conventional
25% down · 7.5% · 30yr
- Down + closing
- —
- Monthly P&I
- —
- Monthly cashflow
- —
- DSCR
- —
- Eligible?
- —
Personal DTI + credit; lowest rate.
DSCR
20% down · 8.5% · 30yr
- Down + closing
- —
- Monthly P&I
- —
- Monthly cashflow
- —
- DSCR
- —
- Eligible?
- —
No personal income docs; deal must DSCR.
Hard money
10% down · 12.0% · 12mo
- Down + closing
- —
- Monthly P&I
- —
- Monthly cashflow
- —
- DSCR
- —
- Eligible?
- —
Short-term bridge; refi at stabilization.
Listing history 25 events
-
2026-06-19days on market $68,000 Active 24 DOM
-
2026-06-18days on market $68,000 Active 23 DOM
-
2026-06-17days on market $68,000 Active 22 DOM
-
2026-06-16days on market $68,000 Active 21 DOM
-
2026-06-15days on market $68,000 Active 20 DOM
-
2026-06-14days on market $68,000 Active 18 DOM
-
2026-06-12days on market $68,000 Active 17 DOM
-
2026-06-09days on market $68,000 Active 14 DOM
-
2026-06-08days on market $68,000 Active 13 DOM
-
2026-06-07days on market $68,000 Active 12 DOM
-
2026-06-07days on market $68,000 Active 11 DOM
-
2026-06-03days on market $68,000 Active 8 DOM
-
2026-06-02statusdays on market $68,000 Active 7 DOM
-
2026-06-01days on market $68,000 New Listing 6 DOM
-
2026-05-31days on market $68,000 New Listing 5 DOM
-
2026-05-30days on market $68,000 New Listing 4 DOM
-
2026-05-26$68,000 Active 396-char remark
Show marketing remark (396 chars)
Charming 3-bedroom, 1-bath home offering 1,104 square feet of comfortable living space! Full of potential, this property is perfect for a starter home, downsizing, or an investment opportunity. Enjoy the large fenced backyard with plenty of space for pets, play, gardening, or relaxing. Seller has priced the home with 'cost to cure' already taken into consideration. To be sold AS IS - WHERE IS.
-
2026-05-26$68,000 New Listing
Show marketing remark (396 chars)
Charming 3-bedroom, 1-bath home offering 1,104 square feet of comfortable living space! Full of potential, this property is perfect for a starter home, downsizing, or an investment opportunity. Enjoy the large fenced backyard with plenty of space for pets, play, gardening, or relaxing. Seller has priced the home with 'cost to cure' already taken into consideration. To be sold AS IS - WHERE IS.
-
2010-10-29soldstatus $45,000
-
2005-06-29soldstatus $26,000
-
2003-10-14soldstatus $13,000
-
1994-07-05soldstatus $11,000
-
1994-06-15soldstatus $11,000
-
1990-10-15soldstatus $8,000
-
1989-04-05soldstatus $3,000
ⓘ Source: listings_history table (triggers on properties + properties_extension) + one-shot
backfill from property_details.listing_events for pre-trigger history.
Tax reassessment forecast AR · Resets to sale price
- Current annual tax
- $409 · $34/mo
- Projected year-2 tax
- $435 · $36/mo
- Expected delta
- +$27/yr (+$2/mo · 6.5%)
ⓘ Screening estimate from a state-policy table — verify with the county assessor before closing.
Climate risk First Street
- Flood 5/10 Major FEMA zone A · 64% chance over 30 yrs
- Wildfire 1/10 Low
- Heat 6/10 Major 7 d/yr ≥109°F today · 20 d/yr by 30 yrs out
- Wind 4/10 Moderate 8% chance of damaging wind over 30 yrs
- Air quality 1/10 Low 0 unhealthy d/yr today · 0 by 30 yrs out
Nearby sold comps map
Loading sold comps map…
Walkable amenities ~0.75 mi
Loading nearby amenities…
Taxation est. · year 1
- Rental income
- $11,623
- − Mortgage interest
- −$3,809
- − Property taxes
- −$409
- − Insurance
- −$1,842
- − Repairs & maintenance
- −$930
- − Management
- −$930
- − Depreciation
- −$1,978
- Taxable income
- $1,725
- Est. tax owed @ 24.0%
- −$414
- After-tax cash flow
- $2,238/yr
For passive investors: Depreciation is non-cash, so a rental often shows a tax loss while cash-flowing — sheltering income. Rental losses are passive: they offset passive income freely, and up to $25,000/yr can offset ordinary (W-2) income if you actively participate and your MAGI is under $100k (phasing out to $0 by $150k); unused losses carry forward. On sale, claimed depreciation is recaptured at up to 25%, and gains may owe capital-gains tax (a 1031 exchange can defer both). Figures are a year-1 estimate at your 24.0% rate — not tax advice; consult a CPA.
Schools (NCES district)
- District
- Cedar Ridge School District
- NCES district ID
- 0500070
- Math proficiency
- 24% ▼ -12.00%
- Reading proficiency
- 26% ▼ -13.00%
- Median HH income
- $36,696
- Composite
- 20.79/100
- National rank
- #8510
- State rank
- #186 of 238 in AR
Livability — Oil Trough
- Score
- 56/100
- State rank
- #378
- US rank
- #22471
Category grades
Schools grade is shown separately in the Schools card above.
Census & demographics
- Census place
- Oil Trough, AR
- Population (ZIP)
- 525
Population outlook (Independence County) Hauer SSP2
- Today (2025)
- 37,748 people
- By 2030
- 37,962 · +0.6%
- By 2040
- 38,151 · +1.1%
- By 2050
- 37,980 · +0.6%
- By 2075
- 36,622 · -3.0%
- By 2100
- 32,741 · -13.3%
Race, ethnicity, and origin ACS 2023
- Neighborhood character
- Predominantly White (79%)
- Race & ethnicity
- White 79% Two or more races 20% Hispanic / Latino 2% Black 1%
- Common ancestry
- Lithuanian 1% Iranian 1% Portuguese 1%
- Foreign-born
- 0% · Canada
Political lean MEDSL · Independence
- 2024 margin
- Solid R (+59.5) · D 19.2% · R 78.7% · Other 2.1%
- 2008→2024 swing
- -22.3pp toward R · 2008: -37.1pp · 2024: -59.5pp
- All cycles
- 2024: R+59.5 2020: R+58.2 2016: R+52.4 2012: R+44.0 2008: R+37.1
Not yet ingested
- Civics
- —
Market trends
- HPI YoY
- —
- Current HPI
- —
- Rent YoY
- —
- Metro
- —
- State GDP YoY
- ▲ 3.80%
- F500 in state
- 10
Industry mix (Fortune 500 HQ in AR)
| Industry | F500 HQs | Revenue |
|---|---|---|
| Retail | 1 | $681B |
|
||
| Food / Agriculture | 1 | $53B |
|
||
| Retail / Energy | 1 | $22B |
|
||
| Transportation / Logistics | 1 | $12B |
|
||
| Energy | 1 | $4B |
|
||
Price history
+2166.7% since first listed9 events — show timeline
- 2026-05-26 Listed $68,000 Batesville
- 2026-05-26 Listed $68,000 CARMLS
- 2010-10-29 Sold (Public Records) $45,000 Public Records
- 2005-06-29 Sold (Public Records) $26,000 Public Records
- 2003-10-14 Sold (Public Records) $13,000 Public Records
- 1994-07-05 Sold (Public Records) $11,000 Public Records
- 1994-06-15 Sold (Public Records) $11,000 Public Records
- 1990-10-15 Sold (Public Records) $8,000 Public Records
- 1989-04-05 Sold (Public Records) $3,000 Public Records
Property tax history
+64.0%/yrLatest (2019): $409 · +0.0% YoY. Source: county tax records.
Cash-flow waterfall
monthlySold comps — $/sqft
last 12 mo · ≤1 miLoading sold comps…