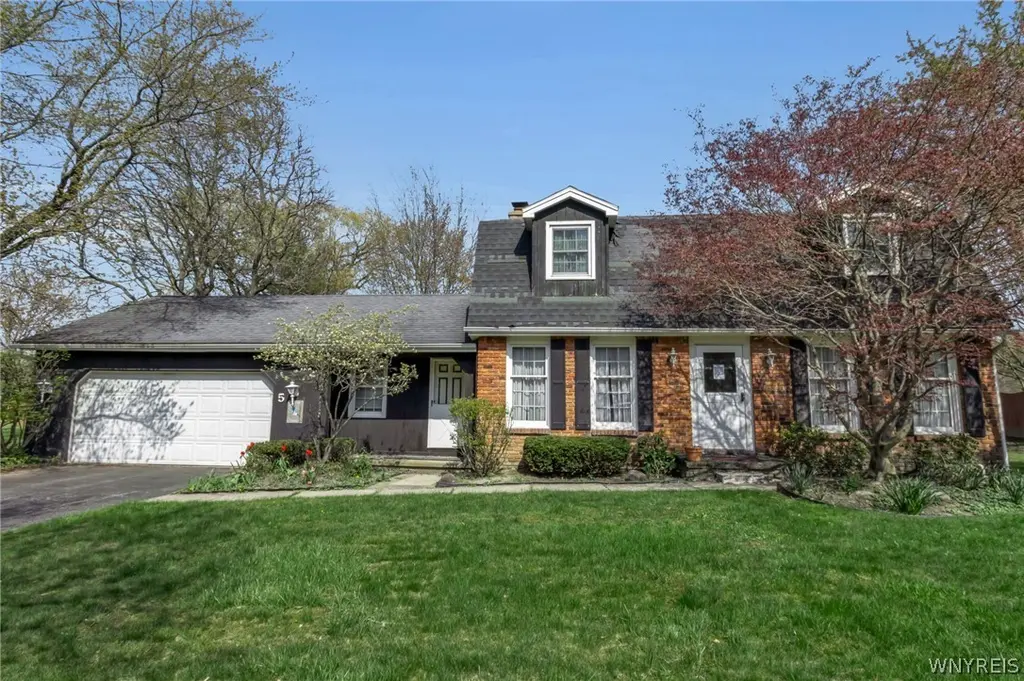
5 Burning Bush · Hamburg, NY
Flood risk 1/10 · Minimal
- FEMA flood zone
- X (unshaded)
- Chance of flooding over 30 yrs
- 0.0%
- Est. flood insurance / yr
- $473 – $860
Fire risk 1/10 · Minimal
- Est. fire insurance / yr
- $691 – $1,283
Heat risk 2/10 · Minimal
- Hot days now (above 91°F)
- 7 days/yr
- Hot days in 30 yrs
- 14 days/yr
Wind risk 1/10 · Minimal
- Chance of severe wind over 30 yrs
- —
Air-quality risk 2/10 · Minimal
- Unhealthy air days now
- 1 days/yr
- Unhealthy air days in 30 yrs
- 3 days/yr
Risk factors via First Street. Map © Google.
Why this score? — see what drove the D grade
The composite is a weighted blend of 9 inputs, each scored 0–100. Each bar is that input's sub-score; the figure is the points it added to the 100-point composite (weight × sub-score).
- ARV discount +15.0/15.0
- Cash flow +7.1/30.0
- Schools +4.9/10.0
- Livability +4.2/5.0
- 1% rule +3.2/10.0
- Rent growth +2.5/5.0
- Condition / age +2.5/5.0
- DSCR +1.2/10.0
- Appreciation +0.0/10.0
$250,000
🖨 Deal sheet 📄 Offer letter ✓ Due diligence
Listing remarks
Highly sought after location! Wonderful neighborhood street. Hamburg Schools. 3 bedrooms 1 1/2 baths. Eat in kitchen with appliances and pantry. Formal dining room, formal living room, den and family room with WBFP with gas start and french doors to large deck over looking built in pool. The pool has not been opened in 2 years and was maintained prior to that, and is being sold in as is condition. With a little TLC this home could shine! Furnace 2026, A/C unit 2025. Fully fenced yard. Washer and dryer included. Due to the condition of the roof this home is not eligible for a mortgage. Home being sold in as is condition. Offers due May 5th @ 2pm.
Key facts
- Formal dining room
- Eat in kitchen
- Family room
Tags
Property features AI
Exterior
- Parking: Attached 2-car garage with electricity and garage door opener
- Utilities: Electricity connected (circuit breakers); Public water connected; Sewer connected; Cable available; High-speed internet available
- Home design: Two-story existing home; Poured foundation; Asphalt roof; Aluminum siding; Copper plumbing; Irregular residential lot with city street frontage; Lot dimensions approximately 86 x 189
- Construction: Built (existing); Poured foundation; Aluminum siding; Asphalt roof; Copper plumbing
- Exterior features: Blacktop driveway; Deck; Fully fenced yard; In-ground pool; Shed(s) and storage
Interior
- Kitchen: Dishwasher; Gas oven; Gas range; Range hood; Exhaust fan; Refrigerator
- Bedrooms: Primary bedroom (Second level); Bedroom 2 (Second level); Bedroom 3 (Second level)
- Flooring: Carpet; Luxury vinyl; Various flooring types
- Bathrooms: 1 full bathroom; 1 half bathroom; 1 main-level bathroom
- Heating & cooling: Gas forced-air heating; Central air conditioning
- Interior features: Ceiling fans; Den; Separate/formal dining room; Eat-in kitchen; Separate/formal living room; Natural woodwork; Workshop; Full basement with sump pump
- Laundry & utility: Laundry in basement; Gas water heater
Neighborhood map
What this means for you Summary
Snapshot
- This is a 3-bed/1.5-bath single-family listed at $250k.
Deal economics
- At list price, monthly cash flow is $-361 ($-4k/yr) — negative.
- To cash-flow at today's rent, offer at most $186k (25.5% below list).
- To meet the 1% rule (rent ≥ 1% of price), the offer needs to be $205k (18.0% below list).
- Recommended offer: $186k (25.5% below list) — sets the bar for cash-flow.
- Cap rate 4.6% vs local median 2.4% in Hamburg — top-decile yield for the area; either an underpriced asset or a hidden risk that comps aren't pricing in. Stress-test before assuming the spread holds.
Location & tenants
- Location reads 84/100 on livability (#43 in NY, #692 nationally) — a professional / high-income tenant draw. Strengths: schools A+, employment A+, housing A+; Watch: commute F.
- Hamburg Central School District (suburban): math 46% / reading 66% proficiency, ranked #267 of 590 in NY (top 45%) — acceptable for families but not a draw, mixed tenant base, ~2y average lease; only 14% free/reduced lunch — higher-income household profile.
- Market conditions: 145 active listings in the ZIP; solid renter incomes; 1,244 units permitted in Erie County in 2024 (563 in 5+ unit buildings).
Forward outlook
- Local home prices are declining (-3.0%/yr); year-one equity from $2k of loan paydown is wiped out by about $8k of value loss. Plan a longer hold.
Negotiation context
- Only 10 days on market — expect competitive offers; lowballing is unlikely to land.
Risks & watch-outs
- Watch-outs: property tax is 2.7% of price.
Questions for the listing agent
- What do current leases actually rent for vs. the listed asking? Can we see a recent rent roll and the last 12 months of T-12 income?
- Built in 1973 — when were the roof, HVAC, electrical panel, plumbing, and water heater last replaced?
- Property tax is high relative to price — has the assessment been appealed recently, and will the sale trigger a re-assessment?
- Is there a deadline driving the sale (1031 exchange, divorce, estate, relocation)? That informs how much negotiation room exists.
- Schools are A-rated — typically a magnet for longer-tenancy family renters. What's the average tenant stay here, and is there a school-zone premium baked into asking?
- The area grade is low — what's the realistic commute time and amenity access for the typical tenant pool here? Any planned neighborhood developments (good or bad) we should know about?
- What's the average days-on-market for RENTAL listings here right now (not sales)? A rising rental-DOM trend means longer vacancies and softer asking-rent achievability than the comps imply.
- What's the recent tenant-quality profile in this submarket — average credit score on applications, eviction rate, late-payment / NSF rate, and stable-employment percentage? A property-management company in the area should have these aggregated.
- How much new for-sale + rental construction is in the pipeline within 1–3 miles? Heavy new supply typically softens prices + rents 12–24 months out; constrained supply supports both.
Investment metrics
- 1% rule
- 0.82% ✗
- Cap rate
- 4.56%
- Cash-on-cash
- -6.18%
- DSCR
- 0.72
- GRM
- 10.2
CMA / ARV
- ARV (median comp)
- $443,354
- List price
- $250,000
- Delta
- -43.61%
- Verdict
- UNDERPRICED
- Comps
- 20 within 1.0 mi
Show comp detail 11 sales within ~0.75 mi
| Address | Dist | Beds/Ba | Sqft | Sold | Price | $/sf | Match |
|---|---|---|---|---|---|---|---|
| 72 Candy Ln | 0.23mi | 3/1.5 | 1,668 (-5%) | 8mo | $427,000 | $256 | 74 |
| 5295 Powers Rd | 0.29mi | 3/2.0 | 1,716 (-3%) | 12mo | $400,716 | $234 | 70 |
| 17 Quail | 0.08mi | 3/3.0 | 1,912 (+8%) | 10mo | $450,000 | $235 | 68 |
| 4 Old Orchard Ln | 0.42mi | 3/2.0 | 1,892 (+7%) | 1mo | $426,000 | $225 | 65 |
| 23 Bittersweet Ln | 0.52mi | 3/2.0 | 1,754 (-1%) | 11mo | $405,000 | $231 | 64 |
| 5128 Armor Duells Rd | 0.57mi | 3/1.5 | 1,668 (-5%) | 1mo | $401,500 | $241 | 63 |
| 5531 Draudt Rd | 0.44mi | 3/1.0 | 1,872 (+6%) | 7mo | $280,000 | $150 | 62 |
| 30 Puritan Pl | 0.23mi | 4/1.5 (+1) | 1,664 (-6%) | 20mo | $300,700 | $181 | 58 |
| 112 Old Orchard Ln | 0.30mi | 3/3.0 | 1,904 (+8%) | 11mo | $370,000 | $194 | 58 |
| 5350 Powers Rd | 0.23mi | 3/2.0 | 1,522 (-14%) | 8mo | $407,500 | $268 | 58 |
| 5031 Armor Duells Rd | 0.71mi | 3/2.0 | 1,504 (-15%) | 10mo | $345,000 | $229 | 32 |
Match score weights: distance 35% · size 25% · config 20% · recency 20%. Top-matched comps best support the ARV.
Projected returns pro-forma
-3.0% appreciation · 3.0% rent growth · sell at horizon
- IRR
- -26.8%
- Equity multiple
- 0.10×
- Total profit
- $-63,298
- Equity at exit
- $37,276
- IRR
- -24.0%
- Equity multiple
- -0.20×
- Total profit
- $-83,945
- Equity at exit
- $21,615
Cash invested: $70,000 (down + closing). Projections, not guarantees.
Landlord ↔ Tenant lean methodology
- Overall (STATE)
- 15 Strongly Tenant-Friendly
- State New York
- 15 Strongly Tenant-Friendly · D+10
- County
- — inherits STATE
- City
- — inherits STATE
ZIP-level market 14127
- Home prices YoY
- -33.6%
- Active inventory
- 145
- Price-to-rent
- 10.2×
Monthly cashflow live
- Estimated rent
- $2,049 medium interval (Pro) →
- Mortgage (P&I)
- −$1,311
- Tax from tax record
- −$565 /mo · $6,774/yr
- Insurance
- −$104
- HOA
- −$0
- Vacancy / Maint / Mgmt
- −$430
- Net cashflow
- $-361
Break-even live
UW: 25.0% down · 7.5% · 30yr · 1.5% tax · 5.0% vac · 8.0% maint · 8.0% mgmt
Financing live
Cash to close
- Down payment
- $62,500
- Closing costs
- $7,500
- Reserves months
- —
- Total cash needed
- —
Loan-product check · same deal, 3 products live
Conventional
25% down · 7.5% · 30yr
- Down + closing
- —
- Monthly P&I
- —
- Monthly cashflow
- —
- DSCR
- —
- Eligible?
- —
Personal DTI + credit; lowest rate.
DSCR
20% down · 8.5% · 30yr
- Down + closing
- —
- Monthly P&I
- —
- Monthly cashflow
- —
- DSCR
- —
- Eligible?
- —
No personal income docs; deal must DSCR.
Hard money
10% down · 12.0% · 12mo
- Down + closing
- —
- Monthly P&I
- —
- Monthly cashflow
- —
- DSCR
- —
- Eligible?
- —
Short-term bridge; refi at stabilization.
Listing history 2 events
-
2026-05-05status Pending 654-char remark
-
2026-04-25$250,000 Active 654-char remark
ⓘ Source: listings_history table (triggers on properties + properties_extension) + one-shot
backfill from property_details.listing_events for pre-trigger history.
Tax reassessment forecast NY · Partial reset (capped growth)
- Current annual tax
- $6,774 · $565/mo
- Projected year-2 tax
- $6,774 · $565/mo
- Expected delta
- $0/yr ($0/mo · 0.0%)
ⓘ Screening estimate from a state-policy table — verify with the county assessor before closing.
Climate risk First Street
- Flood 1/10 Low FEMA zone X (unshaded) · 0% chance over 30 yrs
- Wildfire 1/10 Low
- Heat 2/10 Low 7 d/yr ≥91°F today · 14 d/yr by 30 yrs out
- Wind 1/10 Low
- Air quality 2/10 Low 1 unhealthy d/yr today · 3 by 30 yrs out
Nearby sold comps map
Loading sold comps map…
Walkable amenities ~0.75 mi
Loading nearby amenities…
Taxation est. · year 1
- Rental income
- $24,593
- − Mortgage interest
- −$14,004
- − Property taxes
- −$6,774
- − Insurance
- −$1,250
- − Repairs & maintenance
- −$1,967
- − Management
- −$1,967
- − Depreciation
- −$7,273
- Taxable loss
- −$8,643
- Est. tax savings @ 24.0%
- +$2,074
- After-tax cash flow
- $-2,254/yr
For passive investors: Depreciation is non-cash, so a rental often shows a tax loss while cash-flowing — sheltering income. Rental losses are passive: they offset passive income freely, and up to $25,000/yr can offset ordinary (W-2) income if you actively participate and your MAGI is under $100k (phasing out to $0 by $150k); unused losses carry forward. On sale, claimed depreciation is recaptured at up to 25%, and gains may owe capital-gains tax (a 1031 exchange can defer both). Figures are a year-1 estimate at your 24.0% rate — not tax advice; consult a CPA.
Schools (NCES district)
- District
- Hamburg Central School District
- NCES district ID
- 3613350
- Math proficiency
- 46% ▼ -26.00%
- Reading proficiency
- 66% ▲ 3.00%
- Median HH income
- $68,342
- Composite
- 49.43/100
- National rank
- #2006
- State rank
- #267 of 590 in NY
Livability — Hamburg
- Score
- 84/100
- State rank
- #43
- US rank
- #692
Category grades
Schools grade is shown separately in the Schools card above.
Census & demographics
- County
- Erie County · 714,559 people
- City population
- 44,520
- Metro
- Buffalo-Cheektowaga, NY
- Population (ZIP)
- 31,543
- Household income
- $109,386
- Rent vs Own
- Severe rent burden
- 428.0
Population outlook (Erie County) Hauer SSP2
- Today (2025)
- 933,037 people
- By 2030
- 935,181 · +0.2%
- By 2040
- 928,531 · -0.5%
- By 2050
- 905,725 · -2.9%
- By 2075
- 834,037 · -10.6%
- By 2100
- 708,033 · -24.1%
Race, ethnicity, and origin ACS 2023
- Neighborhood character
- Predominantly White (92%)
- Race & ethnicity
- White 92% Two or more races 3% Hispanic / Latino 3% Black 1%
- Common ancestry
- Romanian 16% Lithuanian 3% Slovak 2%
- Foreign-born
- 2% · Canada
- Languages at home
- 97% English-only · Spanish 1%
Political lean MEDSL · Erie
- 2024 margin
- Lean D (+9.7) · D 54.8% · R 45.2%
- 2008→2024 swing
- -7.9pp toward R · 2008: 17.5pp · 2024: 9.7pp
- All cycles
- 2024: D+9.7 2020: D+14.7 2016: D+4.8 2012: D+15.6 2008: D+17.5
Not yet ingested
- Civics
- —
Market trends
- HPI YoY
- ▼ -151.52%
- Current HPI
- 298.7896
- Rent YoY
- —
- Metro
- Buffalo-Cheektowaga, NY
- State GDP YoY
- ▲ 2.60%
- F500 in state
- 92
Industry mix (Fortune 500 HQ in NY)
| Industry | F500 HQs | Revenue |
|---|---|---|
| Financial Services | 10 | $950B |
|
||
| Consumer Goods | 9 | $162B |
|
||
| Insurance | 4 | $225B |
|
||
| Telecommunications | 2 | $144B |
|
||
| Pharmaceuticals | 2 | $112B |
|
||
| Media / Entertainment | 2 | $69B |
|
||
Price history
2 events — show timeline
- 2026-05-05 Pending — WNYREIS
- 2026-04-25 Listed $250,000 WNYREIS
Property tax history
+4.6%/yrLatest (2025): $6,774 · +3.8% YoY. Source: county tax records.
Cash-flow waterfall
monthlySold comps — $/sqft
last 12 mo · ≤1 miLoading sold comps…