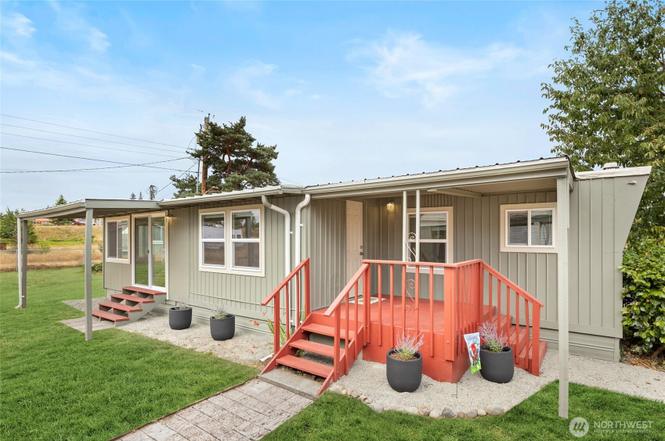
8915 Wilkensen Rd SE #3 · North Yelm, WA
Flood risk 3/10 · Minor
- FEMA flood zone
- X (unshaded)
- Chance of flooding over 30 yrs
- 0.2%
- Est. flood insurance / yr
- $507 – $1,088
Fire risk 4/10 · Minor
- Est. fire insurance / yr
- $604 – $1,122
Heat risk 3/10 · Minor
- Hot days now (above 87°F)
- 7 days/yr
- Hot days in 30 yrs
- 14 days/yr
Wind risk 1/10 · Minimal
- Chance of severe wind over 30 yrs
- —
Air-quality risk 6/10 · Moderate
- Unhealthy air days now
- 7 days/yr
- Unhealthy air days in 30 yrs
- 9 days/yr
Risk factors via First Street. Map © Google.
Why this score? — see what drove the B grade
The composite is a weighted blend of 9 inputs, each scored 0–100. Each bar is that input's sub-score; the figure is the points it added to the 100-point composite (weight × sub-score).
- Cash flow +30.0/30.0
- 1% rule +10.0/10.0
- DSCR +10.0/10.0
- ARV discount +7.5/15.0
- Schools +4.8/10.0
- Rent growth +3.9/5.0
- Livability +3.4/5.0
- Condition / age +2.5/5.0
- Appreciation +0.0/10.0
$83,950
🖨 Deal sheet 📄 Offer letter ✓ Due diligence
Listing remarks
Enjoy a spacious, functional layout in this charming 1-bed, 1-bath single-wide, fully updated with modern finishes. Highlights include a brand-new kitchen, new windows, updated flooring, fresh blinds, washer/dryer, quartz shower, and stainless steel appliances. The home offers a 1-car carport, private storage unit, and a great yard perfect for relaxing or entertaining. Conveniently located near Longmire Park with easy access to downtown Yelm. Stylish, practical, and move-in ready—this home truly has it all! Lot rent is $895/month.
Key facts
- Fresh blinds
- Updated flooring
- Quartz shower
Tags
Property features AI
Finance
- Other: Buyer to verify schools
- Financial info: Land lease: $895/month; Listing terms: Cash or Conventional
- HOA & community: Park name: Yelm MHP & Storage; 31 homes in the park; Pets: see remarks; Park approved for sale
Exterior
- Parking: Carport
- Utilities: Community water (included in park rent); Sewer included in park rent; Puget Sound Energy power; Comcast/Xfinity cable and internet
- Home design: Manufactured home (single wide); One level; Vagabond "Kings Meadow" model; Aluminum skirting
- Construction: Cement construction materials
- Exterior features: Cement/Concrete exterior; Storage on driveway; Common area in the park; RV parking in the park
Interior
- Kitchen: Dishwasher; Microwave; Refrigerator; Stove/Range
- Bedrooms: 1 bedroom
- Flooring: Vinyl plank; Carpet
- Bathrooms: 1 full bath; 1 bathtub; 1 shower
- Heating & cooling: Forced air heating; Electric energy source
- Interior features: Dining room; Entry; Dishwasher; Dryer; Microwave; Refrigerator; Stove/Range; Washer
- Laundry & utility: Washer; Dryer
Neighborhood map
What this means for you Summary
Snapshot
- This is a 1-bed/1.0-bath manufactured listed at $84k.
Deal economics
- At list price, monthly cash flow is $732 ($9k/yr) — positive.
- The deal already cash-flows at list — no discount required.
- Meets the 1% rule at list price ($2k rent vs $84k).
- Recommended offer: $76k (9.0% below list) — sets the bar for market timing.
- Cap rate 16.8% vs local median 4.4% in North Yelm — top-decile yield for the area; either an underpriced asset or a hidden risk that comps aren't pricing in. Stress-test before assuming the spread holds.
Location & tenants
- Location reads 68/100 on livability (#277 in WA) — a middle-class / working-renter tenant base. Strengths: housing A+, cost of living A, crime B; Watch: health & safety C-, commute D+, schools F.
- Yelm School District (rural): math 48% / reading 59% proficiency, ranked #108 of 291 in WA (top 37%) — acceptable for families but not a draw, mixed tenant base, ~2y average lease.
- Market conditions: Rents rising fast (+5.8%/yr); 431 active listings in the ZIP; solid renter incomes; 1,222 units permitted in Thurston County in 2024 (508 in 5+ unit buildings).
Forward outlook
- Local home prices are declining (-3.0%/yr); year-one equity from $580 of loan paydown is wiped out by about $3k of value loss. Plan a longer hold.
- Thurston County population projected at +27% by 2050 — long-run rental-demand tailwind backs the buy-and-hold thesis.
- At projected returns (-3.0% appreciation + 5.8% rent growth), your $24k cash investment doubles in ~3 years — after that, you're playing with house money.
Negotiation context
- It's been on market 111 days — a 9% lower offer ($76k) is reasonable based on typical stale-listing flexibility.
Questions for the listing agent
- It's been on market 111 days. Have you received any prior offers? Is the seller open to a 9% concession, seller financing, or rate buy-down credit?
- Built in 1964 — when were the roof, HVAC, electrical panel, plumbing, and water heater last replaced?
- Why hasn't it sold? Are there any deal-killer items the seller is aware of (foundation, flood, title, zoning, code violations)?
- Is there a deadline driving the sale (1031 exchange, divorce, estate, relocation)? That informs how much negotiation room exists.
- Schools are F-rated, which usually means shorter tenancies and higher turnover. Who's the typical renter profile here, and what's been the actual vacancy rate?
- What's the average days-on-market for RENTAL listings here right now (not sales)? A rising rental-DOM trend means longer vacancies and softer asking-rent achievability than the comps imply.
- What's the recent tenant-quality profile in this submarket — average credit score on applications, eviction rate, late-payment / NSF rate, and stable-employment percentage? A property-management company in the area should have these aggregated.
- How much new for-sale + rental construction is in the pipeline within 1–3 miles? Heavy new supply typically softens prices + rents 12–24 months out; constrained supply supports both.
Investment metrics
- 1% rule
- 1.98% ✓
- Cap rate
- 16.76%
- Cash-on-cash
- 37.38%
- DSCR
- 2.66
- GRM
- 4.2
CMA / ARV
No comps found within radius.
Projected returns pro-forma
-3.0% appreciation · 5.78% rent growth · sell at horizon
- IRR
- 36.5%
- Equity multiple
- 2.61×
- Total profit
- $37,837
- Equity at exit
- $12,517
- IRR
- 44.5%
- Equity multiple
- 5.84×
- Total profit
- $113,855
- Equity at exit
- $7,258
Cash invested: $23,506 (down + closing). Projections, not guarantees.
Landlord ↔ Tenant lean methodology
- Overall (STATE)
- 28 Tenant-Leaning
- State Washington
- 28 Tenant-Leaning · D+8
- County
- — inherits STATE
- City
- — inherits STATE
ZIP-level market 98597
- Rents YoY
- 5.8%
- Active inventory
- 431
- Price-to-rent
- 4.2×
Monthly cashflow live
- Estimated rent
- $1,661 medium interval (Pro) →
- Mortgage (P&I)
- −$440
- Tax est. 1.5%
- −$105 /mo · $1,259/yr
- Insurance
- −$35
- HOA
- −$0
- Vacancy / Maint / Mgmt
- −$349
- Net cashflow
- $732
Break-even live
UW: 25.0% down · 7.5% · 30yr · 1.5% tax · 5.0% vac · 8.0% maint · 8.0% mgmt
Financing live
Cash to close
- Down payment
- $20,988
- Closing costs
- $2,518
- Reserves months
- —
- Total cash needed
- —
Loan-product check · same deal, 3 products live
Conventional
25% down · 7.5% · 30yr
- Down + closing
- —
- Monthly P&I
- —
- Monthly cashflow
- —
- DSCR
- —
- Eligible?
- —
Personal DTI + credit; lowest rate.
DSCR
20% down · 8.5% · 30yr
- Down + closing
- —
- Monthly P&I
- —
- Monthly cashflow
- —
- DSCR
- —
- Eligible?
- —
No personal income docs; deal must DSCR.
Hard money
10% down · 12.0% · 12mo
- Down + closing
- —
- Monthly P&I
- —
- Monthly cashflow
- —
- DSCR
- —
- Eligible?
- —
Short-term bridge; refi at stabilization.
Listing history 16 events
-
2026-06-18days on market $83,950 Active 111 DOM
-
2026-06-17days on market $83,950 Active 110 DOM
-
2026-06-16days on market $83,950 Active 109 DOM
-
2026-06-15days on market $83,950 Active 108 DOM
-
2026-06-14days on market $83,950 Active 106 DOM
-
2026-06-13days on market $83,950 Active 105 DOM
-
2026-06-10days on market $83,950 Active 103 DOM
-
2026-06-09days on market $83,950 Active 102 DOM
-
2026-06-08days on market $83,950 Active 101 DOM
-
2026-06-07days on market $83,950 Active 100 DOM
-
2026-06-02days on market $83,950 Active 95 DOM
-
2026-06-01days on market $83,950 Active 94 DOM
-
2026-05-31days on market $83,950 Active 93 DOM
-
2026-05-30days on market $83,950 Active 92 DOM
-
2026-04-21price $83,950
-
2026-02-27$88,900 Active
ⓘ Source: listings_history table (triggers on properties + properties_extension) + one-shot
backfill from property_details.listing_events for pre-trigger history.
Climate risk First Street
- Flood 3/10 Moderate FEMA zone X (unshaded) · 20% chance over 30 yrs
- Wildfire 4/10 Moderate
- Heat 3/10 Moderate 7 d/yr ≥87°F today · 14 d/yr by 30 yrs out
- Wind 1/10 Low
- Air quality 6/10 Major 7 unhealthy d/yr today · 9 by 30 yrs out
Nearby sold comps map
Loading sold comps map…
Walkable amenities ~0.75 mi
Loading nearby amenities…
Taxation est. · year 1
- Rental income
- $19,936
- − Mortgage interest
- −$4,703
- − Property taxes
- −$1,259
- − Insurance
- −$420
- − Repairs & maintenance
- −$1,595
- − Management
- −$1,595
- − Depreciation
- −$2,442
- Taxable income
- $7,922
- Est. tax owed @ 24.0%
- −$1,901
- After-tax cash flow
- $6,886/yr
For passive investors: Depreciation is non-cash, so a rental often shows a tax loss while cash-flowing — sheltering income. Rental losses are passive: they offset passive income freely, and up to $25,000/yr can offset ordinary (W-2) income if you actively participate and your MAGI is under $100k (phasing out to $0 by $150k); unused losses carry forward. On sale, claimed depreciation is recaptured at up to 25%, and gains may owe capital-gains tax (a 1031 exchange can defer both). Figures are a year-1 estimate at your 24.0% rate — not tax advice; consult a CPA.
Schools (NCES district)
- District
- Yelm School District
- NCES district ID
- 5310140
- Math proficiency
- 48% ▲ 1.00%
- Reading proficiency
- 59% ▲ 1.00%
- Median HH income
- $58,328
- Composite
- 48.34/100
- National rank
- #4685
- State rank
- #108 of 291 in WA
Livability — North Yelm
- Score
- 68/100
- State rank
- #277
- US rank
- #9538
Category grades
Schools grade is shown separately in the Schools card above.
Census & demographics
- Census place
- North Yelm, WA
- County
- Thurston County · 269,345 people
- City population
- 61
- Metro
- Olympia-Lacey-Tumwater, WA
- Population (ZIP)
- 26,669
- Household income
- $92,219
- Rent vs Own
- Severe rent burden
- 259.0
Population outlook (Thurston County) Hauer SSP2
- Today (2025)
- 308,239 people
- By 2030
- 326,483 · +5.9%
- By 2040
- 359,890 · +16.8%
- By 2050
- 391,800 · +27.1%
- By 2075
- 468,024 · +51.8%
- By 2100
- 519,890 · +68.7%
Race, ethnicity, and origin ACS 2023
- Neighborhood character
- Predominantly White (76%)
- Race & ethnicity
- White 76% Two or more races 10% Hispanic / Latino 10% Black 3% Pacific Islander 2% Asian 2%
- Hispanic origin (detail)
- Mexican 7% Puerto Rican 1%
- Common ancestry
- Portuguese 5% Romanian 4% Lithuanian 3%
- Foreign-born
- 7% · Canada, South Korea
- Languages at home
- 90% English-only · Spanish 6% German/W. Germanic 1% Other Asian/Pacific 1%
Political lean MEDSL · Thurston
- 2024 margin
- Strong D (+20.4) · D 58.5% · R 38.1% · Other 3.5%
- 2008→2024 swing
- -1.3pp toward R · 2008: 21.7pp · 2024: 20.4pp
- All cycles
- 2024: D+20.4 2020: D+18.6 2016: D+15.4 2012: D+19.0 2008: D+21.7
Not yet ingested
- Civics
- —
Market trends
- HPI YoY
- ▼ -192.07%
- Current HPI
- 326.4361
- Rent YoY
- ▲ 5.78%
- Metro
- Olympia-Lacey-Tumwater, WA
- State GDP YoY
- ▲ 4.65%
- F500 in state
- 22
Industry mix (Fortune 500 HQ in WA)
| Industry | F500 HQs | Revenue |
|---|---|---|
| Retail | 2 | $269B |
|
||
| Technology / Retail | 1 | $638B |
|
||
| Technology | 1 | $245B |
|
||
| Telecommunications | 1 | $38B |
|
||
| Food / Beverage | 1 | $36B |
|
||
| Automotive / Trucks | 1 | $34B |
|
||
Price history
-5.6% since first listed2 events — show timeline
- 2026-04-21 Price Changed $83,950 NWMLS as Distributed by MLS Grid
- 2026-02-27 Listed $88,900 NWMLS as Distributed by MLS Grid
Property tax history
+3.6%/yrLatest (2026): $52 · -7.6% YoY. Source: county tax records.
Cash-flow waterfall
monthlySold comps — $/sqft
last 12 mo · ≤1 miLoading sold comps…