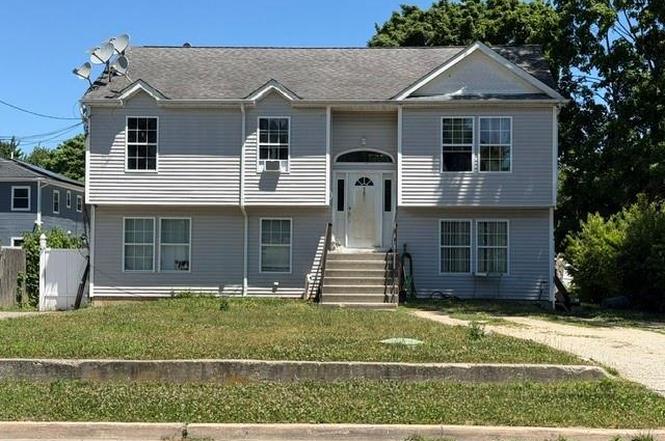
104 Jefferson Ave · Wyandanch, NY
Flood risk 4/10 · Minor
- FEMA flood zone
- X (unshaded)
- Chance of flooding over 30 yrs
- 0.22%
- Est. flood insurance / yr
- $473 – $860
Fire risk 1/10 · Minimal
- Est. fire insurance / yr
- $691 – $1,283
Heat risk 5/10 · Moderate
- Hot days now (above 94°F)
- 7 days/yr
- Hot days in 30 yrs
- 16 days/yr
Wind risk 6/10 · Moderate
- Chance of severe wind over 30 yrs
- 64.0%
Air-quality risk 4/10 · Minor
- Unhealthy air days now
- 5 days/yr
- Unhealthy air days in 30 yrs
- 7 days/yr
Risk factors via First Street. Map © Google.
Why this score? — see what drove the D+ grade
The composite is a weighted blend of 9 inputs, each scored 0–100. Each bar is that input's sub-score; the figure is the points it added to the 100-point composite (weight × sub-score).
- ARV discount +15.0/15.0
- Cash flow +10.7/30.0
- 1% rule +5.0/10.0
- Livability +3.2/5.0
- DSCR +3.1/10.0
- Schools +3.0/10.0
- Rent growth +2.5/5.0
- Condition / age +2.5/5.0
- Appreciation +0.0/10.0
$499,000
🖨 Deal sheet 📄 Offer letter ✓ Due diligence
Listing remarks
Short Sale, Subject To Bank Approval, Large Hi-Ranch, 5 Bedrooms, 3 Full Bathrooms, Kitchen, Living Room, Large Property, Close To All, Sold As Is.
Key facts
- 6,720 sq ft lot
- Built 2004
Property features AI
Exterior
- Parking: Private driveway
- Utilities: Cesspool sewer; Water available and connected
- Home design: Single family residence; Living area per public records
- Construction: Frame construction with vinyl siding
- Exterior features: Not waterfront; No additional parcels
Interior
- Kitchen: No appliances listed
- Bedrooms: Includes at least one bedroom on the first floor
- Bathrooms: 3 full bathrooms
- Heating & cooling: Hot water heating; Oil-fired heating; No central air conditioning
- Interior features: First-floor bedroom; First-floor full bath; Total of 8 rooms
- Laundry & utility: No washer/dryer or utility appliances listed
Neighborhood map
What this means for you Summary
Snapshot
- This is a 5-bed/3.0-bath single-family listed at $499k.
Deal economics
- At list price, monthly cash flow is $-235 ($-3k/yr) — negative.
- To cash-flow at today's rent, offer at most $458k (8.3% below list).
- Meets the 1% rule at list price ($5k rent vs $499k).
- Recommended offer: $458k (8.3% below list) — sets the bar for cash-flow.
- Cap rate 5.7% vs local median 3.4% in Wyandanch — top-decile yield for the area; either an underpriced asset or a hidden risk that comps aren't pricing in. Stress-test before assuming the spread holds.
Location & tenants
- Location reads 65/100 on livability (#701 in NY) — a middle-class / working-renter tenant base. Strengths: commute A+, employment A+, housing A+; Watch: crime D+, amenities F, cost of living F.
- Wyandanch Union Free School District (suburban): math 29% / reading 32% proficiency, ranked #717 of 755 in NY (top 95%) — families likely to look elsewhere, expect single-tenant / working-renter base with shorter leases; 77% free/reduced lunch — lower-income household profile, screen leases tightly.
- Zoned schools: Martin Luther King Elementary School (math 30% / reading 30%, grade F, #1,689 of 2,108 statewide, top 81%, 621 students, 89% FRL); Milton L Olive Middle School (math 10% / reading 30%, grade F, #666 of 729 statewide, top 93%, 581 students, 88% FRL); Wyandanch Memorial High School (math 57% / reading 77%, grade B, #746 of 1,100 statewide, top 69%, 843 students, 87% FRL).
- Market conditions: 82 active listings in the ZIP; 1 comparable units currently listed for rent nearby; 1,366 units permitted in Suffolk County in 2024 (216 in 5+ unit buildings).
Forward outlook
- Local home prices are declining (-3.0%/yr); year-one equity from $3k of loan paydown is wiped out by about $15k of value loss. Plan a longer hold.
- Suffolk County population projected to shrink 5% by 2050 — rents likely to lag national; underwrite the cash flow, not the appreciation.
Negotiation context
- Only 2 days on market — expect competitive offers; lowballing is unlikely to land.
- 2 sale attempts since 10y ago with the ask held roughly flat each time — persistent listings suggest the price (not the market) is what's stuck; bring a comps-based counter.
- Current owner paid $374k; 33% above their basis — modest negotiation headroom, anchor on the comps not their cost.
Risks & watch-outs
- Watch-outs: property tax is 3.3% of price.
- Climate carrying-cost: major wind risk, 64% chance of damaging wind over 30y; extreme-heat days projected 7→16/yr by 2055 (HVAC capex compounding) — expect insurance premiums to compound above CPI over the hold.
Questions for the listing agent
- What do current leases actually rent for vs. the listed asking? Can we see a recent rent roll and the last 12 months of T-12 income?
- Property tax is high relative to price — has the assessment been appealed recently, and will the sale trigger a re-assessment?
- Is there a deadline driving the sale (1031 exchange, divorce, estate, relocation)? That informs how much negotiation room exists.
- Schools are D-rated, which usually means shorter tenancies and higher turnover. Who's the typical renter profile here, and what's been the actual vacancy rate?
- Crime grade is D in this area — have there been break-ins, vandalism, or insurance claims at this property in the last 3 years? What carrier currently insures it and at what premium?
- The area grade is low — what's the realistic commute time and amenity access for the typical tenant pool here? Any planned neighborhood developments (good or bad) we should know about?
- What's the average days-on-market for RENTAL listings here right now (not sales)? A rising rental-DOM trend means longer vacancies and softer asking-rent achievability than the comps imply.
- What's the recent tenant-quality profile in this submarket — average credit score on applications, eviction rate, late-payment / NSF rate, and stable-employment percentage? A property-management company in the area should have these aggregated.
- How much new for-sale + rental construction is in the pipeline within 1–3 miles? Heavy new supply typically softens prices + rents 12–24 months out; constrained supply supports both.
Investment metrics
- 1% rule
- 1.00% ✓
- Cap rate
- 5.73%
- Cash-on-cash
- -2.01%
- DSCR
- 0.91
- GRM
- 8.3
CMA / ARV
- ARV (on-the-fly)
- $698,326
- Comps found
- 12
Show comp detail 12 sales within ~0.75 mi
| Address | Dist | Beds/Ba | Sqft | Sold | Price | $/sf | Match |
|---|---|---|---|---|---|---|---|
| 58 Brook Ave | 0.30mi | 5/3.0 | 2,254 (+4%) | 2mo | $460,000 | $204 | 77 |
| 119 Jefferson Ave | 0.08mi | 6/3.0 (+1) | 2,100 (-3%) | 15mo | $600,000 | $286 | 74 |
| 81 Irving Ave | 0.22mi | 6/2.0 (+1) | 2,250 (+4%) | 7mo | $633,450 | $282 | 68 |
| 116 Arlington Ave | 0.13mi | 4/2.0 (-1) | 1,850 (-14%) | 9mo | $540,000 | $292 | 53 |
| 32 Mccue Ave | 0.74mi | 6/2.0 (+1) | 2,120 (-2%) | 4mo | $685,000 | $323 | 50 |
| 17 Wright St | 0.70mi | 5/2.0 | 2,037 (-6%) | 7mo | $600,000 | $295 | 48 |
| 61 S 21st St | 0.63mi | 5/2.0 | 2,000 (-8%) | 8mo | $565,000 | $283 | 48 |
| 371 W 20th St | 0.74mi | 4/2.0 (-1) | 2,088 (-3%) | 6mo | $710,000 | $340 | 46 |
| 226 W 18th St | 0.62mi | 4/2.5 (-1) | 1,920 (-11%) | 0mo | $670,000 | $349 | 45 |
| 301 New Ave | 0.40mi | 5/2.0 | 1,842 (-15%) | 12mo | $610,000 | $331 | 43 |
| 384 W 22nd St | 0.68mi | 5/2.5 | 1,883 (-13%) | 5mo | $700,000 | $372 | 40 |
| 36 N 15th St | 0.73mi | 6/2.0 (+1) | 1,880 (-13%) | 4mo | $635,000 | $338 | 32 |
Match score weights: distance 35% · size 25% · config 20% · recency 20%. Top-matched comps best support the ARV.
Projected returns pro-forma
-3.0% appreciation · 3.0% rent growth · sell at horizon
- IRR
- -19.5%
- Equity multiple
- 0.32×
- Total profit
- $-95,269
- Equity at exit
- $74,403
- IRR
- -12.0%
- Equity multiple
- 0.28×
- Total profit
- $-100,049
- Equity at exit
- $43,144
Cash invested: $139,720 (down + closing). Projections, not guarantees.
Landlord ↔ Tenant lean methodology
- Overall (STATE)
- 15 Strongly Tenant-Friendly
- State New York
- 15 Strongly Tenant-Friendly · D+10
- County
- — inherits STATE
- City
- — inherits STATE
ZIP-level market 11798
- Active inventory
- 82
- Price-to-rent
- 8.3×
Monthly cashflow live
- Estimated rent
- $4,999 medium interval (Pro) →
- Mortgage (P&I)
- −$2,617
- Tax from tax record
- −$1,359 /mo · $16,308/yr
- Insurance
- −$208
- HOA
- −$0
- Vacancy / Maint / Mgmt
- −$1,050
- Net cashflow
- $-235
Break-even live
UW: 25.0% down · 7.5% · 30yr · 1.5% tax · 5.0% vac · 8.0% maint · 8.0% mgmt
Financing live
Cash to close
- Down payment
- $124,750
- Closing costs
- $14,970
- Reserves months
- —
- Total cash needed
- —
Loan-product check · same deal, 3 products live
Conventional
25% down · 7.5% · 30yr
- Down + closing
- —
- Monthly P&I
- —
- Monthly cashflow
- —
- DSCR
- —
- Eligible?
- —
Personal DTI + credit; lowest rate.
DSCR
20% down · 8.5% · 30yr
- Down + closing
- —
- Monthly P&I
- —
- Monthly cashflow
- —
- DSCR
- —
- Eligible?
- —
No personal income docs; deal must DSCR.
Hard money
10% down · 12.0% · 12mo
- Down + closing
- —
- Monthly P&I
- —
- Monthly cashflow
- —
- DSCR
- —
- Eligible?
- —
Short-term bridge; refi at stabilization.
Rent comps 1 comps
| Address | Beds | Baths | Sqft | Rent | $/sqft | DOM | Units | Dist |
|---|---|---|---|---|---|---|---|---|
| 19 Washington Ave Wyandanch, NY | 6.0 | 1.5 | 2200 | $4,999 | $2.27 | 17d | 1 | 0.66mi |
Listing history 3 events
-
2026-06-18days on market $499,000 Active 2 DOM
-
2026-06-17remarks 147-char remark
-
2026-06-17$499,000 Active 1 DOM
ⓘ Source: listings_history table (triggers on properties + properties_extension) + one-shot
backfill from property_details.listing_events for pre-trigger history.
Tax reassessment forecast NY · Partial reset (capped growth)
- Current annual tax
- $16,308 · $1,359/mo
- Projected year-2 tax
- $16,308 · $1,359/mo
- Expected delta
- $0/yr ($0/mo · 0.0%)
ⓘ Screening estimate from a state-policy table — verify with the county assessor before closing.
Climate risk First Street
- Flood 4/10 Moderate FEMA zone X (unshaded) · 22% chance over 30 yrs
- Wildfire 1/10 Low
- Heat 5/10 Major 7 d/yr ≥94°F today · 16 d/yr by 30 yrs out
- Wind 6/10 Major 64% chance of damaging wind over 30 yrs
- Air quality 4/10 Moderate 5 unhealthy d/yr today · 7 by 30 yrs out
Nearby sold comps map
Loading sold comps map…
Walkable amenities ~0.75 mi
Loading nearby amenities…
Taxation est. · year 1
- Rental income
- $59,988
- − Mortgage interest
- −$27,952
- − Property taxes
- −$16,308
- − Insurance
- −$2,495
- − Repairs & maintenance
- −$4,799
- − Management
- −$4,799
- − Depreciation
- −$14,516
- Taxable loss
- −$10,881
- Est. tax savings @ 24.0%
- +$2,611
- After-tax cash flow
- $-203/yr
For passive investors: Depreciation is non-cash, so a rental often shows a tax loss while cash-flowing — sheltering income. Rental losses are passive: they offset passive income freely, and up to $25,000/yr can offset ordinary (W-2) income if you actively participate and your MAGI is under $100k (phasing out to $0 by $150k); unused losses carry forward. On sale, claimed depreciation is recaptured at up to 25%, and gains may owe capital-gains tax (a 1031 exchange can defer both). Figures are a year-1 estimate at your 24.0% rate — not tax advice; consult a CPA.
Schools (NCES district)
- District
- Wyandanch Union Free School District
- NCES district ID
- 3631800
- Math proficiency
- 29% ▲ 5.00%
- Reading proficiency
- 32% ▲ 2.00%
- Median HH income
- $56,193
- Composite
- 30.02/100
- National rank
- #11631
- State rank
- #717 of 755 in NY
Livability — Wyandanch
- Score
- 65/100
- State rank
- #701
- US rank
- #13223
Category grades
Schools grade is shown separately in the Schools card above.
Census & demographics
- Census place
- Wyandanch, NY
Population outlook (Suffolk County) Hauer SSP2
- Today (2025)
- 1,505,262 people
- By 2030
- 1,498,318 · -0.5%
- By 2040
- 1,471,101 · -2.3%
- By 2050
- 1,424,848 · -5.3%
- By 2075
- 1,337,157 · -11.2%
- By 2100
- 1,217,720 · -19.1%
Not yet ingested
- Political lean
- —
- Race & ethnicity
- —
- Common origin
- —
- Civics
- —
Market trends
- HPI YoY
- ▼ -296.70%
- Current HPI
- 285.1922
- Rent YoY
- —
- Metro
- —
- State GDP YoY
- ▲ 2.60%
- F500 in state
- 92
Industry mix (Fortune 500 HQ in NY)
| Industry | F500 HQs | Revenue |
|---|---|---|
| Financial Services | 10 | $950B |
|
||
| Consumer Goods | 9 | $162B |
|
||
| Insurance | 4 | $225B |
|
||
| Telecommunications | 2 | $144B |
|
||
| Pharmaceuticals | 2 | $112B |
|
||
| Media / Entertainment | 2 | $69B |
|
||
Price history
+1008.9% since first listed8 events — show timeline
- 2026-06-12 Listed $499,000 OneKey® MLS as Distributed by MLS Grid
- 2020-06-18 Listing Removed — OneKey® MLS as Distributed by MLS Grid
- 2020-03-27 Pending — OneKey® MLS as Distributed by MLS Grid
- 2016-08-12 Listing Removed — OneKey® MLS as Distributed by MLS Grid
- 2016-03-23 Listed $189,000 OneKey® MLS as Distributed by MLS Grid
- 2007-12-21 Sold (Public Records) $373,900 Public Records
- 2004-04-23 Sold (Public Records) $82,500 Public Records
- 2004-01-30 Sold (Public Records) $45,000 Public Records
Property tax history
+3.7%/yrLatest (2025): $16,308 · +0.0% YoY. Source: county tax records.
Cash-flow waterfall
monthlySold comps — $/sqft
last 12 mo · ≤1 miLoading sold comps…