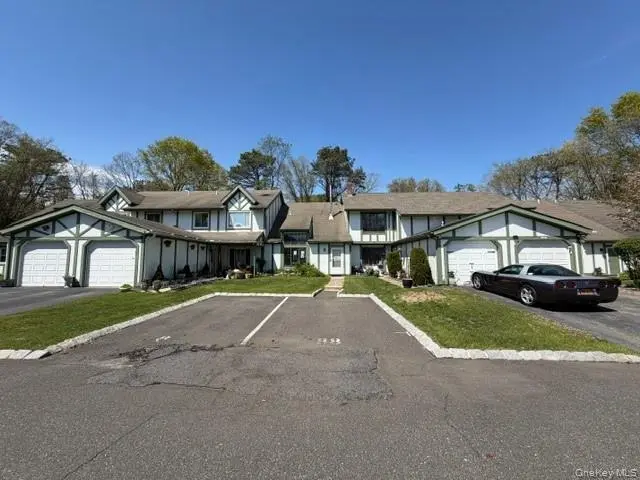
88 Drexelgate Ct · Middle Island, NY
Flood risk 1/10 · Minimal
- FEMA flood zone
- X (unshaded)
- Chance of flooding over 30 yrs
- 0.0%
- Est. flood insurance / yr
- $507 – $1,088
Fire risk 5/10 · Moderate
- Est. fire insurance / yr
- $691 – $1,283
Heat risk 5/10 · Moderate
- Hot days now (above 93°F)
- 7 days/yr
- Hot days in 30 yrs
- 19 days/yr
Wind risk 8/10 · Major
- Chance of severe wind over 30 yrs
- 80.0%
Air-quality risk 4/10 · Minor
- Unhealthy air days now
- 3 days/yr
- Unhealthy air days in 30 yrs
- 5 days/yr
Risk factors via First Street. Map © Google.
Why this score? — see what drove the D grade
The composite is a weighted blend of 9 inputs, each scored 0–100. Each bar is that input's sub-score; the figure is the points it added to the 100-point composite (weight × sub-score).
- ARV discount +15.0/15.0
- Cash flow +7.9/30.0
- Schools +5.2/10.0
- 1% rule +5.0/10.0
- Livability +3.2/5.0
- Rent growth +2.5/5.0
- Condition / age +2.5/5.0
- DSCR +1.9/10.0
- Appreciation +0.0/10.0
$269,000
🖨 Deal sheet (PDF) 📄 Offer letter ✓ Due diligence
Listing remarks
Spacious middle-unit townhouse offering 2 bedrooms, 1.5 baths, and a versatile loft for added living or work-from-home space. Features include in-unit laundry, a cozy wood-burning stove, private patio, and full attic providing ample storage. Enjoy a well-maintained community with basketball and tennis courts, in-ground pool, clubhouse, snow removal, and grounds maintenance. Ideally located just minutes from shopping, restaurants, and public transportation. A great opportunity to make this home your own.
Key facts
- In-ground pool
- Wood-burning stove
- In-unit laundry
Tags
Neighborhood map
What this means for you Summary
Snapshot
- This is a 2-bed/1.5-bath single-family listed at $269k.
Deal economics
- At list price, monthly cash flow is $-291 ($-3k/yr) — negative.
- To cash-flow at today's rent, offer at most $218k (19.1% below list).
- Meets the 1% rule at list price ($3k rent vs $269k).
- Recommended offer: $218k (19.1% below list) — sets the bar for cash-flow.
- Cap rate 5.0% vs local median 3.3% in Middle Island — top-decile yield for the area; either an underpriced asset or a hidden risk that comps aren't pricing in. Stress-test before assuming the spread holds.
Location & tenants
- Location reads 65/100 on livability (#703 in NY) — a middle-class / working-renter tenant base. Strengths: employment A+, housing A+; Watch: crime C-, amenities F, commute F.
- Longwood Central School District (rural): math 61% / reading 55% proficiency, ranked #235 of 590 in NY (top 40%) — acceptable for families but not a draw, mixed tenant base, ~2y average lease.
- Zoned schools: Longwood High School (math 90% / reading 77%, grade A, #409 of 1,100 statewide, top 39%, 2,977 students, 44% FRL).
- Zoned-school proficiency averages 84% at this address vs 58% district-wide (+26 pts) — the actual schools serving this property are materially stronger than the Longwood Central School District average implies; a family-tenant draw the district grade alone would hide.
- Market conditions: 123 active listings in the ZIP; 18 comparable units currently listed for rent nearby; rentals lingering (median 46d on market — plan ~5-8 weeks vacancy on turnover, expect pricing pressure); 61% of comp listings sitting > 30 days — soft ceiling on asking rent; 1,366 units permitted in Suffolk County in 2024 (216 in 5+ unit buildings).
Forward outlook
- Local home prices are declining (-3.0%/yr); year-one equity from $2k of loan paydown is wiped out by about $8k of value loss. Plan a longer hold.
- Suffolk County population projected to shrink 5% by 2050 — rents likely to lag national; underwrite the cash flow, not the appreciation.
Negotiation context
- It's been on market 34 days — a 3% lower offer ($261k) is reasonable based on typical stale-listing flexibility.
- 4 sale attempts since 8y ago; this cycle's ask has dropped $41k (13%) from the opening price — seller is motivated, your offer sets the floor, not the list.
- Current owner paid $113k; list at $269k implies a 138% gain — meaningful room to come down on a strong offer.
Risks & watch-outs
- Climate carrying-cost: severe wind risk, 80% chance of damaging wind over 30y; moderate wildfire risk; extreme-heat days projected 7→19/yr by 2055 (HVAC capex compounding) — expect insurance premiums to compound above CPI over the hold.
Questions for the listing agent
- What do current leases actually rent for vs. the listed asking? Can we see a recent rent roll and the last 12 months of T-12 income?
- It's been on market 34 days. Have you received any prior offers? Is the seller open to a 19% concession, seller financing, or rate buy-down credit?
- Built in 1975 — when were the roof, HVAC, electrical panel, plumbing, and water heater last replaced?
- What does the HOA fee cover, when was the last increase, and are there any pending special assessments or reserve-fund shortfalls?
- Is there a deadline driving the sale (1031 exchange, divorce, estate, relocation)? That informs how much negotiation room exists.
- Schools are B-rated — typically a magnet for longer-tenancy family renters. What's the average tenant stay here, and is there a school-zone premium baked into asking?
- The area grade is low — what's the realistic commute time and amenity access for the typical tenant pool here? Any planned neighborhood developments (good or bad) we should know about?
- What's the average days-on-market for RENTAL listings here right now (not sales)? A rising rental-DOM trend means longer vacancies and softer asking-rent achievability than the comps imply.
- What's the recent tenant-quality profile in this submarket — average credit score on applications, eviction rate, late-payment / NSF rate, and stable-employment percentage? A property-management company in the area should have these aggregated.
- How much new for-sale + rental construction is in the pipeline within 1–3 miles? Heavy new supply typically softens prices + rents 12–24 months out; constrained supply supports both.
Investment metrics
- 1% rule
- 1.00% ✓
- Cap rate
- 4.99%
- Cash-on-cash
- -4.64%
- DSCR
- 0.79
- GRM
- 8.3
CMA / ARV
- ARV (median comp)
- $429,500
- List price
- $269,000
- Delta
- -37.37%
- Verdict
- UNDERPRICED
- Comps
- 20 within 1.0 mi
Show comp detail 3 sales within ~0.75 mi
| Address | Dist | Beds/Ba | Sqft | Sold | Price | $/sf | Match |
|---|---|---|---|---|---|---|---|
| 26 Amesworth Ct | 0.30mi | 2/1.5 | 1,133 (0%) | 0mo | $385,000 | $340 | 86 |
| 7 Artist Dr | 0.65mi | 3/1.0 (+1) | 1,148 (+1%) | 6mo | $500,000 | $436 | 55 |
| 7 Maple Rd | 0.69mi | 3/3.0 (+1) | 1,176 (+4%) | 3mo | $620,000 | $527 | 48 |
Match score weights: distance 35% · size 25% · config 20% · recency 20%. Top-matched comps best support the ARV.
Projected returns pro-forma
-3.0% appreciation · 3.0% rent growth · sell at horizon
- IRR
- -23.9%
- Equity multiple
- 0.18×
- Total profit
- $-61,736
- Equity at exit
- $40,109
- IRR
- -18.6%
- Equity multiple
- -0.01×
- Total profit
- $-76,047
- Equity at exit
- $23,258
Cash invested: $75,320 (down + closing). Projections, not guarantees.
Landlord ↔ Tenant lean methodology
- Overall (STATE)
- 15 Strongly Tenant-Friendly
- State New York
- 15 Strongly Tenant-Friendly · D+10
- County
- — inherits STATE
- City
- — inherits STATE
ZIP-level market 11953
- Home prices YoY
- -20.2%
- Active inventory
- 123
- Price-to-rent
- 8.3×
Monthly cashflow live
- Estimated rent
- $2,702 high interval (Pro) →
- Mortgage (P&I)
- −$1,411
- Tax from tax record
- −$508 /mo · $6,094/yr
- Insurance
- −$112
- HOA
- −$395
- Vacancy / Maint / Mgmt
- −$567
- Net cashflow
- $-291
Break-even live
Sensitivity live
| Price | -10% $-139 | -5% $-215 | +0% $-291 | +5% $-367 | +10% $-443 |
|---|---|---|---|---|---|
| Rent | -10% $-504 | -5% $-398 | +0% $-291 | +5% $-184 | +10% $-78 |
| Rate | -1.0pp $-156 | -0.5pp $-223 | base $-291 | +0.5pp $-361 | +1.0pp $-432 |
UW: 25.0% down · 7.5% · 30yr · 1.5% tax · 5.0% vac · 8.0% maint · 8.0% mgmt
Financing live
Cash to close
- Down payment
- $67,250
- Closing costs
- $8,070
- Reserves months
- —
- Total cash needed
- —
Loan-product check · same deal, 3 products live
Conventional
25% down · 7.5% · 30yr
- Down + closing
- —
- Monthly P&I
- —
- Monthly cashflow
- —
- DSCR
- —
- Eligible?
- —
Personal DTI + credit; lowest rate.
DSCR
20% down · 8.5% · 30yr
- Down + closing
- —
- Monthly P&I
- —
- Monthly cashflow
- —
- DSCR
- —
- Eligible?
- —
No personal income docs; deal must DSCR.
Hard money
10% down · 12.0% · 12mo
- Down + closing
- —
- Monthly P&I
- —
- Monthly cashflow
- —
- DSCR
- —
- Eligible?
- —
Short-term bridge; refi at stabilization.
Rent comps 18 comps
| Address | Beds | Baths | Sqft | Rent | $/sqft | DOM | Units | Dist |
|---|---|---|---|---|---|---|---|---|
| 524 Tudor Ln Unit 524 Middle Island, NY | 2.0 | 1.0 | 897 | $2,780 | $3.10 | 45d | 1 | 0.80mi |
| 301 Tudor Ln Unit 301 Middle Island, NY | 2.0 | 1.0 | 897 | $2,780 | $3.10 | 45d | 1 | 0.87mi |
| 255 Wading River Hollow Rd Ridge, NY | 2.0–3.0 | 2.0–2.5 | 1441 | $3,615 | $2.51 | 0d | 1 | 0.97mi |
| 130 Lake Pointe Ct Unit 130 Brookhaven, NY | 2.0 | 1.0 | 740 | $2,435 | $3.29 | 45d | 1 | 1.10mi |
| 64 Daniel Dr Middle Island, NY | 2.0 | 2.0 | 1217 | $3,725 | $3.06 | 0d | 19 | 1.13mi |
| 356 Lake Pointe Dr Unit 356 Middle Island, NY | 2.0 | 1.0 | 740 | $2,435 | $3.29 | 46d | 1 | 1.17mi |
| 388 Lake Pointe Dr Unit 388 Middle Island, NY | 2.0 | 1.5 | 785 | $2,650 | $3.38 | 45d | 1 | 1.18mi |
| 394 Lake Pointe Dr Unit 394 Middle Island, NY | 2.0 | 1.5 | 785 | $2,650 | $3.38 | 26d | 1 | 1.19mi |
| 444 Lake Pointe Dr Unit 444 Middle Island, NY | 2.0 | 1.0 | 740 | $2,435 | $3.29 | 45d | 1 | 1.21mi |
| 462 Lake Pointe Dr Unit 462 Middle Island, NY | 2.0 | 1.0 | 740 | $2,435 | $3.29 | 45d | 1 | 1.22mi |
| 285 Artist Lake Dr Middle Island, NY | 1.0 | 1.0 | 836 | $1,975 | $2.36 | 45d | 1 | 1.23mi |
| 9 Fairview Cir Unit 2 Middle Island, NY | 2.0 | 1.5 | 947 | $2,500 | $2.64 | 45d | 1 | 1.25mi |
| 9 Fairview Cir Middle Island, NY | 2.0 | 1.5 | 947 | $2,400 | $2.53 | 26d | 1 | 1.25mi |
| 238 Artist Lake Dr Middle Island, NY | 1.0 | 1.0 | 800 | $2,450 | $3.06 | 26d | 1 | 1.25mi |
| 229 Artist Lake Dr Middle Island, NY | 1.0 | 1.0 | 850 | $2,075 | $2.44 | 5d | 1 | 1.26mi |
| 3 Saratoga Ct Unit B Ridge, NY | 2.0 | 1.0 | 880 | $2,800 | $3.18 | 45d | 1 | 1.43mi |
| 825 Spring Lake Dr Middle Island, NY | 2.0 | 2.0 | 1440 | $2,995 | $2.08 | 45d | 1 | 1.47mi |
| 100 Village Dr Ridge, NY | 1.0–2.0 | 1.0 | 733 | $2,708 | $3.69 | 0d | 7 | 1.48mi |
HOA detail
- Monthly dues
- $395 · $4,740/yr
- Likely covers
- landscapingsnow removalpool
Listing history 9 events
-
2026-06-02statusdays on market $269,000 Pending 34 DOM
-
2026-05-14price $269,000
-
2026-04-21status Active
-
2026-04-15status Active
-
2026-04-03$310,000 Active
-
2018-05-11historical
-
2018-03-26$110,000 New
-
1987-06-15soldstatus $113,000
-
1985-12-11soldstatus $85,000
ⓘ Source: listings_history table (triggers on properties + properties_extension) + one-shot
backfill from property_details.listing_events for pre-trigger history.
Tax reassessment forecast NY · Partial reset (capped growth)
- Current annual tax
- $6,094 · $508/mo
- Projected year-2 tax
- $6,094 · $508/mo
- Expected delta
- $0/yr ($0/mo · 0.0%)
ⓘ Screening estimate from a state-policy table — verify with the county assessor before closing.
Climate risk First Street
- Flood 1/10 Low FEMA zone X (unshaded) · 0% chance over 30 yrs
- Wildfire 5/10 Major
- Heat 5/10 Major 7 d/yr ≥93°F today · 19 d/yr by 30 yrs out
- Wind 8/10 Severe 80% chance of damaging wind over 30 yrs
- Air quality 4/10 Moderate 3 unhealthy d/yr today · 5 by 30 yrs out
Nearby sold comps map
Loading sold comps map…
Walkable amenities ~0.75 mi
Loading nearby amenities…
Taxation est. · year 1
- Rental income
- $32,424
- − Mortgage interest
- −$15,068
- − Property taxes
- −$6,094
- − Insurance
- −$1,345
- − Repairs & maintenance
- −$2,594
- − Management
- −$2,594
- − HOA
- −$4,740
- − Depreciation
- −$7,825
- Taxable loss
- −$7,837
- Est. tax savings @ 24.0%
- +$1,881
- After-tax cash flow
- $-1,612/yr
For passive investors: Depreciation is non-cash, so a rental often shows a tax loss while cash-flowing — sheltering income. Rental losses are passive: they offset passive income freely, and up to $25,000/yr can offset ordinary (W-2) income if you actively participate and your MAGI is under $100k (phasing out to $0 by $150k); unused losses carry forward. On sale, claimed depreciation is recaptured at up to 25%, and gains may owe capital-gains tax (a 1031 exchange can defer both). Figures are a year-1 estimate at your 24.0% rate — not tax advice; consult a CPA.
Schools (NCES district)
- District
- Longwood Central School District
- NCES district ID
- 3619230
- Math proficiency
- 61% ▬ 0.00%
- Reading proficiency
- 55% ▼ -1.00%
- Median HH income
- $72,748
- Composite
- 51.63/100
- National rank
- #1703
- State rank
- #235 of 590 in NY
Livability — Middle Island
- Score
- 65/100
- State rank
- #703
- US rank
- #13264
Category grades
Schools grade is shown separately in the Schools card above.
Census & demographics
- Census place
- Middle Island, NY
- City population
- 13,383
- Population (ZIP)
- 13,383
Population outlook (Suffolk County) Hauer SSP2
- Today (2025)
- 1,505,262 people
- By 2030
- 1,498,318 · -0.5%
- By 2040
- 1,471,101 · -2.3%
- By 2050
- 1,424,848 · -5.3%
- By 2075
- 1,337,157 · -11.2%
- By 2100
- 1,217,720 · -19.1%
Race, ethnicity, and origin ACS 2023
- Neighborhood character
- Majority White (65%)
- Race & ethnicity
- White 65% Hispanic / Latino 16% Black 15% Two or more races 7%
- Hispanic origin (detail)
- Mexican 2% Puerto Rican 6% Dominican 3%
- Common ancestry
- Romanian 4% Hispanic 2% Scotch-Irish 1%
- Foreign-born
- 12% · Canada, Jamaica, China
- Languages at home
- 87% English-only · Spanish 7% Russian/Polish/Slavic 2% French/Haitian/Cajun 2%
Political lean MEDSL · Suffolk
- 2024 margin
- Lean R (+10.0) · D 45.0% · R 55.0%
- 2008→2024 swing
- -16.0pp toward R · 2008: 6.0pp · 2024: -10.0pp
- All cycles
- 2024: R+10.0 2020: R+0.0 2016: R+8.2 2012: D+2.9 2008: D+6.0
Not yet ingested
- Civics
- —
Market trends
- HPI YoY
- ▼ -90.61%
- Current HPI
- 358.0686
- Rent YoY
- —
- Metro
- —
- State GDP YoY
- ▲ 2.60%
- F500 in state
- 92
Industry mix (Fortune 500 HQ in NY)
| Industry | F500 HQs | Revenue |
|---|---|---|
| Financial Services | 10 | $950B |
|
||
| Consumer Goods | 9 | $162B |
|
||
| Insurance | 4 | $225B |
|
||
| Telecommunications | 2 | $144B |
|
||
| Pharmaceuticals | 2 | $112B |
|
||
| Media / Entertainment | 2 | $69B |
|
||
Price history
+216.5% since first listed8 events — show timeline
- 2026-05-14 Price Changed $269,000 OneKey® MLS as Distributed by MLS Grid
- 2026-04-21 Relisted — OneKey® MLS as Distributed by MLS Grid
- 2026-04-15 Relisted — OneKey® MLS as Distributed by MLS Grid
- 2026-04-03 Listed $310,000 OneKey® MLS as Distributed by MLS Grid
- 2018-05-11 Listing Removed — OneKey® MLS as Distributed by MLS Grid
- 2018-03-26 Listed $110,000 OneKey® MLS as Distributed by MLS Grid
- 1987-06-15 Sold (Public Records) $113,000 Public Records
- 1985-12-11 Sold (Public Records) $85,000 Public Records
Property tax history
+3.3%/yrLatest (2025): $6,094 · +0.0% YoY. Source: county tax records.
Cash-flow waterfall
monthlySold comps — $/sqft
last 12 mo · ≤1 miLoading sold comps…