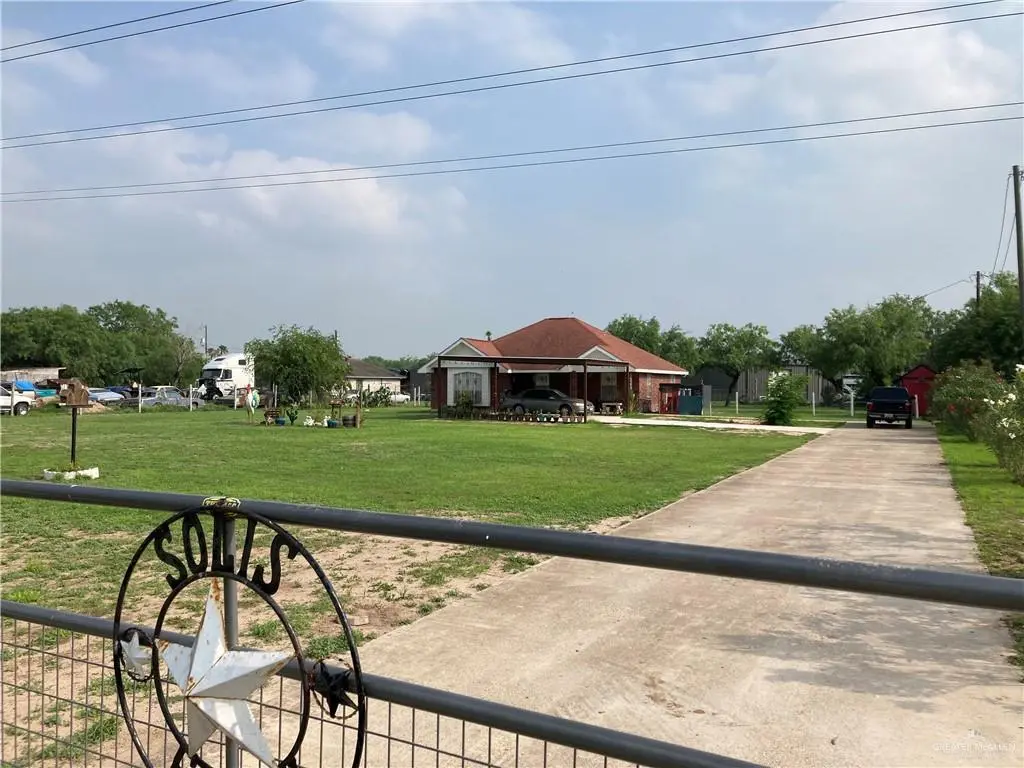
2318 E Mile 19 Rd N · Edinburg, TX
Flood risk 3/10 · Minor
- FEMA flood zone
- X
- Chance of flooding over 30 yrs
- 0.18%
- Est. flood insurance / yr
- $507 – $1,088
Fire risk 8/10 · Major
- Est. fire insurance / yr
- $1,222 – $2,270
Heat risk 9/10 · Severe
- Hot days now (above 111°F)
- 7 days/yr
- Hot days in 30 yrs
- 23 days/yr
Wind risk 9/10 · Severe
- Chance of severe wind over 30 yrs
- 99.0%
Air-quality risk 1/10 · Minimal
- Unhealthy air days now
- 0 days/yr
- Unhealthy air days in 30 yrs
- 0 days/yr
Risk factors via First Street. Map © Google.
Why this score? — see what drove the D- grade
The composite is a weighted blend of 9 inputs, each scored 0–100. Each bar is that input's sub-score; the figure is the points it added to the 100-point composite (weight × sub-score).
- ARV discount +12.6/15.0
- Cash flow +10.5/30.0
- 1% rule +3.2/10.0
- Livability +3.2/5.0
- DSCR +3.0/10.0
- Condition / age +2.5/5.0
- Rent growth +2.2/5.0
- Schools +2.2/10.0
- Appreciation +0.0/10.0
$205,000
🖨 Deal sheet 📄 Offer letter ✓ Due diligence
Listing remarks
Country living in North Edinburg!! Check out this great 3-bedroom, 2-bath brick home with 1,360 sq ft of living space, situated on an oversized lot (. 90-acre). This well-maintained property is set back from the road for privacy, and features complete perimeter fencing, an extended paved driveway, two large storage buildings with electricity, newly added carport, additional paved parking, kennel, chicken coop and professional landscaping. With nearly an acre of land, this property offers incredible potential, with plenty of room to expand and add improvements. Conveniently located just off Interstate 69C North (Expressway 281), this lovely property offers peaceful country living with quick
Key facts
- Newly added carport
- Oversized lot
- 0.9 acre lot
Tags
Property features AI
Finance
- HOA & community: No association
Exterior
- Parking: Detached covered parking for 2 vehicles; Carport for 2 vehicles; Total of 2 parking spaces listed
- Security: Security system; Smoke detectors
- Utilities: Septic tank; Electric service
- Home design: Not new construction
- Construction: Brick construction; Composition shingle roof; Slab foundation; Built area approximately 1,360 square feet
- Exterior features: Manual gate; Workshop; Storage structure; Mature trees; Paved road access
Interior
- Kitchen: Electric smooth top range; Microwave
- Bedrooms: Master bedroom with walk-in closet
- Flooring: Other
- Bathrooms: 2 full bathrooms
- Heating & cooling: Central heating (electric); Central air conditioning (electric)
- Interior features: Ceiling fans; Microwave included; Countertops (other); Drapes on windows
- Laundry & utility: Laundry closet with washer/dryer connections; Electric water heater (location: other)
Neighborhood map
What this means for you Summary
Snapshot
- This is a 3-bed/2.0-bath single-family listed at $205k.
Deal economics
- At list price, monthly cash flow is $-104 ($-1k/yr) — negative.
- To cash-flow at today's rent, offer at most $187k (9.0% below list).
- To meet the 1% rule (rent ≥ 1% of price), the offer needs to be $168k (17.9% below list).
- Recommended offer: $168k (17.9% below list) — sets the bar for 1% rule.
- Cap rate 5.7% vs local median 2.4% in Edinburg — top-decile yield for the area; either an underpriced asset or a hidden risk that comps aren't pricing in. Stress-test before assuming the spread holds.
Location & tenants
- Location reads 64/100 on livability (#784 in TX) — a middle-class / working-renter tenant base. Strengths: cost of living A+, housing A+; Watch: employment D, amenities F, commute F.
- Edinburg CISD (urban): math 20% / reading 34% proficiency, ranked #699 of 826 in TX (top 85%) — low school quality limits family demand, transient renter base, plan for 1-2y turnover; 62% free/reduced lunch — lower-income household profile, screen leases tightly.
- Zoned schools: Dr Kay Teer Crawford El (math 27% / reading 37%, grade F, #2,268 of 4,322 statewide, top 55%, 652 students, 91% FRL); Betty Harwell Middle (math 11% / reading 26%, grade F, #1,478 of 1,662 statewide, top 90%, 1,453 students, 96% FRL); Economedes H S (math 19% / reading 24%, grade F, #1,377 of 1,632 statewide, top 85%, 2,762 students, 92% FRL) — zoned schools average 93% FRL vs 62% district-wide (31 pts higher); higher-poverty schools than district average — tighter screening recommended.
- Market conditions: Rents soft (-1.1%/yr); 1003 active listings in the ZIP; 3 comparable units currently listed for rent nearby; rentals at typical pace (median 14d on market — plan ~3-4 weeks tenant-placement turnaround); 7,378 units permitted in Hidalgo County in 2024 (641 in 5+ unit buildings).
- This rent runs 37% of the median local income ($55k/yr) — at the standard rent-burdened threshold; future hikes will face affordability resistance.
Forward outlook
- Local home prices are declining (-3.0%/yr); year-one equity from $1k of loan paydown is wiped out by about $6k of value loss. Plan a longer hold.
- Hidalgo County population projected at +28% by 2050 — long-run rental-demand tailwind backs the buy-and-hold thesis.
Negotiation context
- It's been on market 21 days — a 2% lower offer ($202k) is reasonable based on typical stale-listing flexibility.
- 2 sale attempts with the ask held roughly flat each time — persistent listings suggest the price (not the market) is what's stuck; bring a comps-based counter.
Risks & watch-outs
- Climate carrying-cost: severe wind risk, 99% chance of damaging wind over 30y; severe wildfire risk; extreme-heat days projected 7→23/yr by 2055 (HVAC capex compounding) — expect insurance premiums to compound above CPI over the hold.
Questions for the listing agent
- What do current leases actually rent for vs. the listed asking? Can we see a recent rent roll and the last 12 months of T-12 income?
- Is there a deadline driving the sale (1031 exchange, divorce, estate, relocation)? That informs how much negotiation room exists.
- Schools are D-rated, which usually means shorter tenancies and higher turnover. Who's the typical renter profile here, and what's been the actual vacancy rate?
- The area grade is low — what's the realistic commute time and amenity access for the typical tenant pool here? Any planned neighborhood developments (good or bad) we should know about?
- What's the average days-on-market for RENTAL listings here right now (not sales)? A rising rental-DOM trend means longer vacancies and softer asking-rent achievability than the comps imply.
- What's the recent tenant-quality profile in this submarket — average credit score on applications, eviction rate, late-payment / NSF rate, and stable-employment percentage? A property-management company in the area should have these aggregated.
- How much new for-sale + rental construction is in the pipeline within 1–3 miles? Heavy new supply typically softens prices + rents 12–24 months out; constrained supply supports both.
Investment metrics
- 1% rule
- 0.82% ✗
- Cap rate
- 5.68%
- Cash-on-cash
- -2.18%
- DSCR
- 0.90
- GRM
- 10.1
CMA / ARV
- ARV (median comp)
- $231,179
- List price
- $205,000
- Delta
- -11.32%
- Verdict
- UNDERPRICED
- Comps
- 20 within 1.0 mi
Show comp detail 9 sales within ~0.75 mi
| Address | Dist | Beds/Ba | Sqft | Sold | Price | $/sf | Match |
|---|---|---|---|---|---|---|---|
| 2610 Yosemite St | 0.38mi | 3/2.0 | 1,411 (+4%) | 3mo | $225,000 | $159 | 73 |
| 2611 Pfeiffer St | 0.37mi | 3/2.0 | 1,427 (+5%) | 4mo | $230,000 | $161 | 72 |
| 2705 Yosemite St | 0.42mi | 3/2.0 | 1,505 (+11%) | 0mo | $259,877 | $173 | 62 |
| 2604 Tassajara St | 0.46mi | 3/2.0 | 1,421 (+4%) | 16mo | $244,900 | $172 | 58 |
| 3224 Saturn St | 0.71mi | 3/2.0 | 1,432 (+5%) | 2mo | $179,000 | $125 | 56 |
| 2702 Asilomar St | 0.57mi | 3/2.0 | 1,214 (-11%) | 2mo | $194,500 | $160 | 54 |
| 4914 Mission St | 0.48mi | 3/2.0 | 1,535 (+13%) | 4mo | $235,000 | $153 | 53 |
| 3204 Barbara Ln | 0.60mi | 4/2.0 (+1) | 1,484 (+9%) | 1mo | $150,000 | $101 | 51 |
| 2823 Josephine Rd | 0.66mi | 3/2.0 | 1,440 (+6%) | 10mo | $128,000 | $89 | 51 |
Match score weights: distance 35% · size 25% · config 20% · recency 20%. Top-matched comps best support the ARV.
Projected returns pro-forma
-3.0% appreciation · 0.0% rent growth · sell at horizon
- IRR
- -23.4%
- Equity multiple
- 0.22×
- Total profit
- $-44,766
- Equity at exit
- $30,566
- IRR
- -29.2%
- Equity multiple
- -0.16×
- Total profit
- $-66,461
- Equity at exit
- $17,725
Cash invested: $57,400 (down + closing). Projections, not guarantees.
Landlord ↔ Tenant lean methodology
- Overall (STATE)
- 87 Strongly Landlord-Friendly
- State Texas
- 87 Strongly Landlord-Friendly · R+5
- County
- — inherits STATE
- City
- — inherits STATE
ZIP-level market 78542
- Home prices YoY
- -13.4%
- Rents YoY
- -1.1%
- Active inventory
- 1003
- Price-to-rent
- 10.1×
Monthly cashflow live
- Estimated rent
- $1,683 medium interval (Pro) →
- Mortgage (P&I)
- −$1,075
- Tax from tax record
- −$274 /mo · $3,284/yr
- Insurance
- −$85
- HOA
- −$0
- Vacancy / Maint / Mgmt
- −$353
- Net cashflow
- $-104
Break-even live
UW: 25.0% down · 7.5% · 30yr · 1.5% tax · 5.0% vac · 8.0% maint · 8.0% mgmt
Financing live
Cash to close
- Down payment
- $51,250
- Closing costs
- $6,150
- Reserves months
- —
- Total cash needed
- —
Loan-product check · same deal, 3 products live
Conventional
25% down · 7.5% · 30yr
- Down + closing
- —
- Monthly P&I
- —
- Monthly cashflow
- —
- DSCR
- —
- Eligible?
- —
Personal DTI + credit; lowest rate.
DSCR
20% down · 8.5% · 30yr
- Down + closing
- —
- Monthly P&I
- —
- Monthly cashflow
- —
- DSCR
- —
- Eligible?
- —
No personal income docs; deal must DSCR.
Hard money
10% down · 12.0% · 12mo
- Down + closing
- —
- Monthly P&I
- —
- Monthly cashflow
- —
- DSCR
- —
- Eligible?
- —
Short-term bridge; refi at stabilization.
Rent comps 3 comps
| Address | Beds | Baths | Sqft | Rent | $/sqft | DOM | Units | Dist |
|---|---|---|---|---|---|---|---|---|
| 3800 La Sienna Pkwy Edinburg, TX | 1.0–3.0 | 1.0–2.0 | 966 | $1,685 | $1.74 | 14d | 1 | 0.85mi |
| 3521 N Christopher Ln Edinburg, TX | 3.0 | 2.0 | 1398 | $1,600 | $1.14 | 14d | 1 | 0.98mi |
| 6112 N Pedaso del Sol St Edinburg, TX | 3.0 | 2.0 | 1610 | $2,250 | $1.40 | 43d | 1 | 1.25mi |
Listing history 4 events
-
2026-05-31statusdays on market $205,000 Pending 21 DOM
-
2026-05-18historical Option 745-char remark
-
2026-05-08$205,000 Active 745-char remark
-
2000-11-02soldstatus
ⓘ Source: listings_history table (triggers on properties + properties_extension) + one-shot
backfill from property_details.listing_events for pre-trigger history.
Tax reassessment forecast TX · Resets to sale price
- Current annual tax
- $3,284 · $274/mo
- Projected year-2 tax
- $3,752 · $313/mo
- Expected delta
- +$467/yr (+$39/mo · 14.2%)
ⓘ Screening estimate from a state-policy table — verify with the county assessor before closing.
Climate risk First Street
- Flood 3/10 Moderate FEMA zone X · 18% chance over 30 yrs
- Wildfire 8/10 Severe
- Heat 9/10 Extreme 7 d/yr ≥111°F today · 23 d/yr by 30 yrs out
- Wind 9/10 Extreme 99% chance of damaging wind over 30 yrs
- Air quality 1/10 Low 0 unhealthy d/yr today · 0 by 30 yrs out
Nearby sold comps map
Loading sold comps map…
Walkable amenities ~0.75 mi
Loading nearby amenities…
Taxation est. · year 1
- Rental income
- $20,199
- − Mortgage interest
- −$11,483
- − Property taxes
- −$3,284
- − Insurance
- −$1,025
- − Repairs & maintenance
- −$1,616
- − Management
- −$1,616
- − Depreciation
- −$5,964
- Taxable loss
- −$4,789
- Est. tax savings @ 24.0%
- +$1,149
- After-tax cash flow
- $-104/yr
For passive investors: Depreciation is non-cash, so a rental often shows a tax loss while cash-flowing — sheltering income. Rental losses are passive: they offset passive income freely, and up to $25,000/yr can offset ordinary (W-2) income if you actively participate and your MAGI is under $100k (phasing out to $0 by $150k); unused losses carry forward. On sale, claimed depreciation is recaptured at up to 25%, and gains may owe capital-gains tax (a 1031 exchange can defer both). Figures are a year-1 estimate at your 24.0% rate — not tax advice; consult a CPA.
Schools (NCES district)
- District
- Edinburg CISD
- NCES district ID
- 4818180
- Math proficiency
- 20% ▼ -34.00%
- Reading proficiency
- 34% ▼ -11.00%
- Median HH income
- $36,985
- Composite
- 22.42/100
- National rank
- #8114
- State rank
- #699 of 826 in TX
Livability — Edinburg
- Score
- 64/100
- State rank
- #784
- US rank
- #14319
Category grades
Schools grade is shown separately in the Schools card above.
Census & demographics
- Census place
- Edinburg, TX
- County
- Hidalgo County · 623,128 people
- City population
- 178,279
- Metro
- McAllen-Edinburg-Mission, TX
- Population (ZIP)
- 89,401
- Household income
- $55,243
- Rent vs Own
- Severe rent burden
- 1240.0
Population outlook (Hidalgo County) Hauer SSP2
- Today (2025)
- 955,232 people
- By 2030
- 1,009,774 · +5.7%
- By 2040
- 1,120,332 · +17.3%
- By 2050
- 1,225,036 · +28.2%
- By 2075
- 1,439,189 · +50.7%
- By 2100
- 1,533,429 · +60.5%
Race, ethnicity, and origin ACS 2023
- Neighborhood character
- Predominantly Hispanic (95%)
- Race & ethnicity
- Hispanic / Latino 95% Two or more races 59% White 4%
- Hispanic origin (detail)
- Mexican 91%
- Foreign-born
- 25% · Canada
- Languages at home
- 15% English-only · Spanish 84%
Political lean MEDSL · Hidalgo
- 2024 margin
- Toss-up / Even · D 48.1% · R 51.0%
- 2008→2024 swing
- -41.6pp toward R · 2008: 38.7pp · 2024: -2.9pp
- All cycles
- 2024: R+2.9 2020: D+17.1 2016: D+40.5 2012: D+41.8 2008: D+38.7
Not yet ingested
- Civics
- —
Market trends
- HPI YoY
- ▼ -34.17%
- Current HPI
- 220.921
- Rent YoY
- ▼ -1.07%
- Metro
- McAllen-Edinburg-Mission, TX
- State GDP YoY
- ▲ 3.95%
- F500 in state
- 110
Industry mix (Fortune 500 HQ in TX)
| Industry | F500 HQs | Revenue |
|---|---|---|
| Energy | 16 | $1,198B |
|
||
| Technology | 5 | $198B |
|
||
| Engineering / Construction | 4 | $72B |
|
||
| Energy Services | 3 | $60B |
|
||
| Utilities | 3 | $41B |
|
||
| Healthcare | 2 | $330B |
|
||
Price history
5 events — show timeline
- 2026-05-30 Pending — MCALLENMLS
- 2026-05-25 Relisted — MCALLENMLS
- 2026-05-18 Contingent — MCALLENMLS
- 2026-05-08 Listed $205,000 MCALLENMLS
- 2000-11-02 Sold (Public Records) — Public Records
Property tax history
+3.3%/yrLatest (2025): $3,284 · +9.5% YoY. Source: county tax records.
Cash-flow waterfall
monthlySold comps — $/sqft
last 12 mo · ≤1 miLoading sold comps…