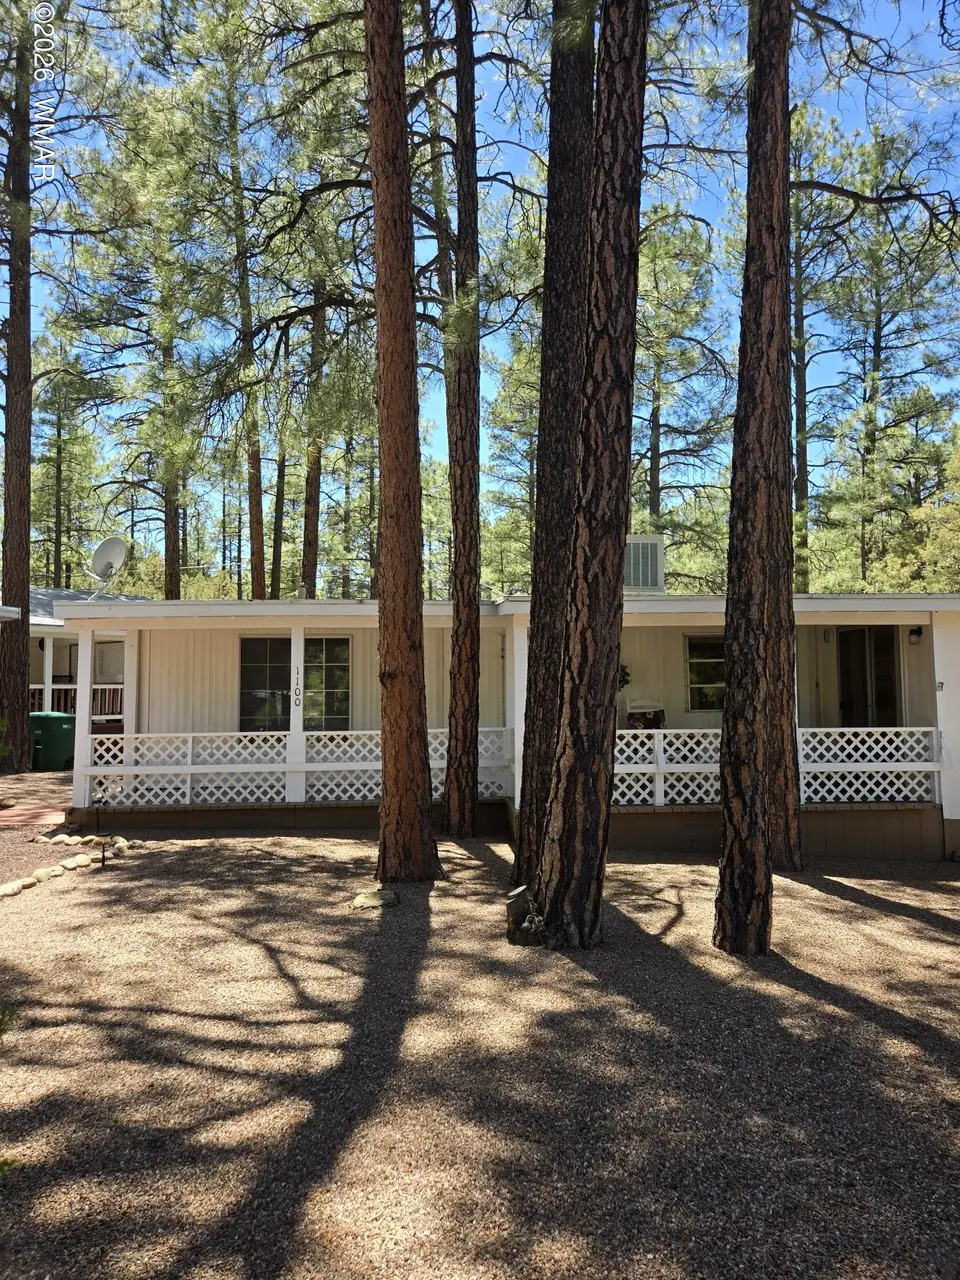
1100 N 43Rd Loop · Show Low, AZ
Flood risk 1/10 · Minimal
- FEMA flood zone
- X (unshaded)
- Chance of flooding over 30 yrs
- 0.0%
- Est. flood insurance / yr
- $507 – $1,088
Fire risk 6/10 · Moderate
- Est. fire insurance / yr
- $610 – $1,132
Heat risk 2/10 · Minimal
- Hot days now (above 89°F)
- 7 days/yr
- Hot days in 30 yrs
- 18 days/yr
Wind risk 1/10 · Minimal
- Chance of severe wind over 30 yrs
- —
Air-quality risk 2/10 · Minimal
- Unhealthy air days now
- 1 days/yr
- Unhealthy air days in 30 yrs
- 1 days/yr
Risk factors via First Street. Map © Google.
Why this score? — see what drove the B- grade
The composite is a weighted blend of 9 inputs, each scored 0–100. Each bar is that input's sub-score; the figure is the points it added to the 100-point composite (weight × sub-score).
- Cash flow +30.0/30.0
- DSCR +10.0/10.0
- 1% rule +9.0/10.0
- ARV discount +7.5/15.0
- Livability +3.2/5.0
- Schools +3.0/10.0
- Rent growth +2.5/5.0
- Condition / age +2.5/5.0
- Appreciation +0.0/10.0
$94,900
🖨 Deal sheet (PDF) 📄 Offer letter ✓ Due diligence
Listing remarks
Great location in the trees and close to everything Show Low. This clean well maintained home is the perfect get away retreat or your perfect full time residence. This home comes furnished. No HOA, NO leased land. The exterior has a nice large covered deck and a large lot.
Key facts
- Large lot
- Large covered deck
- 6,098 sq ft lot
Tags
Property features AI
Finance
- Other: Located in Fairway Park subdivision; Road maintenance by city; Lot about 0.14 acres; Not on leased land
- HOA & community: No HOA
Exterior
- Parking: Detached carport (2 spaces)
- Utilities: City water (City of Show Low); Public sewer; Electric with individual meter; Natural gas available; Navopache service available; Power available
- Home design: Manufactured home (single wide); One level; Private adjoining property
- Construction: Flat roof; Other foundation
- Exterior features: Property has trees (tall pines); Chain link fence; Utility building; Covered deck
Interior
- Kitchen: Disposal; Gas range; Microwave; Pantry; Refrigerator; Eat-in kitchen
- Flooring: Carpet; Vinyl
- Bathrooms: Tub/shower combination
- Heating & cooling: Forced air heating (natural gas); Evaporative cooling; Gas water heater
- Interior features: Smoke detector; No fireplace
Neighborhood map
What this means for you Summary
Snapshot
- This is a 1-bed/1.0-bath manufactured listed at $95k.
Deal economics
- At list price, monthly cash flow is $483 ($6k/yr) — positive.
- The deal already cash-flows at list — no discount required.
- Meets the 1% rule at list price ($1k rent vs $95k).
- Cap rate 12.4% vs local median 3.3% in Show Low — top-decile yield for the area; either an underpriced asset or a hidden risk that comps aren't pricing in. Stress-test before assuming the spread holds.
Location & tenants
- Location reads 65/100 on livability (#90 in AZ) — a middle-class / working-renter tenant base. Strengths: cost of living A+, housing A+; Watch: employment D, crime F, amenities F.
- Show Low Unified District (4393) (rural): math 32% / reading 39% proficiency, ranked #89 of 249 in AZ (top 36%) — families likely to look elsewhere, expect single-tenant / working-renter base with shorter leases.
- Market conditions: 891 active listings in the ZIP; 485 units permitted in Navajo County in 2024 (11 in 5+ unit buildings).
Forward outlook
- Local home prices are declining (-3.0%/yr); year-one equity from $656 of loan paydown is wiped out by about $3k of value loss. Plan a longer hold.
- Navajo County population projected at -16% by 2050 — secular population decline; favor cash flow + early exit over multi-decade hold.
- At projected returns (-3.0% appreciation + 3.0% rent growth), your $27k cash investment doubles in ~6 years — after that, you're playing with house money.
Negotiation context
- Only 2 days on market — expect competitive offers; lowballing is unlikely to land.
- Current owner paid $26k; list at $95k implies a 258% gain — meaningful room to come down on a strong offer.
Risks & watch-outs
- Climate carrying-cost: major wildfire risk — expect insurance premiums to compound above CPI over the hold.
Questions for the listing agent
- Built in 1965 — when were the roof, HVAC, electrical panel, plumbing, and water heater last replaced?
- Is there a deadline driving the sale (1031 exchange, divorce, estate, relocation)? That informs how much negotiation room exists.
- Schools are B-rated — typically a magnet for longer-tenancy family renters. What's the average tenant stay here, and is there a school-zone premium baked into asking?
- Crime grade is F in this area — have there been break-ins, vandalism, or insurance claims at this property in the last 3 years? What carrier currently insures it and at what premium?
- What's the average days-on-market for RENTAL listings here right now (not sales)? A rising rental-DOM trend means longer vacancies and softer asking-rent achievability than the comps imply.
- What's the recent tenant-quality profile in this submarket — average credit score on applications, eviction rate, late-payment / NSF rate, and stable-employment percentage? A property-management company in the area should have these aggregated.
- How much new for-sale + rental construction is in the pipeline within 1–3 miles? Heavy new supply typically softens prices + rents 12–24 months out; constrained supply supports both.
Investment metrics
- 1% rule
- 1.40% ✓
- Cap rate
- 12.39%
- Cash-on-cash
- 21.79%
- DSCR
- 1.97
- GRM
- 6.0
CMA / ARV
No comps found within radius.
Projected returns pro-forma
-3.0% appreciation · 3.0% rent growth · sell at horizon
- IRR
- 14.4%
- Equity multiple
- 1.58×
- Total profit
- $15,318
- Equity at exit
- $14,150
- IRR
- 23.1%
- Equity multiple
- 2.99×
- Total profit
- $52,768
- Equity at exit
- $8,205
Cash invested: $26,572 (down + closing). Projections, not guarantees.
Landlord ↔ Tenant lean methodology
- Overall (STATE)
- 87 Strongly Landlord-Friendly
- State Arizona
- 87 Strongly Landlord-Friendly · R+3
- County
- — inherits STATE
- City
- — inherits STATE
ZIP-level market 85901
- Home prices YoY
- -14.5%
- Active inventory
- 891
- Price-to-rent
- 6.0×
Monthly cashflow live
- Estimated rent
- $1,327 medium interval (Pro) →
- Mortgage (P&I)
- −$498
- Tax from tax record
- −$29 /mo · $347/yr
- Insurance
- −$40
- HOA
- −$0
- Vacancy / Maint / Mgmt
- −$279
- Net cashflow
- $483
Break-even live
Sensitivity live
| Price | -10% $536 | -5% $509 | +0% $483 | +5% $456 | +10% $429 |
|---|---|---|---|---|---|
| Rent | -10% $378 | -5% $430 | +0% $483 | +5% $535 | +10% $587 |
| Rate | -1.0pp $530 | -0.5pp $507 | base $483 | +0.5pp $458 | +1.0pp $433 |
UW: 25.0% down · 7.5% · 30yr · 1.5% tax · 5.0% vac · 8.0% maint · 8.0% mgmt
Financing live
Cash to close
- Down payment
- $23,725
- Closing costs
- $2,847
- Reserves months
- —
- Total cash needed
- —
Loan-product check · same deal, 3 products live
Conventional
25% down · 7.5% · 30yr
- Down + closing
- —
- Monthly P&I
- —
- Monthly cashflow
- —
- DSCR
- —
- Eligible?
- —
Personal DTI + credit; lowest rate.
DSCR
20% down · 8.5% · 30yr
- Down + closing
- —
- Monthly P&I
- —
- Monthly cashflow
- —
- DSCR
- —
- Eligible?
- —
No personal income docs; deal must DSCR.
Hard money
10% down · 12.0% · 12mo
- Down + closing
- —
- Monthly P&I
- —
- Monthly cashflow
- —
- DSCR
- —
- Eligible?
- —
Short-term bridge; refi at stabilization.
Listing history 3 events
-
2026-06-13status $94,900 Pending 2 DOM
-
2026-06-12remarks 273-char remark
-
2026-06-12$94,900 Active 2 DOM
ⓘ Source: listings_history table (triggers on properties + properties_extension) + one-shot
backfill from property_details.listing_events for pre-trigger history.
Tax reassessment forecast AZ · Resets to sale price
- Current annual tax
- $347 · $29/mo
- Projected year-2 tax
- $626 · $52/mo
- Expected delta
- +$280/yr (+$23/mo · 80.6%)
ⓘ Screening estimate from a state-policy table — verify with the county assessor before closing.
Climate risk First Street
- Flood 1/10 Low FEMA zone X (unshaded) · 0% chance over 30 yrs
- Wildfire 6/10 Major
- Heat 2/10 Low 7 d/yr ≥89°F today · 18 d/yr by 30 yrs out
- Wind 1/10 Low
- Air quality 2/10 Low 1 unhealthy d/yr today · 1 by 30 yrs out
Nearby sold comps map
Loading sold comps map…
Walkable amenities ~0.75 mi
Loading nearby amenities…
Taxation est. · year 1
- Rental income
- $15,928
- − Mortgage interest
- −$5,316
- − Property taxes
- −$347
- − Insurance
- −$474
- − Repairs & maintenance
- −$1,274
- − Management
- −$1,274
- − Depreciation
- −$2,761
- Taxable income
- $4,482
- Est. tax owed @ 24.0%
- −$1,076
- After-tax cash flow
- $4,714/yr
For passive investors: Depreciation is non-cash, so a rental often shows a tax loss while cash-flowing — sheltering income. Rental losses are passive: they offset passive income freely, and up to $25,000/yr can offset ordinary (W-2) income if you actively participate and your MAGI is under $100k (phasing out to $0 by $150k); unused losses carry forward. On sale, claimed depreciation is recaptured at up to 25%, and gains may owe capital-gains tax (a 1031 exchange can defer both). Figures are a year-1 estimate at your 24.0% rate — not tax advice; consult a CPA.
Schools (NCES district)
- District
- Show Low Unified District (4393)
- NCES district ID
- 0407700
- Math proficiency
- 32% ▼ -9.00%
- Reading proficiency
- 39% ▼ -4.00%
- Median HH income
- $41,240
- Composite
- 29.9/100
- National rank
- #6387
- State rank
- #89 of 249 in AZ
Livability — Show Low
- Score
- 65/100
- State rank
- #90
- US rank
- #13573
Category grades
Schools grade is shown separately in the Schools card above.
Census & demographics
- Census place
- Show Low, AZ
- City population
- 18,821
- Population (ZIP)
- 18,821
Population outlook (Navajo County) Hauer SSP2
- Today (2025)
- 105,760 people
- By 2030
- 103,301 · -2.3%
- By 2040
- 97,070 · -8.2%
- By 2050
- 88,850 · -16.0%
- By 2075
- 65,180 · -38.4%
- By 2100
- 37,281 · -64.7%
Race, ethnicity, and origin ACS 2023
- Neighborhood character
- Predominantly White (77%)
- Race & ethnicity
- White 77% Hispanic / Latino 16% Two or more races 11% Native American 2%
- Hispanic origin (detail)
- Mexican 12%
- Common ancestry
- Slovak 2% Lithuanian 2% Italian 2%
- Foreign-born
- 4% · Canada
- Languages at home
- 92% English-only · Spanish 7% Tagalog/Filipino 1%
Political lean MEDSL · Navajo
- 2024 margin
- R (+17.2) · D 40.9% · R 58.1%
- 2008→2024 swing
- -5.5pp toward R · 2008: -11.7pp · 2024: -17.2pp
- All cycles
- 2024: R+17.2 2020: R+8.2 2016: R+7.9 2012: R+8.4 2008: R+11.7
Not yet ingested
- Civics
- —
Market trends
- HPI YoY
- ▼ -65.52%
- Current HPI
- 386.3007
- Rent YoY
- —
- Metro
- —
- State GDP YoY
- ▲ 4.54%
- F500 in state
- 20
Industry mix (Fortune 500 HQ in AZ)
| Industry | F500 HQs | Revenue |
|---|---|---|
| Technology | 2 | $13B |
|
||
| Mining / Metals | 1 | $23B |
|
||
| Environmental Services | 1 | $16B |
|
||
| Metals / Steel | 1 | $14B |
|
||
| Technology Distribution | 1 | $9B |
|
||
| Homebuilding | 1 | $8B |
|
||
Price history
+362.9% since first listed4 events — show timeline
- 2026-06-12 Pending — WMMLS
- 2026-06-10 Listed $94,900 WMMLS
- 1994-08-04 Sold (Public Records) $26,500 Public Records
- 1991-07-01 Sold (Public Records) $20,500 Public Records
Property tax history
+2.1%/yrLatest (2025): $347 · +4.1% YoY. Source: county tax records.
Cash-flow waterfall
monthlySold comps — $/sqft
last 12 mo · ≤1 miLoading sold comps…