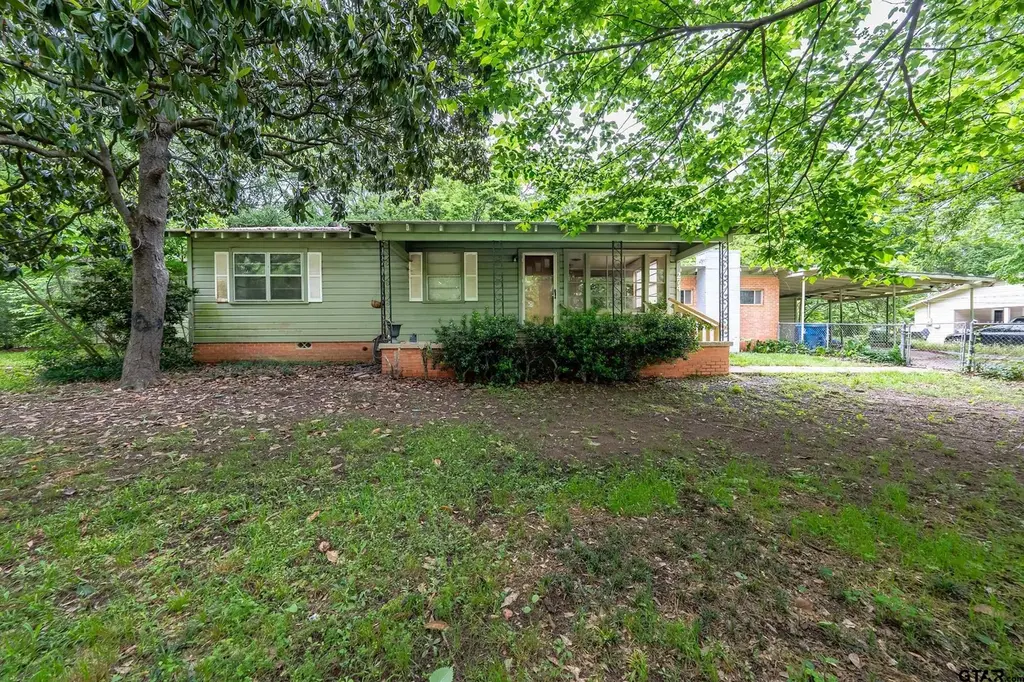
274 W Hill St · Rusk, TX
Flood risk 1/10 · Minimal
- FEMA flood zone
- X (unshaded)
- Chance of flooding over 30 yrs
- 0.0%
- Est. flood insurance / yr
- $507 – $1,088
Fire risk 4/10 · Minor
- Est. fire insurance / yr
- $1,222 – $2,270
Heat risk 7/10 · Major
- Hot days now (above 109°F)
- 7 days/yr
- Hot days in 30 yrs
- 25 days/yr
Wind risk 7/10 · Major
- Chance of severe wind over 30 yrs
- 78.0%
Air-quality risk 1/10 · Minimal
- Unhealthy air days now
- 0 days/yr
- Unhealthy air days in 30 yrs
- 0 days/yr
Risk factors via First Street. Map © Google.
Why this score? — see what drove the A grade
The composite is a weighted blend of 9 inputs, each scored 0–100. Each bar is that input's sub-score; the figure is the points it added to the 100-point composite (weight × sub-score).
- Cash flow +29.9/30.0
- ARV discount +15.0/15.0
- DSCR +10.0/10.0
- Appreciation +9.5/10.0
- 1% rule +8.6/10.0
- Schools +3.5/10.0
- Livability +3.5/5.0
- Rent growth +2.5/5.0
- Condition / age +2.5/5.0
$99,000
🖨 Deal sheet (PDF) 📄 Offer letter ✓ Due diligence
Listing remarks MLS
Investor special! Don't miss out on this great property in Rusk. 3 bed 2 bath, 1876 sq ft home on a corner lot. Bring all offers!
Key facts
- Custom playground
- Attached carport
- Large lot
Tags
Property features AI
Exterior
- Home design: Single-family detached residence; Single story
- Construction: Brick and wood siding construction
- Exterior features: Porch; Chain link fencing; Composition roof
Interior
- Kitchen: Gas oven; Gas range
- Bathrooms: 1 full bathroom
- Heating & cooling: Electric central heating; Central air; Ceiling fan(s)
- Interior features: Ceiling fan(s); Central air
Neighborhood map
What this means for you Summary
Snapshot
- This is a 3-bed/4.0-bath single-family listed at $99k.
Deal economics
- At list price, monthly cash flow is $366 ($4k/yr) — positive.
- The deal already cash-flows at list — no discount required.
- Meets the 1% rule at list price ($1k rent vs $99k).
- Recommended offer: $98k (1.5% below list) — sets the bar for market timing.
- Cap rate 10.7% vs local median 3.0% in Rusk — top-decile yield for the area; either an underpriced asset or a hidden risk that comps aren't pricing in. Stress-test before assuming the spread holds.
Location & tenants
- Location reads 69/100 on livability (#405 in TX) — a middle-class / working-renter tenant base. Strengths: crime A+, cost of living A+, housing A+; Watch: amenities F, commute F, employment D-.
- Rusk ISD (rural): math 40% / reading 43% proficiency, ranked #380 of 826 in TX (top 46%) — families likely to look elsewhere, expect single-tenant / working-renter base with shorter leases.
- Zoned schools: Rusk El (math 47% / reading 57%, grade C-, #742 of 4,322 statewide, top 19%, 288 students, 74% FRL); Rusk J H (math 40% / reading 41%, grade F, #637 of 1,662 statewide, top 39%, 478 students, 65% FRL); Rusk H S (math 42% / reading 47%, grade F, #652 of 1,632 statewide, top 43%, 610 students, 64% FRL).
- Market conditions: 124 active listings in the ZIP; 39 units permitted in Cherokee County in 2024 (0 in 5+ unit buildings).
Forward outlook
- In year one you build about $10k of equity ($684 loan paydown + $9k appreciation (9.1% local appreciation)).
- At projected returns (9.1% appreciation + 3.0% rent growth), your $28k cash investment doubles in ~2 years — after that, you're playing with house money.
- By year 4, paydown + projected appreciation supports a ~$34k cash-out refi (75% LTV) — recoverable capital for the next deal without selling this one.
Negotiation context
- It's been on market 19 days — a 2% lower offer ($98k) is reasonable based on typical stale-listing flexibility.
- 2 sale attempts since 6y ago with the ask held roughly flat each time — persistent listings suggest the price (not the market) is what's stuck; bring a comps-based counter.
Risks & watch-outs
- Climate carrying-cost: major wind risk, 78% chance of damaging wind over 30y; extreme-heat days projected 7→25/yr by 2055 (HVAC capex compounding) — expect insurance premiums to compound above CPI over the hold.
Questions for the listing agent
- Built in 1965 — when were the roof, HVAC, electrical panel, plumbing, and water heater last replaced?
- Is there a deadline driving the sale (1031 exchange, divorce, estate, relocation)? That informs how much negotiation room exists.
- Schools are F-rated, which usually means shorter tenancies and higher turnover. Who's the typical renter profile here, and what's been the actual vacancy rate?
- What's the average days-on-market for RENTAL listings here right now (not sales)? A rising rental-DOM trend means longer vacancies and softer asking-rent achievability than the comps imply.
- What's the recent tenant-quality profile in this submarket — average credit score on applications, eviction rate, late-payment / NSF rate, and stable-employment percentage? A property-management company in the area should have these aggregated.
- How much new for-sale + rental construction is in the pipeline within 1–3 miles? Heavy new supply typically softens prices + rents 12–24 months out; constrained supply supports both.
Investment metrics
- 1% rule
- 1.36% ✓
- Cap rate
- 10.73%
- Cash-on-cash
- 15.85%
- DSCR
- 1.71
- GRM
- 6.1
CMA / ARV
- ARV (median comp)
- $144,796
- List price
- $99,000
- Delta
- -31.63%
- Verdict
- UNDERPRICED
- Comps
- 8 within 1.0 mi
Show comp detail 3 sales within ~0.75 mi
| Address | Dist | Beds/Ba | Sqft | Sold | Price | $/sf | Match |
|---|---|---|---|---|---|---|---|
| 221 N Henderson St | 0.27mi | 4/1.0 (+1) | 1,674 (-6%) | 7mo | $100,000 | $60 | 54 |
| 188 Pryor St | 0.39mi | 3/2.0 | 1,539 (-14%) | 2mo | $120,000 | $78 | 50 |
| 154 Caroline St | 0.62mi | 3/2.0 | 1,591 (-11%) | 20mo | $160,000 | $101 | 29 |
Match score weights: distance 35% · size 25% · config 20% · recency 20%. Top-matched comps best support the ARV.
Projected returns pro-forma
9.09% appreciation · 3.0% rent growth · sell at horizon
- IRR
- 34.4%
- Equity multiple
- 3.57×
- Total profit
- $71,165
- Equity at exit
- $82,700
- IRR
- 30.0%
- Equity multiple
- 7.85×
- Total profit
- $190,011
- Equity at exit
- $171,866
Cash invested: $27,720 (down + closing). Projections, not guarantees.
Landlord ↔ Tenant lean methodology
- Overall (STATE)
- 87 Strongly Landlord-Friendly
- State Texas
- 87 Strongly Landlord-Friendly · R+5
- County
- — inherits STATE
- City
- — inherits STATE
ZIP-level market 75785
- Home prices YoY
- 6.5%
- Active inventory
- 124
- Price-to-rent
- 6.1×
Monthly cashflow live
- Estimated rent
- $1,351 medium interval (Pro) →
- Mortgage (P&I)
- −$519
- Tax from tax record
- −$140 /mo · $1,686/yr
- Insurance
- −$41
- HOA
- −$0
- Vacancy / Maint / Mgmt
- −$284
- Net cashflow
- $366
Break-even live
Sensitivity live
| Price | -10% $422 | -5% $394 | +0% $366 | +5% $338 | +10% $310 |
|---|---|---|---|---|---|
| Rent | -10% $259 | -5% $313 | +0% $366 | +5% $419 | +10% $473 |
| Rate | -1.0pp $416 | -0.5pp $391 | base $366 | +0.5pp $340 | +1.0pp $314 |
UW: 25.0% down · 7.5% · 30yr · 1.5% tax · 5.0% vac · 8.0% maint · 8.0% mgmt
Financing live
Cash to close
- Down payment
- $24,750
- Closing costs
- $2,970
- Reserves months
- —
- Total cash needed
- —
Loan-product check · same deal, 3 products live
Conventional
25% down · 7.5% · 30yr
- Down + closing
- —
- Monthly P&I
- —
- Monthly cashflow
- —
- DSCR
- —
- Eligible?
- —
Personal DTI + credit; lowest rate.
DSCR
20% down · 8.5% · 30yr
- Down + closing
- —
- Monthly P&I
- —
- Monthly cashflow
- —
- DSCR
- —
- Eligible?
- —
No personal income docs; deal must DSCR.
Hard money
10% down · 12.0% · 12mo
- Down + closing
- —
- Monthly P&I
- —
- Monthly cashflow
- —
- DSCR
- —
- Eligible?
- —
Short-term bridge; refi at stabilization.
Listing history 5 events
-
2026-05-19status Pending 1332-char remark
-
2026-04-29$99,000 Active 1332-char remark
-
2021-03-12soldstatus
-
2020-10-15soldstatus 129-char remark
Show marketing remark (129 chars)
Investor special! Don't miss out on this great property in Rusk. 3 bed 2 bath, 1876 sq ft home on a corner lot. Bring all offers!
-
2020-07-31$55,999 129-char remark
Show marketing remark (129 chars)
Investor special! Don't miss out on this great property in Rusk. 3 bed 2 bath, 1876 sq ft home on a corner lot. Bring all offers!
ⓘ Source: listings_history table (triggers on properties + properties_extension) + one-shot
backfill from property_details.listing_events for pre-trigger history.
Tax reassessment forecast TX · Resets to sale price
- Current annual tax
- $1,686 · $140/mo
- Projected year-2 tax
- $1,812 · $151/mo
- Expected delta
- +$126/yr (+$10/mo · 7.5%)
ⓘ Screening estimate from a state-policy table — verify with the county assessor before closing.
Climate risk First Street
- Flood 1/10 Low FEMA zone X (unshaded) · 0% chance over 30 yrs
- Wildfire 4/10 Moderate
- Heat 7/10 Severe 7 d/yr ≥109°F today · 25 d/yr by 30 yrs out
- Wind 7/10 Severe 78% chance of damaging wind over 30 yrs
- Air quality 1/10 Low 0 unhealthy d/yr today · 0 by 30 yrs out
Nearby sold comps map
Loading sold comps map…
Walkable amenities ~0.75 mi
Loading nearby amenities…
Taxation est. · year 1
- Rental income
- $16,207
- − Mortgage interest
- −$5,546
- − Property taxes
- −$1,686
- − Insurance
- −$495
- − Repairs & maintenance
- −$1,297
- − Management
- −$1,297
- − Depreciation
- −$2,880
- Taxable income
- $3,007
- Est. tax owed @ 24.0%
- −$722
- After-tax cash flow
- $3,671/yr
For passive investors: Depreciation is non-cash, so a rental often shows a tax loss while cash-flowing — sheltering income. Rental losses are passive: they offset passive income freely, and up to $25,000/yr can offset ordinary (W-2) income if you actively participate and your MAGI is under $100k (phasing out to $0 by $150k); unused losses carry forward. On sale, claimed depreciation is recaptured at up to 25%, and gains may owe capital-gains tax (a 1031 exchange can defer both). Figures are a year-1 estimate at your 24.0% rate — not tax advice; consult a CPA.
Schools (NCES district)
- District
- Rusk ISD
- NCES district ID
- 4838360
- Math proficiency
- 40% ▼ -7.00%
- Reading proficiency
- 43% ▼ -1.00%
- Median HH income
- $41,890
- Composite
- 34.96/100
- National rank
- #5062
- State rank
- #380 of 826 in TX
Livability — Rusk
- Score
- 69/100
- State rank
- #405
- US rank
- #8394
Category grades
Schools grade is shown separately in the Schools card above.
Census & demographics
- Census place
- Rusk, TX
- Population (ZIP)
- 10,769
Population outlook (Cherokee County) Hauer SSP2
- Today (2025)
- 51,949 people
- By 2030
- 51,984 · +0.1%
- By 2040
- 51,780 · -0.3%
- By 2050
- 51,085 · -1.7%
- By 2075
- 47,418 · -8.7%
- By 2100
- 39,464 · -24.0%
Race, ethnicity, and origin ACS 2023
- Neighborhood character
- Diverse neighborhood (Simpson 0.60)
- Race & ethnicity
- White 57% Black 22% Hispanic / Latino 16% Two or more races 9%
- Hispanic origin (detail)
- Mexican 15%
- Common ancestry
- Lithuanian 1% Portuguese 1% Italian 1%
- Foreign-born
- 5% · Canada, Vietnam
- Languages at home
- 86% English-only · Spanish 13%
Political lean MEDSL · Cherokee
- 2024 margin
- Solid R (+62.7) · D 18.3% · R 80.9%
- 2008→2024 swing
- -19.5pp toward R · 2008: -43.2pp · 2024: -62.7pp
- All cycles
- 2024: R+62.7 2020: R+55.8 2016: R+56.5 2012: R+51.0 2008: R+43.2
Not yet ingested
- Civics
- —
Market trends
- HPI YoY
- ▲ 9.09%
- Current HPI
- 147.91
- Rent YoY
- —
- Metro
- —
- State GDP YoY
- ▲ 3.95%
- F500 in state
- 110
Industry mix (Fortune 500 HQ in TX)
| Industry | F500 HQs | Revenue |
|---|---|---|
| Energy | 16 | $1,198B |
|
||
| Technology | 5 | $198B |
|
||
| Engineering / Construction | 4 | $72B |
|
||
| Energy Services | 3 | $60B |
|
||
| Utilities | 3 | $41B |
|
||
| Healthcare | 2 | $330B |
|
||
Price history
+76.8% since first listed5 events — show timeline
- 2026-05-19 Pending — GTAR
- 2026-04-29 Listed $99,000 GTAR
- 2021-03-12 Sold (Public Records) — Public Records
- 2020-10-15 Sold (MLS) — GTAR
- 2020-07-31 Listed $55,999 GTAR
Property tax history
+0.5%/yrLatest (2025): $1,686 · -4.9% YoY. Source: county tax records.
Cash-flow waterfall
monthlySold comps — $/sqft
last 12 mo · ≤1 miLoading sold comps…