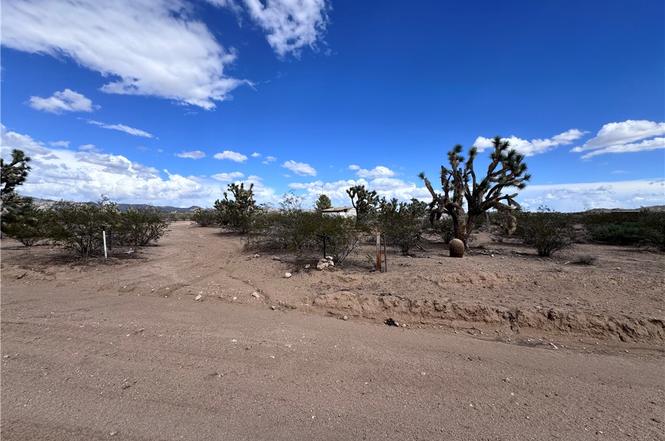
21188 S Cheyenne Rd · Yucca, AZ
Flood risk 1/10 · Minimal
- FEMA flood zone
- D
- Chance of flooding over 30 yrs
- 0.0%
- Est. flood insurance / yr
- $544 – $1,084
Fire risk 4/10 · Minor
- Est. fire insurance / yr
- $610 – $1,132
Heat risk 8/10 · Major
- Hot days now (above 103°F)
- 7 days/yr
- Hot days in 30 yrs
- 19 days/yr
Wind risk 1/10 · Minimal
- Chance of severe wind over 30 yrs
- —
Air-quality risk 1/10 · Minimal
- Unhealthy air days now
- 0 days/yr
- Unhealthy air days in 30 yrs
- 0 days/yr
Risk factors via First Street. Map © Google.
Why this score? — see what drove the A- grade
The composite is a weighted blend of 9 inputs, each scored 0–100. Each bar is that input's sub-score; the figure is the points it added to the 100-point composite (weight × sub-score).
- Cash flow +30.0/30.0
- 1% rule +10.0/10.0
- DSCR +10.0/10.0
- Appreciation +9.9/10.0
- ARV discount +7.5/15.0
- Schools +5.0/10.0
- Livability +2.8/5.0
- Rent growth +2.5/5.0
- Condition / age +2.5/5.0
$49,999
🖨 Deal sheet 📄 Offer letter ✓ Due diligence
Listing remarks
Handyman special, this property is a fixer upper and could be the perfect off-grid RV/off-road property.
Key facts
- 40.07 acre lot
- Built 2000
- Listed 218 days
Property features AI
Finance
- Other: Approximately 40.07 acres lot; Lot dimensions about 1320' x 1321'; Directions: From I-40 E take exit 20, take Alamo Rd to S Cheyenne Rd; after about 25 miles on Alamo Road turn right on Juniper Road, then to Cheyenne Road. Property is about 2 miles down Cheyenne Road on the left.; Subdivision: Stage Coach Trails; Cross street: Juniper
- HOA & community: Homeowners association with an annual fee of $200 (about $16.67/month)
Exterior
- Utilities: Septic tank
- Home design: Single-family residence; Residential property; R1 single-family residential zoning
- Construction: Rolled/hot mop roof
- Exterior features: No fencing; No pool
Interior
- Kitchen: Gas oven; Gas range
- Bathrooms: 1 full bathroom
- Heating & cooling: No heating; No cooling
- Interior features: Unfurnished; Gas oven and gas range; Water heater
- Laundry & utility: Dryer
Neighborhood map
What this means for you Summary
Snapshot
- This is a 4-bed/1.0-bath single-family listed at $50k.
Deal economics
- At list price, monthly cash flow is $667 ($8k/yr) — positive.
- The deal already cash-flows at list — no discount required.
- Meets the 1% rule at list price ($1k rent vs $50k).
- Recommended offer: $44k (12.0% below list) — sets the bar for market timing.
- Cap rate 22.3% vs local median 2.5% in Yucca — top-decile yield for the area; either an underpriced asset or a hidden risk that comps aren't pricing in. Stress-test before assuming the spread holds.
Location & tenants
- Location reads 55/100 on livability (#260 in AZ) — a working-class tenant base; expect higher turnover. Strengths: cost of living A+, crime A; Watch: schools C-, health & safety C-, amenities F.
- Market conditions: 329 active listings in the ZIP; 2,543 units permitted in Mohave County in 2024 (33 in 5+ unit buildings).
Forward outlook
- In year one you build about $5k of equity ($345 loan paydown + $5k appreciation (9.9% local appreciation)).
- Mohave County population projected to shrink 6% by 2050 — rents likely to lag national; underwrite the cash flow, not the appreciation.
- At projected returns (9.9% appreciation + 3.0% rent growth), your $14k cash investment doubles in ~2 years — after that, you're playing with house money.
- By year 6, paydown + projected appreciation supports a ~$31k cash-out refi (75% LTV) — recoverable capital for the next deal without selling this one.
Negotiation context
- It's been on market 218 days — a 12% lower offer ($44k) is reasonable based on typical stale-listing flexibility.
- Current owner paid $31k; list at $50k implies a 60% gain — meaningful room to come down on a strong offer.
Risks & watch-outs
- Climate carrying-cost: extreme-heat days projected 7→19/yr by 2055 (HVAC capex compounding) — expect insurance premiums to compound above CPI over the hold.
Questions for the listing agent
- It's been on market 218 days. Have you received any prior offers? Is the seller open to a 12% concession, seller financing, or rate buy-down credit?
- What does the HOA fee cover, when was the last increase, and are there any pending special assessments or reserve-fund shortfalls?
- Why hasn't it sold? Are there any deal-killer items the seller is aware of (foundation, flood, title, zoning, code violations)?
- Is there a deadline driving the sale (1031 exchange, divorce, estate, relocation)? That informs how much negotiation room exists.
- What's the average days-on-market for RENTAL listings here right now (not sales)? A rising rental-DOM trend means longer vacancies and softer asking-rent achievability than the comps imply.
- What's the recent tenant-quality profile in this submarket — average credit score on applications, eviction rate, late-payment / NSF rate, and stable-employment percentage? A property-management company in the area should have these aggregated.
- How much new for-sale + rental construction is in the pipeline within 1–3 miles? Heavy new supply typically softens prices + rents 12–24 months out; constrained supply supports both.
Investment metrics
- 1% rule
- 2.64% ✓
- Cap rate
- 22.31%
- Cash-on-cash
- 57.20%
- DSCR
- 3.55
- GRM
- 3.2
CMA / ARV
No comps found within radius.
Projected returns pro-forma
9.9% appreciation · 3.0% rent growth · sell at horizon
- IRR
- 69.7%
- Equity multiple
- 5.96×
- Total profit
- $69,414
- Equity at exit
- $44,661
- IRR
- 63.5%
- Equity multiple
- 13.21×
- Total profit
- $170,969
- Equity at exit
- $95,909
Cash invested: $14,000 (down + closing). Projections, not guarantees.
Landlord ↔ Tenant lean methodology
- Overall (STATE)
- 87 Strongly Landlord-Friendly
- State Arizona
- 87 Strongly Landlord-Friendly · R+3
- County
- — inherits STATE
- City
- — inherits STATE
ZIP-level market 86438
- Home prices YoY
- 3.6%
- Active inventory
- 329
- Price-to-rent
- 3.2×
Monthly cashflow live
- Estimated rent
- $1,322 medium interval (Pro) →
- Mortgage (P&I)
- −$262
- Tax from tax record
- −$77 /mo · $922/yr
- Insurance
- −$21
- HOA
- −$17
- Vacancy / Maint / Mgmt
- −$278
- Net cashflow
- $667
Break-even live
UW: 25.0% down · 7.5% · 30yr · 1.5% tax · 5.0% vac · 8.0% maint · 8.0% mgmt
Financing live
Cash to close
- Down payment
- $12,500
- Closing costs
- $1,500
- Reserves months
- —
- Total cash needed
- —
Loan-product check · same deal, 3 products live
Conventional
25% down · 7.5% · 30yr
- Down + closing
- —
- Monthly P&I
- —
- Monthly cashflow
- —
- DSCR
- —
- Eligible?
- —
Personal DTI + credit; lowest rate.
DSCR
20% down · 8.5% · 30yr
- Down + closing
- —
- Monthly P&I
- —
- Monthly cashflow
- —
- DSCR
- —
- Eligible?
- —
No personal income docs; deal must DSCR.
Hard money
10% down · 12.0% · 12mo
- Down + closing
- —
- Monthly P&I
- —
- Monthly cashflow
- —
- DSCR
- —
- Eligible?
- —
Short-term bridge; refi at stabilization.
HOA detail
- Monthly dues
- $17 · $204/yr
Listing history 9 events
-
2026-06-07statusdays on market $49,999 Pending 218 DOM
-
2026-06-02statusdays on market $49,999 Active 215 DOM
-
2026-05-03status Pending
-
2026-02-02price $49,999
-
2026-01-16price $55,000
-
2025-12-12price $60,000
-
2025-11-19price $65,000
-
2025-10-01$70,000 Active
-
1999-10-05soldstatus $31,300
ⓘ Source: listings_history table (triggers on properties + properties_extension) + one-shot
backfill from property_details.listing_events for pre-trigger history.
Tax reassessment forecast AZ · Resets to sale price
- Current annual tax
- $922 · $77/mo
- Projected year-2 tax
- $922 · $77/mo
- Expected delta
- $0/yr ($0/mo · 0.0%)
ⓘ Screening estimate from a state-policy table — verify with the county assessor before closing.
Climate risk First Street
- Flood 1/10 Low FEMA zone D · 0% chance over 30 yrs
- Wildfire 4/10 Moderate
- Heat 8/10 Severe 7 d/yr ≥103°F today · 19 d/yr by 30 yrs out
- Wind 1/10 Low
- Air quality 1/10 Low 0 unhealthy d/yr today · 0 by 30 yrs out
Nearby sold comps map
Loading sold comps map…
Walkable amenities ~0.75 mi
Loading nearby amenities…
Taxation est. · year 1
- Rental income
- $15,862
- − Mortgage interest
- −$2,801
- − Property taxes
- −$922
- − Insurance
- −$250
- − Repairs & maintenance
- −$1,269
- − Management
- −$1,269
- − HOA
- −$204
- − Depreciation
- −$1,455
- Taxable income
- $7,692
- Est. tax owed @ 24.0%
- −$1,846
- After-tax cash flow
- $6,162/yr
For passive investors: Depreciation is non-cash, so a rental often shows a tax loss while cash-flowing — sheltering income. Rental losses are passive: they offset passive income freely, and up to $25,000/yr can offset ordinary (W-2) income if you actively participate and your MAGI is under $100k (phasing out to $0 by $150k); unused losses carry forward. On sale, claimed depreciation is recaptured at up to 25%, and gains may owe capital-gains tax (a 1031 exchange can defer both). Figures are a year-1 estimate at your 24.0% rate — not tax advice; consult a CPA.
Schools (NCES district)
No district data.
Livability — Yucca
- Score
- 55/100
- State rank
- #260
- US rank
- #23315
Category grades
Schools grade is shown separately in the Schools card above.
Census & demographics
- Population (ZIP)
- 692
Population outlook (Mohave County) Hauer SSP2
- Today (2025)
- 209,184 people
- By 2030
- 209,674 · +0.2%
- By 2040
- 205,897 · -1.6%
- By 2050
- 196,810 · -5.9%
- By 2075
- 169,454 · -19.0%
- By 2100
- 136,630 · -34.7%
Race, ethnicity, and origin ACS 2023
- Neighborhood character
- Predominantly White (80%)
- Race & ethnicity
- White 80% Hispanic / Latino 12% Two or more races 8% Black 2% Native American 2%
- Hispanic origin (detail)
- Mexican 6%
- Common ancestry
- Lithuanian 9% Slovak 7% Russian 4%
- Foreign-born
- 2% · Canada, Jamaica
- Languages at home
- 98% English-only · Spanish 2%
Political lean MEDSL · Mohave
- 2024 margin
- Solid R (+55.8) · D 21.8% · R 77.6%
- 2008→2024 swing
- -22.9pp toward R · 2008: -32.9pp · 2024: -55.8pp
- All cycles
- 2024: R+55.8 2020: R+51.3 2016: R+51.5 2012: R+42.6 2008: R+32.9
Not yet ingested
- Civics
- —
Market trends
- HPI YoY
- ▲ 9.90%
- Current HPI
- 283.2861
- Rent YoY
- —
- Metro
- —
- State GDP YoY
- ▲ 4.54%
- F500 in state
- 20
Industry mix (Fortune 500 HQ in AZ)
| Industry | F500 HQs | Revenue |
|---|---|---|
| Technology | 2 | $13B |
|
||
| Mining / Metals | 1 | $23B |
|
||
| Environmental Services | 1 | $16B |
|
||
| Metals / Steel | 1 | $14B |
|
||
| Technology Distribution | 1 | $9B |
|
||
| Homebuilding | 1 | $8B |
|
||
Price history
+59.7% since first listed7 events — show timeline
- 2026-05-03 Pending — WARDEX
- 2026-02-02 Price Changed $49,999 WARDEX
- 2026-01-16 Price Changed $55,000 WARDEX
- 2025-12-12 Price Changed $60,000 WARDEX
- 2025-11-19 Price Changed $65,000 WARDEX
- 2025-10-01 Listed $70,000 WARDEX
- 1999-10-05 Sold (Public Records) $31,300 Public Records
Property tax history
+1.3%/yrLatest (2025): $922 · +9.1% YoY. Source: county tax records.
Cash-flow waterfall
monthlySold comps — $/sqft
last 12 mo · ≤1 miLoading sold comps…