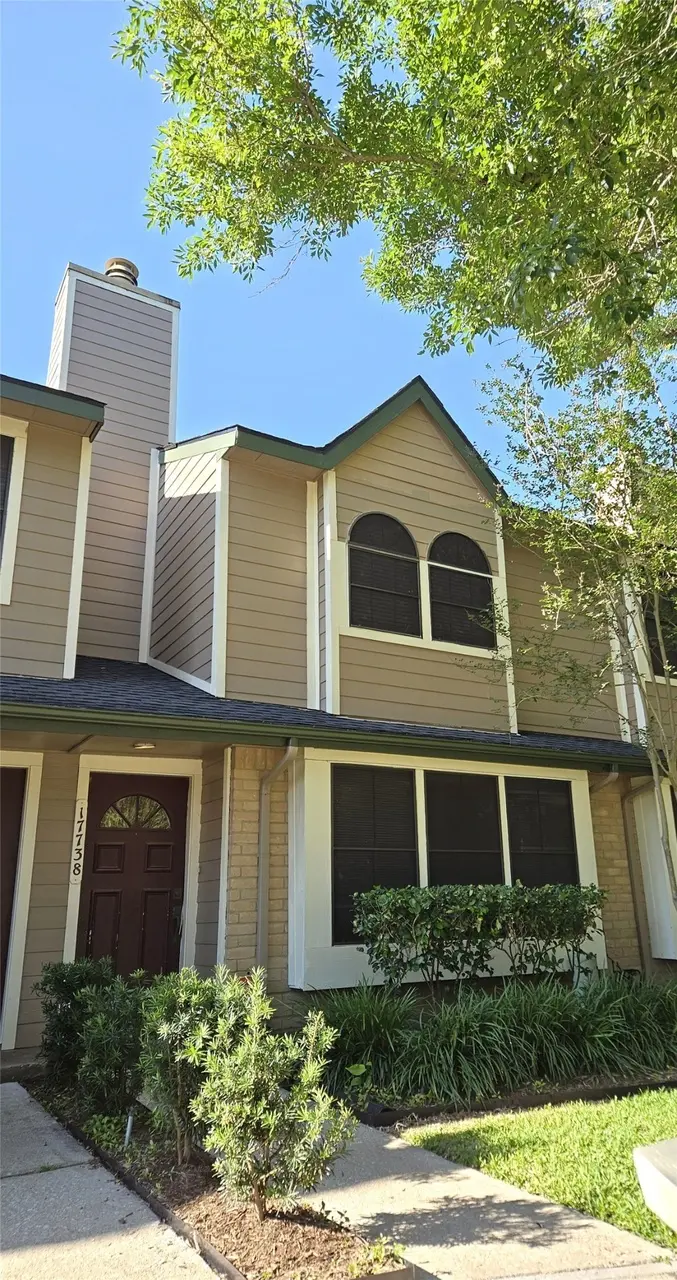
17738 Kings Park Ln · Houston, TX
Flood risk 6/10 · Moderate
- FEMA flood zone
- X (shaded)
- Chance of flooding over 30 yrs
- 0.54%
- Est. flood insurance / yr
- $507 – $1,088
Fire risk 1/10 · Minimal
- Est. fire insurance / yr
- $1,222 – $2,270
Heat risk 9/10 · Severe
- Hot days now (above 107°F)
- 7 days/yr
- Hot days in 30 yrs
- 24 days/yr
Wind risk 9/10 · Severe
- Chance of severe wind over 30 yrs
- 99.0%
Air-quality risk 2/10 · Minimal
- Unhealthy air days now
- 1 days/yr
- Unhealthy air days in 30 yrs
- 1 days/yr
Risk factors via First Street. Map © Google.
Why this score? — see what drove the A- grade
The composite is a weighted blend of 9 inputs, each scored 0–100. Each bar is that input's sub-score; the figure is the points it added to the 100-point composite (weight × sub-score).
- Cash flow +29.9/30.0
- ARV discount +15.0/15.0
- 1% rule +10.0/10.0
- DSCR +10.0/10.0
- Schools +4.6/10.0
- Appreciation +4.4/10.0
- Livability +3.7/5.0
- Rent growth +3.0/5.0
- Condition / age +2.5/5.0
$104,900
🖨 Deal sheet (PDF) 📄 Offer letter ✓ Due diligence
Listing remarks
This is an opportunity to make this property the townhome of your dreams in a gated neighborhood that is conveniently located to restaurants, shopping, and more. One of largest floor plans in the community featuring a good size living room with fireplace, dining area and breakfast room, laundry room indoors, 2 bedrooms and 2 full bathrooms upstairs, 2 car covered carport and storage closet. Property is being sold AS-IS.
Key facts
- Gated neighborhood
- Breakfast room
- Laundry room indoors
Tags
Property features AI
Finance
- Other: Community features: community pool, curbs, gutters
- HOA & community: Kings Park TOA; Association amenities include pool and gated community; Association fee paid annually (fee includes insurance, structural maintenance, and recreation facilities)
Exterior
- Parking: Detached carport; Additional parking space; Carport for 2 vehicles
- Security: Security gate
- Utilities: Public water; Public sewer
- Home design: Residential property; 2-story home; Built in 1979; Slab foundation; Composition roof
- Construction: Brick and wood siding construction
- Exterior features: Storage; Concrete road surface; Association pool
Interior
- Kitchen: Dishwasher; Electric oven and electric range; Microwave; Garbage disposal
- Bedrooms: Two bedrooms (both on the second floor) — approx. 16x11 and 13x14
- Flooring: Laminate; Tile; Vinyl
- Bathrooms: 2 full bathrooms; 1 half bathroom
- Heating & cooling: Central heating (electric); Central air conditioning (electric)
- Interior features: Wood-burning fireplace (1); Breakfast bar; Laminate counters; Pantry; Tub with shower; Window treatments / coverings; Combined living and dining area; 6 total rooms
- Laundry & utility: Laundry in utility room
Neighborhood map
What this means for you Summary
Snapshot
- This is a 2-bed/2.5-bath townhouse listed at $105k.
Deal economics
- At list price, monthly cash flow is $390 ($5k/yr) — positive.
- The deal already cash-flows at list — no discount required.
- Meets the 1% rule at list price ($2k rent vs $105k).
- Recommended offer: $102k (3.0% below list) — sets the bar for market timing.
- Cap rate 10.7% vs local median 3.2% in Houston — top-decile yield for the area; either an underpriced asset or a hidden risk that comps aren't pricing in. Stress-test before assuming the spread holds.
Location & tenants
- Location reads 74/100 on livability (#184 in TX, #4,771 nationally) — a middle-class / working-renter tenant base. Strengths: amenities A+, cost of living A+, housing A+; Watch: crime F.
- Clear Creek ISD (suburban): math 48% / reading 54% proficiency, ranked #114 of 826 in TX (top 14%) — acceptable for families but not a draw, mixed tenant base, ~2y average lease.
- Zoned schools: Armand Bayou El (math 41% / reading 45%, grade F, #1,283 of 4,322 statewide, top 30%, 500 students, 50% FRL); Space Center Int (math 31% / reading 44%, grade F, #736 of 1,662 statewide, top 45%, 827 students, 57% FRL); Clear Creek H S (math 51% / reading 54%, grade C-, #444 of 1,632 statewide, top 27%, 2,400 students, 0% FRL).
- Market conditions: Rents rising (+1.9%/yr); 134 active listings in the ZIP; 40 comparable units currently listed for rent nearby; rentals leasing fast (median 7d on market — plan ~1-2 weeks tenant-placement turnaround); 29,883 units permitted in Harris County in 2024 (8,621 in 5+ unit buildings).
Forward outlook
- Local home prices are declining (-1.2%/yr); year-one equity from $725 of loan paydown is wiped out by about $1k of value loss. Plan a longer hold.
- Harris County population projected at +47% by 2050 — long-run rental-demand tailwind backs the buy-and-hold thesis.
- At projected returns (-1.2% appreciation + 1.9% rent growth), your $29k cash investment doubles in ~7 years — after that, you're playing with house money.
Negotiation context
- It's been on market 39 days — a 3% lower offer ($102k) is reasonable based on typical stale-listing flexibility.
- 4 sale attempts since 21y ago with the ask held roughly flat each time — persistent listings suggest the price (not the market) is what's stuck; bring a comps-based counter.
- Current owner paid $42k; list at $105k implies a 150% gain — meaningful room to come down on a strong offer.
Risks & watch-outs
- Watch-outs: property tax is 3.3% of price.
- Climate carrying-cost: major flood risk; severe wind risk, 99% chance of damaging wind over 30y; extreme-heat days projected 7→24/yr by 2055 (HVAC capex compounding) — expect insurance premiums to compound above CPI over the hold.
Questions for the listing agent
- It's been on market 39 days. Have you received any prior offers? Is the seller open to a 3% concession, seller financing, or rate buy-down credit?
- Built in 1979 — when were the roof, HVAC, electrical panel, plumbing, and water heater last replaced?
- Property tax is high relative to price — has the assessment been appealed recently, and will the sale trigger a re-assessment?
- What does the HOA fee cover, when was the last increase, and are there any pending special assessments or reserve-fund shortfalls?
- Is there a deadline driving the sale (1031 exchange, divorce, estate, relocation)? That informs how much negotiation room exists.
- Schools are D-rated, which usually means shorter tenancies and higher turnover. Who's the typical renter profile here, and what's been the actual vacancy rate?
- Crime grade is F in this area — have there been break-ins, vandalism, or insurance claims at this property in the last 3 years? What carrier currently insures it and at what premium?
- What's the average days-on-market for RENTAL listings here right now (not sales)? A rising rental-DOM trend means longer vacancies and softer asking-rent achievability than the comps imply.
- What's the recent tenant-quality profile in this submarket — average credit score on applications, eviction rate, late-payment / NSF rate, and stable-employment percentage? A property-management company in the area should have these aggregated.
- How much new for-sale + rental construction is in the pipeline within 1–3 miles? Heavy new supply typically softens prices + rents 12–24 months out; constrained supply supports both.
Investment metrics
- 1% rule
- 1.59% ✓
- Cap rate
- 10.75%
- Cash-on-cash
- 15.92%
- DSCR
- 1.71
- GRM
- 5.2
CMA / ARV
- ARV (median comp)
- $162,655
- List price
- $104,900
- Delta
- -35.51%
- Verdict
- UNDERPRICED
- Comps
- 20 within 1.0 mi
Show comp detail 12 sales within ~0.75 mi
| Address | Dist | Beds/Ba | Sqft | Sold | Price | $/sf | Match |
|---|---|---|---|---|---|---|---|
| 17822 Kings Park Ln | 0.08mi | 2/2.5 | 1,350 (-2%) | 14mo | $169,900 | $126 | 82 |
| 17746 Kings Park Ln | 0.01mi | 2/2.5 | 1,282 (-7%) | 13mo | $183,000 | $143 | 78 |
| 17732 Kings Park Ln | 0.00mi | 2/2.5 | 1,282 (-7%) | 21mo | $135,000 | $105 | 71 |
| 1210 Saxony Ln | 0.43mi | 2/2.5 | 1,512 (+10%) | 4mo | $247,000 | $163 | 59 |
| 18112 Heritage Ln #8112 | 0.73mi | 2/2.5 | 1,360 (-1%) | 11mo | $185,000 | $136 | 56 |
| 18202 Vinland Dr #8202 | 0.74mi | 2/2.5 | 1,360 (-1%) | 11mo | $179,000 | $132 | 55 |
| 18214 Heritage Ln #8214 | 0.73mi | 2/2.5 | 1,280 (-7%) | 3mo | $174,500 | $136 | 52 |
| 803 Knights Bridge Ln Unit A | 0.55mi | 2/2.5 | 1,491 (+9%) | 14mo | $220,000 | $148 | 48 |
| 18114 Heritage Ln #8114 | 0.73mi | 2/2.5 | 1,280 (-7%) | 16mo | $169,900 | $133 | 42 |
| 18617 Egret Bay Blvd #1101 | 0.72mi | 2/2.5 | 1,260 (-8%) | 16mo | $165,000 | $131 | 40 |
| 1701 San Sebastian Ln #1701 | 0.73mi | 2/2.5 | 1,280 (-7%) | 20mo | $169,000 | $132 | 38 |
| 18204 Heritage Ln #8204 | 0.73mi | 2/2.5 | 1,280 (-7%) | 22mo | $160,000 | $125 | 36 |
Match score weights: distance 35% · size 25% · config 20% · recency 20%. Top-matched comps best support the ARV.
Projected returns pro-forma
-1.22% appreciation · 1.92% rent growth · sell at horizon
- IRR
- 11.1%
- Equity multiple
- 1.48×
- Total profit
- $14,241
- Equity at exit
- $24,228
- IRR
- 16.5%
- Equity multiple
- 2.54×
- Total profit
- $45,257
- Equity at exit
- $24,520
Cash invested: $29,372 (down + closing). Projections, not guarantees.
Landlord ↔ Tenant lean methodology
- Overall (STATE)
- 87 Strongly Landlord-Friendly
- State Texas
- 87 Strongly Landlord-Friendly · R+5
- County
- — inherits STATE
- City
- — inherits STATE
ZIP-level market 77058
- Home prices YoY
- -0.5%
- Rents YoY
- 1.9%
- Active inventory
- 134
- Price-to-rent
- 5.2×
Monthly cashflow live
- Estimated rent
- $1,666 high interval (Pro) →
- Mortgage (P&I)
- −$550
- Tax from tax record
- −$291 /mo · $3,492/yr
- Insurance
- −$44
- HOA
- −$42
- Vacancy / Maint / Mgmt
- −$350
- Net cashflow
- $390
Break-even live
Sensitivity live
| Price | -10% $449 | -5% $419 | +0% $390 | +5% $360 | +10% $330 |
|---|---|---|---|---|---|
| Rent | -10% $258 | -5% $324 | +0% $390 | +5% $455 | +10% $521 |
| Rate | -1.0pp $442 | -0.5pp $416 | base $390 | +0.5pp $362 | +1.0pp $335 |
UW: 25.0% down · 7.5% · 30yr · 1.5% tax · 5.0% vac · 8.0% maint · 8.0% mgmt
Financing live
Cash to close
- Down payment
- $26,225
- Closing costs
- $3,147
- Reserves months
- —
- Total cash needed
- —
Loan-product check · same deal, 3 products live
Conventional
25% down · 7.5% · 30yr
- Down + closing
- —
- Monthly P&I
- —
- Monthly cashflow
- —
- DSCR
- —
- Eligible?
- —
Personal DTI + credit; lowest rate.
DSCR
20% down · 8.5% · 30yr
- Down + closing
- —
- Monthly P&I
- —
- Monthly cashflow
- —
- DSCR
- —
- Eligible?
- —
No personal income docs; deal must DSCR.
Hard money
10% down · 12.0% · 12mo
- Down + closing
- —
- Monthly P&I
- —
- Monthly cashflow
- —
- DSCR
- —
- Eligible?
- —
Short-term bridge; refi at stabilization.
Rent comps 40 comps
| Address | Beds | Baths | Sqft | Rent | $/sqft | DOM | Units | Dist |
|---|---|---|---|---|---|---|---|---|
| 1235 E Nasa Pkwy Houston, TX | 1.0–3.0 | 1.0–3.0 | 1252 | $2,260 | $1.80 | 0d | 33 | 0.01mi |
| 1315 E NASA Pkwy Houston, TX | 1.0–3.0 | 1.0–2.5 | 1214 | $1,358 | $1.12 | 0d | 36 | 0.10mi |
| 1241 E Nasa Pkwy Houston, TX | 1.0 | 1.0 | 941 | $1,695 | $1.80 | 45d | 1 | 0.14mi |
| 1110 El Camino Village Dr Houston, TX | 1.0–3.0 | 1.0–2.5 | 1143 | $1,372 | $1.20 | 0d | 69 | 0.21mi |
| 17700 El Camino Real Unit 3047 Houston, TX | 3.0 | 2.0 | 1236 | $1,600 | $1.29 | 0d | 1 | 0.41mi |
| 17700 El Camino Real Unit 2047 Houston, TX | 2.0 | 2.0 | 893 | $1,164 | $1.30 | 0d | 1 | 0.41mi |
| 1400 El Camino Village Dr Houston, TX | 1.0–2.0 | 1.0–2.0 | 1060 | $1,957 | $1.85 | 0d | 33 | 0.41mi |
| 17632 El Camino Real Houston, TX | 2.0 | 1.0 | 893 | $964 | $1.08 | 26d | 1 | 0.47mi |
| 17700 El Camino Real Houston, TX | 3.0 | 1.0–2.0 | 827 | $1,400 | $1.69 | 21d | 17 | 0.47mi |
| 17700 El Camino Real Unit 17733 Houston, TX | 3.0 | 2.0 | 1236 | $1,549 | $1.25 | 0d | 1 | 0.48mi |
| 17700 El Camino Real Unit 422 Houston, TX | 2.0 | 2.0 | 893 | $1,139 | $1.28 | 9d | 1 | 0.48mi |
| 17700 El Camino Real Unit 2162 Houston, TX | 2.0 | 2.0 | 893 | $1,139 | $1.28 | 7d | 1 | 0.48mi |
| 17700 El Camino Real Unit 17757 Houston, TX | 2.0 | 2.0 | 893 | $1,123 | $1.26 | 0d | 1 | 0.48mi |
| 18101 Point Lookout Dr Houston, TX | 1.0–2.0 | 1.0–2.0 | 1000 | $2,930 | $2.93 | 22d | 15 | 0.53mi |
| 18107 Point Lookout Dr Houston, TX | 3.0 | 2.0 | 1422 | $2,370 | $1.67 | 45d | 1 | 0.53mi |
| 801 E Nasa Road 1 Webster, TX | 1.0–2.0 | 1.0 | 827 | $1,440 | $1.74 | 45d | 39 | 0.55mi |
| 18101 Point Lookout Dr Unit 2174 Houston, TX | 2.0 | 2.0 | 1224 | $1,974 | $1.61 | 0d | 1 | 0.56mi |
| 18101 Point Lookout Dr Apt 422 Houston, TX | 2.0 | 2.0 | 1224 | $1,990 | $1.63 | 9d | 1 | 0.56mi |
| 18101 Point Lookout Dr Unit 18134 Houston, TX | 3.0 | 2.0 | 1422 | $2,479 | $1.74 | 0d | 1 | 0.56mi |
| 18101 Point Lookout Dr Unit 3174 Houston, TX | 3.0 | 2.0 | 1422 | $2,530 | $1.78 | 0d | 1 | 0.56mi |
| 18101 Point Lookout Dr Unit 18138 Houston, TX | 2.0 | 2.0 | 1224 | $1,880 | $1.54 | 45d | 1 | 0.56mi |
| 18101 Point Lookout Dr Unit 156 Houston, TX | 2.0 | 2.0 | 1336 | $2,630 | $1.97 | 0d | 1 | 0.56mi |
| 18101 Point Lookout Dr Unit 424 Houston, TX | 2.0 | 2.0 | 1224 | $1,990 | $1.63 | 7d | 1 | 0.59mi |
| 18707 Egret Bay Blvd Houston, TX | 1.0–2.0 | 1.0–2.0 | 1283 | $1,849 | $1.44 | 3d | 10 | 0.74mi |
| 18713 Egret Bay Blvd Houston, TX | 2.0 | 2.0 | 1265 | $1,549 | $1.22 | 45d | 1 | 0.76mi |
| 200 Water St Webster, TX | 1.0–3.0 | 1.0–2.0 | 1094 | $1,734 | $1.59 | 0d | 38 | 0.78mi |
| 1300 Gemini St Houston, TX | 1.0–2.0 | 1.0–2.0 | 956 | $1,949 | $2.04 | 0d | 30 | 0.85mi |
| 18296 Upper Bay Rd Houston, TX | 2.0 | 2.0 | 990 | $1,145 | $1.16 | 45d | 1 | 0.86mi |
| 18296 Upper Bay Rd Houston, TX | 3.0 | 2.0 | 1120 | $1,380 | $1.23 | 26d | 1 | 0.86mi |
| 18296 Upper Bay Rd Houston, TX | 2.0 | 2.0 | 990 | $1,145 | $1.16 | 23d | 1 | 0.86mi |
| 206 Water St Unit 26103 Webster, TX | 2.0 | 2.0 | 1122 | $1,540 | $1.37 | 45d | 1 | 0.89mi |
| 501 Sarah Deel Dr Unit 538 Webster, TX | 2.0 | 2.0 | 1275 | $1,838 | $1.44 | 0d | 1 | 0.90mi |
| 501 Sarah Deel Dr Apt 424 Webster, TX | 2.0 | 2.0 | 1275 | $1,854 | $1.45 | 9d | 1 | 0.90mi |
| 501 Sarah Deel Dr Unit 2047 Webster, TX | 2.0 | 2.0 | 1275 | $1,879 | $1.47 | 0d | 1 | 0.91mi |
| 501 Sarah Deel Dr Unit 2047 Webster, TX | 2.0 | 2.0 | 1275 | $1,889 | $1.48 | 12d | 1 | 0.91mi |
| 501 Sarah Deel Dr Webster, TX | 1.0–2.0 | 1.0–2.0 | 931 | $2,406 | $2.58 | 12d | 5 | 0.91mi |
| 2041 San Sebastian Ct Unit 2047 Houston, TX | 2.0 | 2.0 | 1020 | $1,194 | $1.17 | 12d | 1 | 0.93mi |
| 2041 San Sebastian Ct Unit 2162 Houston, TX | 2.0 | 2.0 | 1020 | $1,159 | $1.14 | 9d | 1 | 0.93mi |
| 2041 San Sebastian Ct Unit 2074 Houston, TX | 3.0 | 2.0 | 1348 | $1,473 | $1.09 | 0d | 1 | 0.93mi |
| 2041 San Sebastian Ct Unit 2098 Houston, TX | 2.0 | 2.0 | 1020 | $1,143 | $1.12 | 0d | 1 | 0.93mi |
HOA detail
- Monthly dues
- $42 · $504/yr
- Likely covers
- security
Listing history 24 events
-
2026-06-21days on market $104,900 Pending 39 DOM
-
2026-06-18days on market $104,900 Pending 36 DOM
-
2026-06-17days on market $104,900 Pending 35 DOM
-
2026-06-16days on market $104,900 Pending 34 DOM
-
2026-06-15days on market $104,900 Pending 33 DOM
-
2026-06-13statusdays on market $104,900 Pending 31 DOM
-
2026-06-13days on market $104,900 Active 30 DOM
-
2026-06-10status $104,900 Active 27 DOM
-
2026-06-09days on market $104,900 Pending 27 DOM
-
2026-06-08days on market $104,900 Pending 26 DOM
-
2026-06-07statusdays on market $104,900 Pending 25 DOM
-
2026-06-04days on market $104,900 Active 22 DOM
-
2026-06-03days on market $104,900 Active 21 DOM
-
2026-06-02days on market $104,900 Active 20 DOM
-
2026-06-01days on market $104,900 Active 19 DOM
-
2026-05-31days on market $104,900 Active 18 DOM
-
2026-05-17status Active 423-char remark
-
2026-05-16status Pending 423-char remark
-
2026-05-13$104,900 Active 423-char remark
-
2026-02-09soldstatus
-
2005-07-29soldstatus
-
2005-04-30historical
-
2005-04-08$84,900
-
1996-06-01soldstatus $42,000
ⓘ Source: listings_history table (triggers on properties + properties_extension) + one-shot
backfill from property_details.listing_events for pre-trigger history.
Tax reassessment forecast TX · Resets to sale price
- Current annual tax
- $3,492 · $291/mo
- Projected year-2 tax
- $3,492 · $291/mo
- Expected delta
- $0/yr ($0/mo · 0.0%)
ⓘ Screening estimate from a state-policy table — verify with the county assessor before closing.
Climate risk First Street
- Flood 6/10 Major FEMA zone X (shaded) · 54% chance over 30 yrs
- Wildfire 1/10 Low
- Heat 9/10 Extreme 7 d/yr ≥107°F today · 24 d/yr by 30 yrs out
- Wind 9/10 Extreme 99% chance of damaging wind over 30 yrs
- Air quality 2/10 Low 1 unhealthy d/yr today · 1 by 30 yrs out
Nearby sold comps map
Loading sold comps map…
Walkable amenities ~0.75 mi
Loading nearby amenities…
Taxation est. · year 1
- Rental income
- $19,995
- − Mortgage interest
- −$5,876
- − Property taxes
- −$3,492
- − Insurance
- −$524
- − Repairs & maintenance
- −$1,600
- − Management
- −$1,600
- − HOA
- −$504
- − Depreciation
- −$3,052
- Taxable income
- $3,348
- Est. tax owed @ 24.0%
- −$804
- After-tax cash flow
- $3,871/yr
For passive investors: Depreciation is non-cash, so a rental often shows a tax loss while cash-flowing — sheltering income. Rental losses are passive: they offset passive income freely, and up to $25,000/yr can offset ordinary (W-2) income if you actively participate and your MAGI is under $100k (phasing out to $0 by $150k); unused losses carry forward. On sale, claimed depreciation is recaptured at up to 25%, and gains may owe capital-gains tax (a 1031 exchange can defer both). Figures are a year-1 estimate at your 24.0% rate — not tax advice; consult a CPA.
Schools (NCES district)
- District
- Clear Creek ISD
- NCES district ID
- 4814280
- Math proficiency
- 48% ▼ -10.00%
- Reading proficiency
- 54% ▼ -4.00%
- Median HH income
- $80,240
- Composite
- 46.49/100
- National rank
- #2431
- State rank
- #114 of 826 in TX
Livability — Houston
- Score
- 74/100
- State rank
- #184
- US rank
- #4771
Category grades
Schools grade is shown separately in the Schools card above.
Census & demographics
- Census place
- Houston, TX
- County
- Harris County · 4,702,590 people
- City population
- 3,226,434
- Metro
- Houston-The Woodlands-Sugar Land, TX
- Population (ZIP)
- 17,850
- Household income
- $68,722
- Rent vs Own
- Severe rent burden
- 1147.0
Population outlook (Harris County) Hauer SSP2
- Today (2025)
- 5,571,493 people
- By 2030
- 6,089,821 · +9.3%
- By 2040
- 7,142,806 · +28.2%
- By 2050
- 8,185,864 · +46.9%
- By 2075
- 10,574,329 · +89.8%
- By 2100
- 12,109,958 · +117.4%
Race, ethnicity, and origin ACS 2023
- Neighborhood character
- Diverse neighborhood (Simpson 0.64)
- Race & ethnicity
- White 55% Hispanic / Latino 21% Two or more races 15% Asian 10% Black 5%
- Hispanic origin (detail)
- Mexican 14% Puerto Rican 1%
- Common ancestry
- Italian 6% Lithuanian 3% Portuguese 2%
- Foreign-born
- 21% · Canada, Vietnam, China
- Languages at home
- 70% English-only · Spanish 15% Other Indo-European 5% Vietnamese 2%
Political lean MEDSL · Harris
- 2024 margin
- Lean D (+5.5) · D 52.0% · R 46.4% · Other 1.6%
- 2008→2024 swing
- +3.9pp toward D · 2008: 1.6pp · 2024: 5.5pp
- All cycles
- 2024: D+5.5 2020: D+13.3 2016: D+12.4 2012: D+0.1 2008: D+1.6
Not yet ingested
- Civics
- —
Market trends
- HPI YoY
- ▼ -1.22%
- Current HPI
- 225.0251
- Rent YoY
- ▲ 1.92%
- Metro
- Houston-The Woodlands-Sugar Land, TX
- State GDP YoY
- ▲ 3.95%
- F500 in state
- 110
Industry mix (Fortune 500 HQ in TX)
| Industry | F500 HQs | Revenue |
|---|---|---|
| Energy | 16 | $1,198B |
|
||
| Technology | 5 | $198B |
|
||
| Engineering / Construction | 4 | $72B |
|
||
| Energy Services | 3 | $60B |
|
||
| Utilities | 3 | $41B |
|
||
| Healthcare | 2 | $330B |
|
||
Price history
+149.8% since first listed11 events — show timeline
- 2026-06-13 Pending — HARMLS
- 2026-06-09 Relisted — HARMLS
- 2026-06-05 Pending — HARMLS
- 2026-05-17 Relisted — HARMLS
- 2026-05-16 Pending — HARMLS
- 2026-05-13 Listed $104,900 HARMLS
- 2026-02-09 Sold (Public Records) — Public Records
- 2005-07-29 Sold (Public Records) — Public Records
- 2005-04-30 Listing Removed — HARMLS
- 2005-04-08 Listed $84,900 HARMLS
- 1996-06-01 Sold (Public Records) $42,000 Public Records
Property tax history
+6.5%/yrLatest (2025): $3,492 · +0.9% YoY. Source: county tax records.
Cash-flow waterfall
monthlySold comps — $/sqft
last 12 mo · ≤1 miLoading sold comps…